
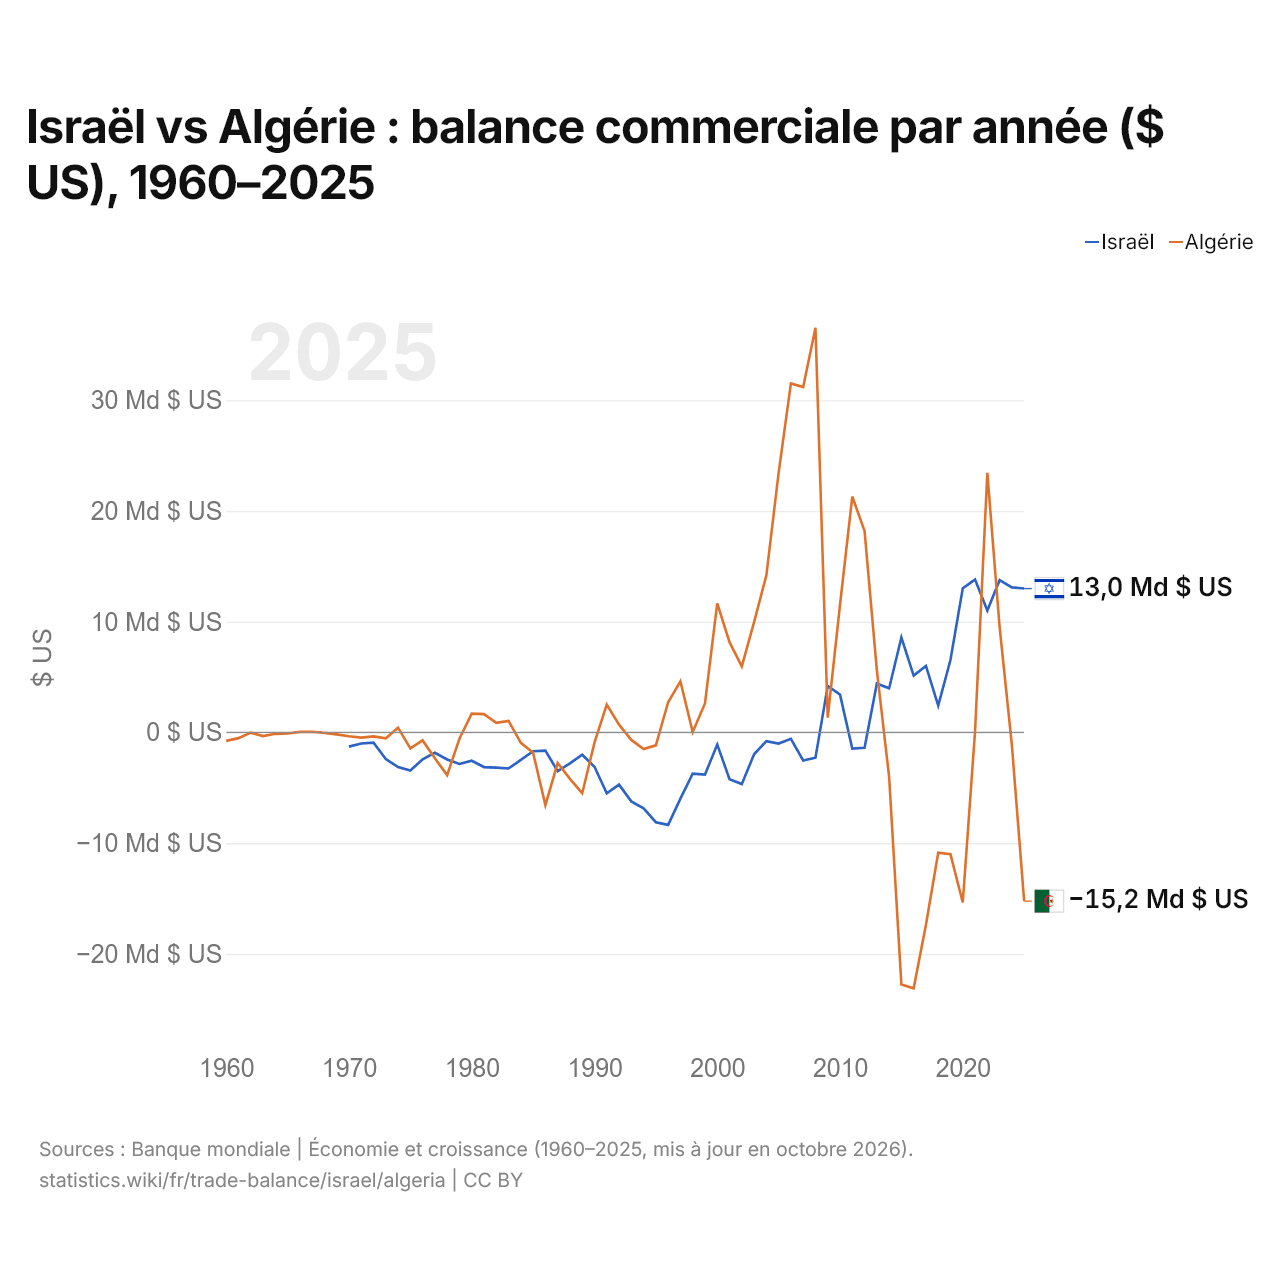
Israël vs Algérie : balance commerciale par année ($ US), 1960–2025
| Année | $ US | |
|---|---|---|
 Israël |
 Algérie |
|
| 2025 | 12 994 365 505 $ US | −15 239 617 821 $ US |
| 2024 | 13 100 279 099 $ US | −1 157 584 835 $ US |
| 2023 | 13 754 663 733 $ US | 9 521 076 816 $ US |
| 2022 | 11 000 808 302 $ US | 23 444 752 182 $ US |
| 2021 | 13 804 496 055 $ US | 96 235 574 $ US |
| 2020 | 13 021 165 408 $ US | −15 365 137 785 $ US |
| 2019 | 6 557 503 906 $ US | −11 009 709 489 $ US |
| 2018 | 2 413 018 727 $ US | −10 875 510 422 $ US |
| 2017 | 6 004 796 901 $ US | −17 380 666 509 $ US |
| 2016 | 5 128 475 225 $ US | −23 115 278 741 $ US |
| 2015 | 8 575 319 326 $ US | −22 777 389 612 $ US |
| 2014 | 3 984 226 053 $ US | −4 025 154 588 $ US |
| 2013 | 4 406 103 796 $ US | 5 622 451 757 $ US |
| 2012 | −1 392 248 402 $ US | 18 189 545 505 $ US |
| 2011 | −1 462 187 515 $ US | 21 300 645 647 $ US |
| 2010 | 3 412 251 219 $ US | 11 529 793 187 $ US |
| 2009 | 4 198 677 110 $ US | 1 333 701 926 $ US |
| 2008 | −2 287 048 495 $ US | 36 556 358 659 $ US |
| 2007 | −2 539 773 861 $ US | 31 196 364 969 $ US |
| 2006 | −575 153 283 $ US | 31 525 542 339 $ US |
| 2005 | −1 009 500 635 $ US | 23 445 463 437 $ US |
| 2004 | −793 186 301 $ US | 14 180 370 410 $ US |
| 2003 | −1 975 804 879 $ US | 9 970 802 368 $ US |
| 2002 | −4 669 753 894 $ US | 5 957 664 162 $ US |
| 2001 | −4 222 578 168 $ US | 8 147 248 966 $ US |
| 2000 | −1 098 518 628 $ US | 11 659 995 021 $ US |
| 1999 | −3 810 722 999 $ US | 2 612 547 339 $ US |
| 1998 | −3 730 624 984 $ US | 30 000 490 $ US |
| 1997 | −5 975 502 116 $ US | 4 609 976 585 $ US |
| 1996 | −8 351 877 056 $ US | 2 730 002 864 $ US |
| 1995 | −8 115 948 262 $ US | −1 170 007 106 $ US |
| 1994 | −6 867 235 894 $ US | −1 498 790 716 $ US |
| 1993 | −6 232 770 220 $ US | −676 792 326 $ US |
| 1992 | −4 720 523 362 $ US | 696 095 512 $ US |
| 1991 | −5 509 077 267 $ US | 2 522 617 373 $ US |
| 1990 | −3 103 552 723 $ US | −926 597 364 $ US |
| 1989 | −2 010 870 382 $ US | −5 493 813 611 $ US |
| 1988 | −2 800 375 258 $ US | −4 192 895 866 $ US |
| 1987 | −3 498 185 125 $ US | −2 763 033 271 $ US |
| 1986 | −1 649 481 113 $ US | −6 571 229 226 $ US |
| 1985 | −1 698 280 601 $ US | −1 829 825 550 $ US |
| 1984 | −2 488 666 439 $ US | −943 135 164 $ US |
| 1983 | −3 259 483 986 $ US | 1 044 102 802 $ US |
| 1982 | −3 188 683 128 $ US | 871 043 284 $ US |
| 1981 | −3 131 228 070 $ US | 1 645 114 472 $ US |
| 1980 | −2 559 607 843 $ US | 1 693 833 066 $ US |
| 1979 | −2 851 200 000 $ US | −570 943 669 $ US |
| 1978 | −2 447 647 059 $ US | −3 857 888 449 $ US |
| 1977 | −1 834 000 000 $ US | −2 339 177 208 $ US |
| 1976 | −2 433 750 000 $ US | −720 491 495 $ US |
| 1975 | −3 438 333 333 $ US | −1 443 254 204 $ US |
| 1974 | −3 132 500 000 $ US | 430 545 118 $ US |
| 1973 | −2 412 500 000 $ US | −529 969 047 $ US |
| 1972 | −925 000 000 $ US | −357 101 806 $ US |
| 1971 | −1 000 000 000 $ US | −468 180 171 $ US |
| 1970 | −1 283 333 333 $ US | −344 334 543 $ US |
| 1969 | - | −182 294 787 $ US |
| 1968 | - | −40 509 939 $ US |
| 1967 | - | 60 764 909 $ US |
| 1966 | - | 40 509 939 $ US |
| 1965 | - | −101 274 848 $ US |
| 1964 | - | −126 721 207 $ US |
| 1963 | - | −328 164 535 $ US |
| 1962 | - | −20 510 283 $ US |
| 1961 | - | −517 608 091 $ US |
| 1960 | - | −765 348 446 $ US |
En 2025, la balance commerciale d'Israël affichait un excédent de 13 milliards de dollars et celle de l'Algérie un déficit de 15,2 milliards de dollars. En 1970, la balance commerciale d'Israël affichait un déficit de 1,28 milliard de dollars et celle de l'Algérie un déficit de 344 millions de dollars.
De 1970 à 2025, la balance commerciale d'Israël a été excédentaire pendant 15 des 56 années, et celle de l'Algérie pendant 28. Les balances commerciales d'Israël et de l'Algérie ont été déficitaires en même temps pendant 19 de ces années, la dernière fois en 1995.
Israël vs Algérie : chiffres de la balance commerciale
|
Israël
|
Algérie
|
|
|---|---|---|
| Biens et services, $ US | +13,0 Md $US (2025) | −15,2 Md $US (2025) |
| % du PIB | +2,1 % (2025) | −5,3 % (2025) |
| Années d'excédent depuis 2000 | 15 sur 26 | 17 sur 26 |
| Solde des biens entre les deux, chiffres propres | n.d. | n.d. |
| Premier excédent en biens avec | États-Unis (+6,12 Md $US, 2025) | Italie (+9,26 Md $US, 2024) |
| Premier déficit en biens avec | Chine (−18,0 Md $US, 2025) | Chine (−8,59 Md $US, 2024) |
Comparer la balance commerciale de 2 pays au choix
Sources :
- Banque mondiale | Économie et croissance (1960–2025, mis à jour en octobre 2026)
- TradeMap (2006–2025, mis à jour en octobre 2026)
Creative Commons Attribution (CC BY) : vous pouvez copier, partager, adapter et réutiliser ce contenu, y compris à des fins commerciales, à condition de citer statistics.wiki et d’indiquer les modifications apportées. Les sources citées ci-dessus peuvent avoir leurs propres conditions de licence.