
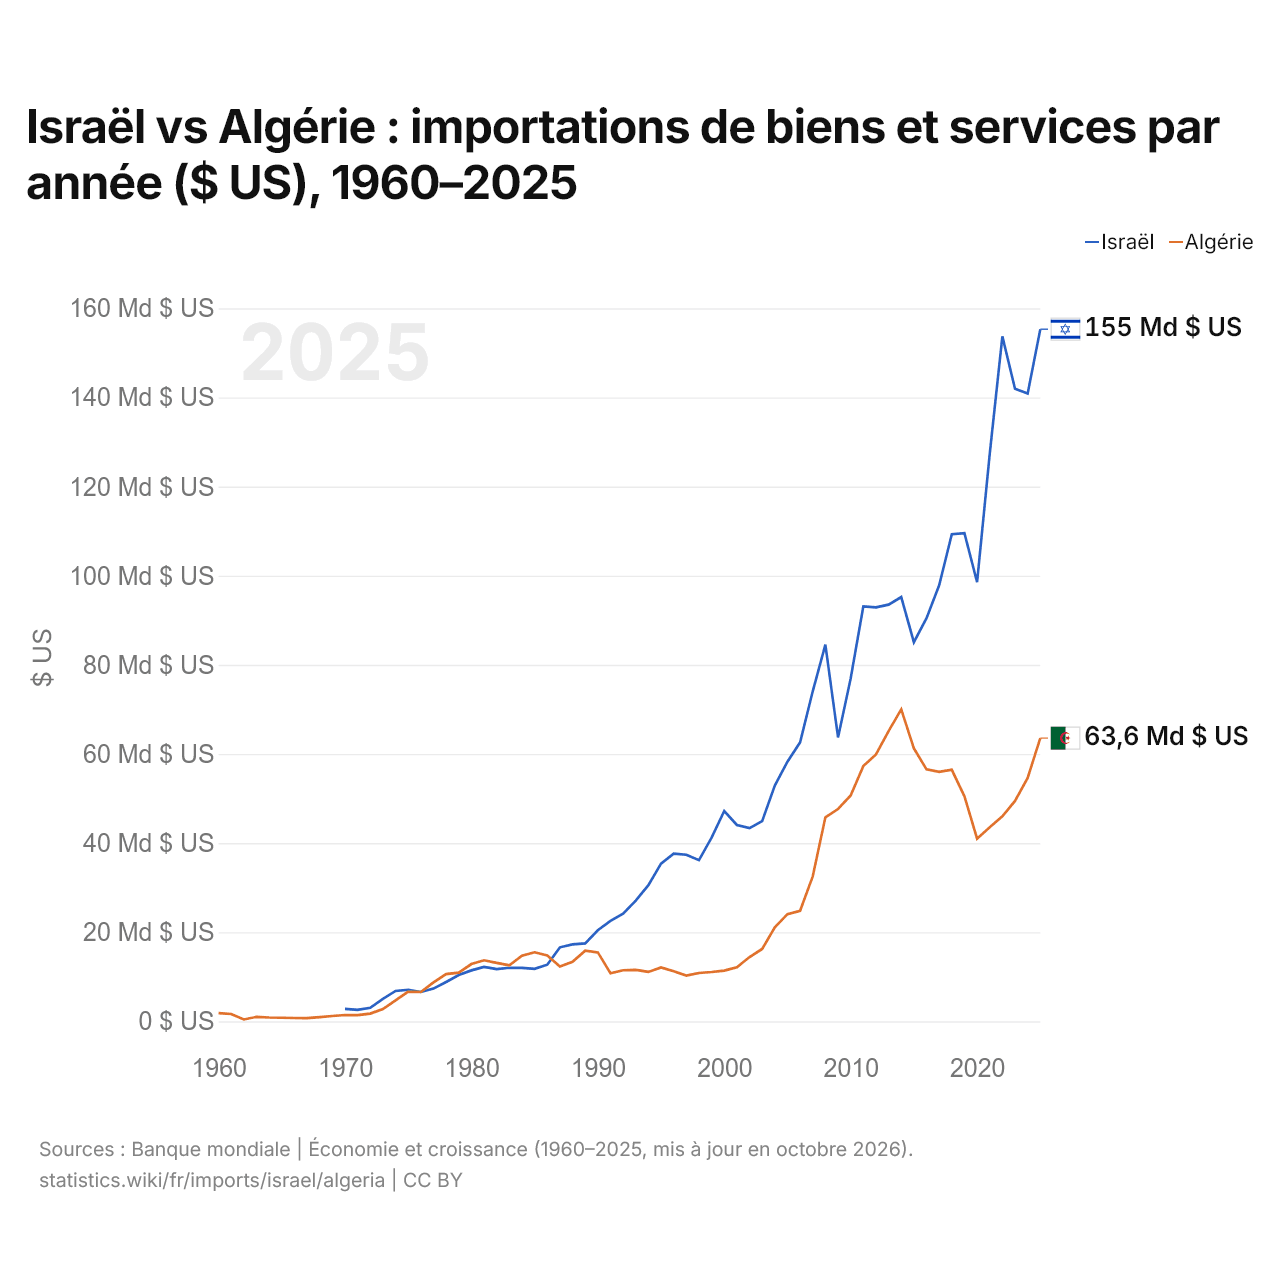
Israël vs Algérie : importations de biens et services par année ($ US), 1960–2025
| Année | $ US | |
|---|---|---|
 Israël |
 Algérie |
|
| 2025 | 155 326 013 611 $ US | 63 560 679 354 $ US |
| 2024 | 140 903 132 496 $ US | 54 624 467 792 $ US |
| 2023 | 141 949 720 798 $ US | 49 460 165 881 $ US |
| 2022 | 153 716 570 794 $ US | 46 015 346 670 $ US |
| 2021 | 127 330 211 936 $ US | 43 564 492 198 $ US |
| 2020 | 98 559 641 596 $ US | 40 978 554 436 $ US |
| 2019 | 109 553 655 514 $ US | 50 490 845 024 $ US |
| 2018 | 109 319 594 929 $ US | 56 446 212 848 $ US |
| 2017 | 97 866 153 832 $ US | 55 990 439 550 $ US |
| 2016 | 90 475 144 467 $ US | 56 532 525 720 $ US |
| 2015 | 85 081 011 363 $ US | 61 266 393 934 $ US |
| 2014 | 95 211 692 531 $ US | 70 019 891 159 $ US |
| 2013 | 93 509 987 330 $ US | 65 124 130 006 $ US |
| 2012 | 92 906 239 603 $ US | 59 908 816 253 $ US |
| 2011 | 93 102 471 848 $ US | 57 272 844 072 $ US |
| 2010 | 76 948 241 162 $ US | 50 674 049 706 $ US |
| 2009 | 63 709 559 037 $ US | 47 648 700 297 $ US |
| 2008 | 84 526 756 689 $ US | 45 783 784 537 $ US |
| 2007 | 74 068 549 938 $ US | 32 522 138 070 $ US |
| 2006 | 62 604 628 574 $ US | 24 802 903 073 $ US |
| 2005 | 58 276 695 189 $ US | 24 052 494 566 $ US |
| 2004 | 52 895 820 616 $ US | 21 108 011 868 $ US |
| 2003 | 44 932 193 847 $ US | 16 239 633 129 $ US |
| 2002 | 43 363 108 827 $ US | 14 427 027 970 $ US |
| 2001 | 44 056 142 854 $ US | 12 125 335 043 $ US |
| 2000 | 47 200 194 491 $ US | 11 390 170 996 $ US |
| 1999 | 41 207 853 226 $ US | 11 079 856 776 $ US |
| 1998 | 36 163 743 059 $ US | 10 850 007 516 $ US |
| 1997 | 37 372 736 708 $ US | 10 279 946 208 $ US |
| 1996 | 37 635 231 381 $ US | 11 240 014 124 $ US |
| 1995 | 35 385 120 380 $ US | 12 110 069 749 $ US |
| 1994 | 30 559 356 049 $ US | 11 084 076 997 $ US |
| 1993 | 27 078 766 828 $ US | 11 556 877 008 $ US |
| 1992 | 24 174 277 988 $ US | 11 458 103 093 $ US |
| 1991 | 22 534 110 833 $ US | 10 788 791 994 $ US |
| 1990 | 20 435 071 421 $ US | 15 473 054 068 $ US |
| 1989 | 17 498 729 910 $ US | 15 863 715 871 $ US |
| 1988 | 17 261 772 469 $ US | 13 356 401 461 $ US |
| 1987 | 16 608 825 411 $ US | 12 289 313 328 $ US |
| 1986 | 12 705 184 837 $ US | 14 758 682 284 $ US |
| 1985 | 11 785 377 046 $ US | 15 493 853 614 $ US |
| 1984 | 12 012 629 604 $ US | 14 749 040 620 $ US |
| 1983 | 12 014 412 811 $ US | 12 591 881 327 $ US |
| 1982 | 11 726 255 144 $ US | 13 109 208 304 $ US |
| 1981 | 12 228 947 368 $ US | 13 693 843 725 $ US |
| 1980 | 11 434 705 882 $ US | 12 847 073 135 $ US |
| 1979 | 10 380 400 000 $ US | 10 925 793 281 $ US |
| 1978 | 8 833 529 412 $ US | 10 590 281 903 $ US |
| 1977 | 7 348 000 000 $ US | 8 753 826 797 $ US |
| 1976 | 6 588 750 000 $ US | 6 580 487 773 $ US |
| 1975 | 7 091 666 667 $ US | 6 684 546 140 $ US |
| 1974 | 6 822 500 000 $ US | 4 688 153 800 $ US |
| 1973 | 5 057 500 000 $ US | 2 750 792 039 $ US |
| 1972 | 3 042 500 000 $ US | 1 740 871 306 $ US |
| 1971 | 2 580 000 000 $ US | 1 404 540 636 $ US |
| 1970 | 2 800 000 000 $ US | 1 417 847 869 $ US |
| 1969 | - | 1 195 043 265 $ US |
| 1968 | - | 931 728 600 $ US |
| 1967 | - | 729 178 904 $ US |
| 1966 | - | 749 433 874 $ US |
| 1965 | - | 810 198 782 $ US |
| 1964 | - | 856 495 850 $ US |
| 1963 | - | 995 387 052 $ US |
| 1962 | - | 416 673 668 $ US |
| 1961 | - | 1 643 546 078 $ US |
| 1960 | - | 1 828 734 328 $ US |
En 2025, les importations de biens et services d'Israël s'élevaient à 155 milliards de dollars et celles de l'Algérie à 63,6 milliards de dollars : celles d'Israël étaient 2,4 fois plus élevées. En 1970, les importations d'Israël étaient 2,0 fois plus élevées : 2,8 milliards de dollars pour Israël et 1,42 milliard de dollars pour l'Algérie.
Les importations de biens et services d'Israël sont supérieures à celles de l'Algérie chaque année depuis 1987.
Israël vs Algérie : chiffres des importations
|
Israël
|
Algérie
|
|
|---|---|---|
| Importations | 155 Md $US (2025) | 63,6 Md $US (2025) |
| Rang mondial | 39/174 | 62/174 |
| Part mondiale | 0,46 % | 0,19 % |
| % du PIB | 25,4 % | 22,1 % |
| Première catégorie de biens | Machines, électronique et véhicules (40,1 %, 2025) | Machines, électronique et véhicules (29,9 %, 2024) |
| Première origine des biens | Chine (21,8 %, 2025) | Chine (22,3 %, 2024) |
Comparer les importations de 2 pays au choix
Sources :
- Banque mondiale | Économie et croissance (1960–2025, mis à jour en octobre 2026)
- TradeMap (2003–2025, mis à jour en octobre 2026)
Creative Commons Attribution (CC BY) : vous pouvez copier, partager, adapter et réutiliser ce contenu, y compris à des fins commerciales, à condition de citer statistics.wiki et d’indiquer les modifications apportées. Les sources citées ci-dessus peuvent avoir leurs propres conditions de licence.