
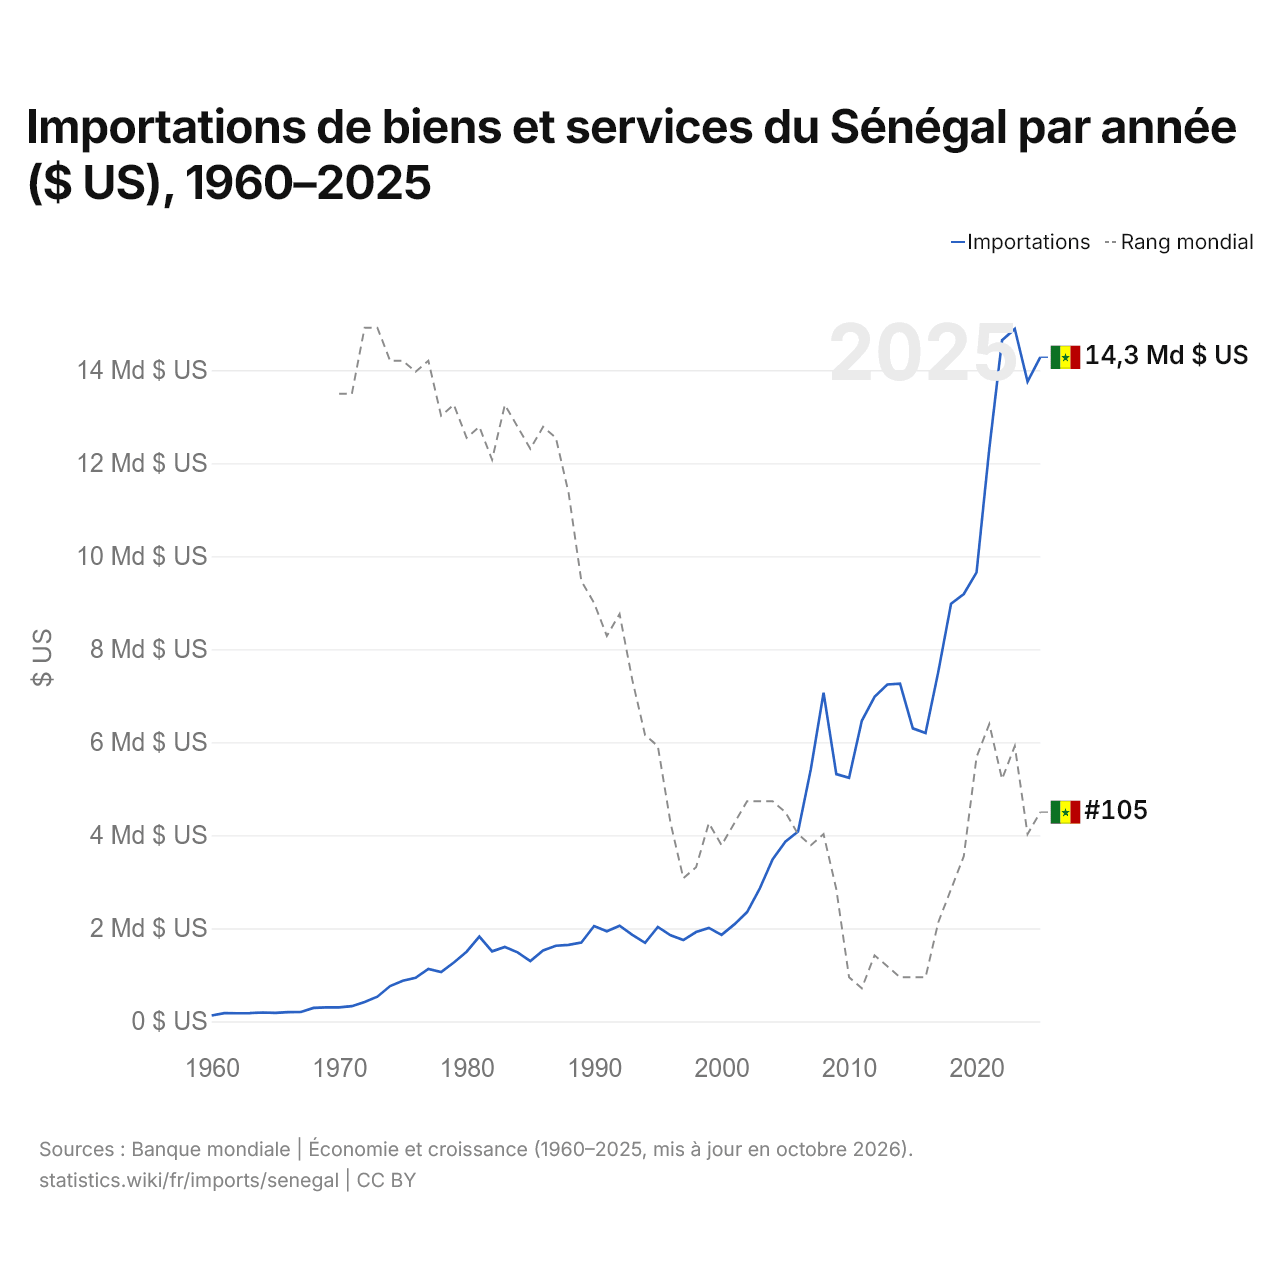
Importations de biens et services du Sénégal par année ($ US), 1960–2025
| Année | $ US | Rang mondial |
|---|---|---|
| Importations | Rang mondial | |
| 2025 | 14 277 431 783 $ US | #105 |
| 2024 | 13 754 025 059 $ US | #107 |
| 2023 | 14 883 981 467 $ US | #99 |
| 2022 | 14 641 332 039 $ US | #102 |
| 2021 | 12 311 805 835 $ US | #97 |
| 2020 | 9 651 853 853 $ US | #100 |
| 2019 | 9 186 797 791 $ US | #109 |
| 2018 | 8 978 699 798 $ US | #112 |
| 2017 | 7 516 719 955 $ US | #115 |
| 2016 | 6 197 109 692 $ US | #120 |
| 2015 | 6 298 158 532 $ US | #120 |
| 2014 | 7 258 510 977 $ US | #120 |
| 2013 | 7 241 502 995 $ US | #119 |
| 2012 | 6 976 207 985 $ US | #118 |
| 2011 | 6 461 833 841 $ US | #121 |
| 2010 | 5 235 657 921 $ US | #120 |
| 2009 | 5 314 157 879 $ US | #112 |
| 2008 | 7 064 428 723 $ US | #107 |
| 2007 | 5 418 129 806 $ US | #108 |
| 2006 | 4 080 719 717 $ US | #107 |
| 2005 | 3 863 797 090 $ US | #105 |
| 2004 | 3 482 299 976 $ US | #104 |
| 2003 | 2 858 883 233 $ US | #104 |
| 2002 | 2 349 065 891 $ US | #104 |
| 2001 | 2 083 798 870 $ US | #106 |
| 2000 | 1 859 032 675 $ US | #108 |
| 1999 | 2 009 562 329 $ US | #106 |
| 1998 | 1 920 046 181 $ US | #110 |
| 1997 | 1 746 494 219 $ US | #111 |
| 1996 | 1 849 069 201 $ US | #106 |
| 1995 | 2 028 765 972 $ US | #99 |
| 1994 | 1 687 427 596 $ US | #98 |
| 1993 | 1 858 224 797 $ US | #93 |
| 1992 | 2 056 499 106 $ US | #87 |
| 1991 | 1 934 759 331 $ US | #89 |
| 1990 | 2 049 748 975 $ US | #86 |
| 1989 | 1 691 678 612 $ US | #84 |
| 1988 | 1 643 548 736 $ US | #76 |
| 1987 | 1 626 029 779 $ US | #71 |
| 1986 | 1 524 007 492 $ US | #70 |
| 1985 | 1 294 595 860 $ US | #72 |
| 1984 | 1 482 612 971 $ US | #70 |
| 1983 | 1 600 297 544 $ US | #68 |
| 1982 | 1 504 650 626 $ US | #73 |
| 1981 | 1 822 808 299 $ US | #70 |
| 1980 | 1 496 960 300 $ US | #71 |
| 1979 | 1 264 686 528 $ US | #68 |
| 1978 | 1 060 183 571 $ US | #69 |
| 1977 | 1 126 395 026 $ US | #64 |
| 1976 | 936 697 270 $ US | #65 |
| 1975 | 872 642 940 $ US | #64 |
| 1974 | 757 849 593 $ US | #64 |
| 1973 | 529 963 308 $ US | #61 |
| 1972 | 417 121 328 $ US | #61 |
| 1971 | 326 227 163 $ US | #67 |
| 1970 | 301 688 941 $ US | #67 |
| 1969 | 301 745 804 $ US | - |
| 1968 | 288 978 829 $ US | - |
| 1967 | 201 513 831 $ US | - |
| 1966 | 198 969 377 $ US | - |
| 1965 | 180 697 023 $ US | - |
| 1964 | 190 639 575 $ US | - |
| 1963 | 177 791 211 $ US | - |
| 1962 | 173 017 580 $ US | - |
| 1961 | 174 678 731 $ US | - |
| 1960 | 126 271 877 $ US | - |
En 2025, les importations de biens et services du Sénégal s'élevaient à 14,3 milliards de dollars, contre 126 millions de dollars en 1960. Le maximum a été de 14,9 milliards de dollars, en 2023. Elles se classaient au 105e rang mondial, en hausse par rapport au 107e rang en 2024. Leur meilleur rang a été le 61e, occupé pour la dernière fois en 1973.
En 2025, les importations de biens et services du Sénégal étaient les 15es plus élevées de 50 pays situés en Afrique (à égalité avec l'Angola). En 2025, les importations du Sénégal dépassaient ses exportations de 2,25 milliards de dollars, soit un déficit commercial. Le commerce du Sénégal, exportations et importations réunies, équivalait à 71,1 % de son PIB en 2025, au 103e rang mondial.
Importations de biens du Sénégal par catégorie, 2025
Importations de biens, 2025: 12,0 Md $US
En 2025, la première catégorie des importations de biens du Sénégal était « pétrole, gaz, minerais et autres matières premières », avec 32,1 %, suivie de « machines, électronique et véhicules », avec 25,2 %.
Origines des importations de biens du Sénégal : les 10 premières, 2025
| Rang | Pays | Importations de biens | Part | |
|---|---|---|---|---|
| 1 |
 Chine |
1,70 Md $US | 14,2 % | |
| 2 |
 France |
1,17 Md $US | 9,75 % | vs France |
| 3 |
 Russie |
851 M $US | 7,1 % | |
| 4 |
 Inde |
725 M $US | 6,05 % | |
| 5 |
 Nigeria |
711 M $US | 5,93 % | |
| 6 |
 EAU |
556 M $US | 4,64 % | |
| 7 |
 Espagne |
543 M $US | 4,53 % | |
| 8 |
 États-Unis |
458 M $US | 3,82 % | |
| 9 |
 Turquie |
302 M $US | 2,52 % | |
| 10 |
 Pays-Bas |
293 M $US | 2,45 % | |
| Autres partenaires et non précisés | 4,67 Md $US | 39 % |
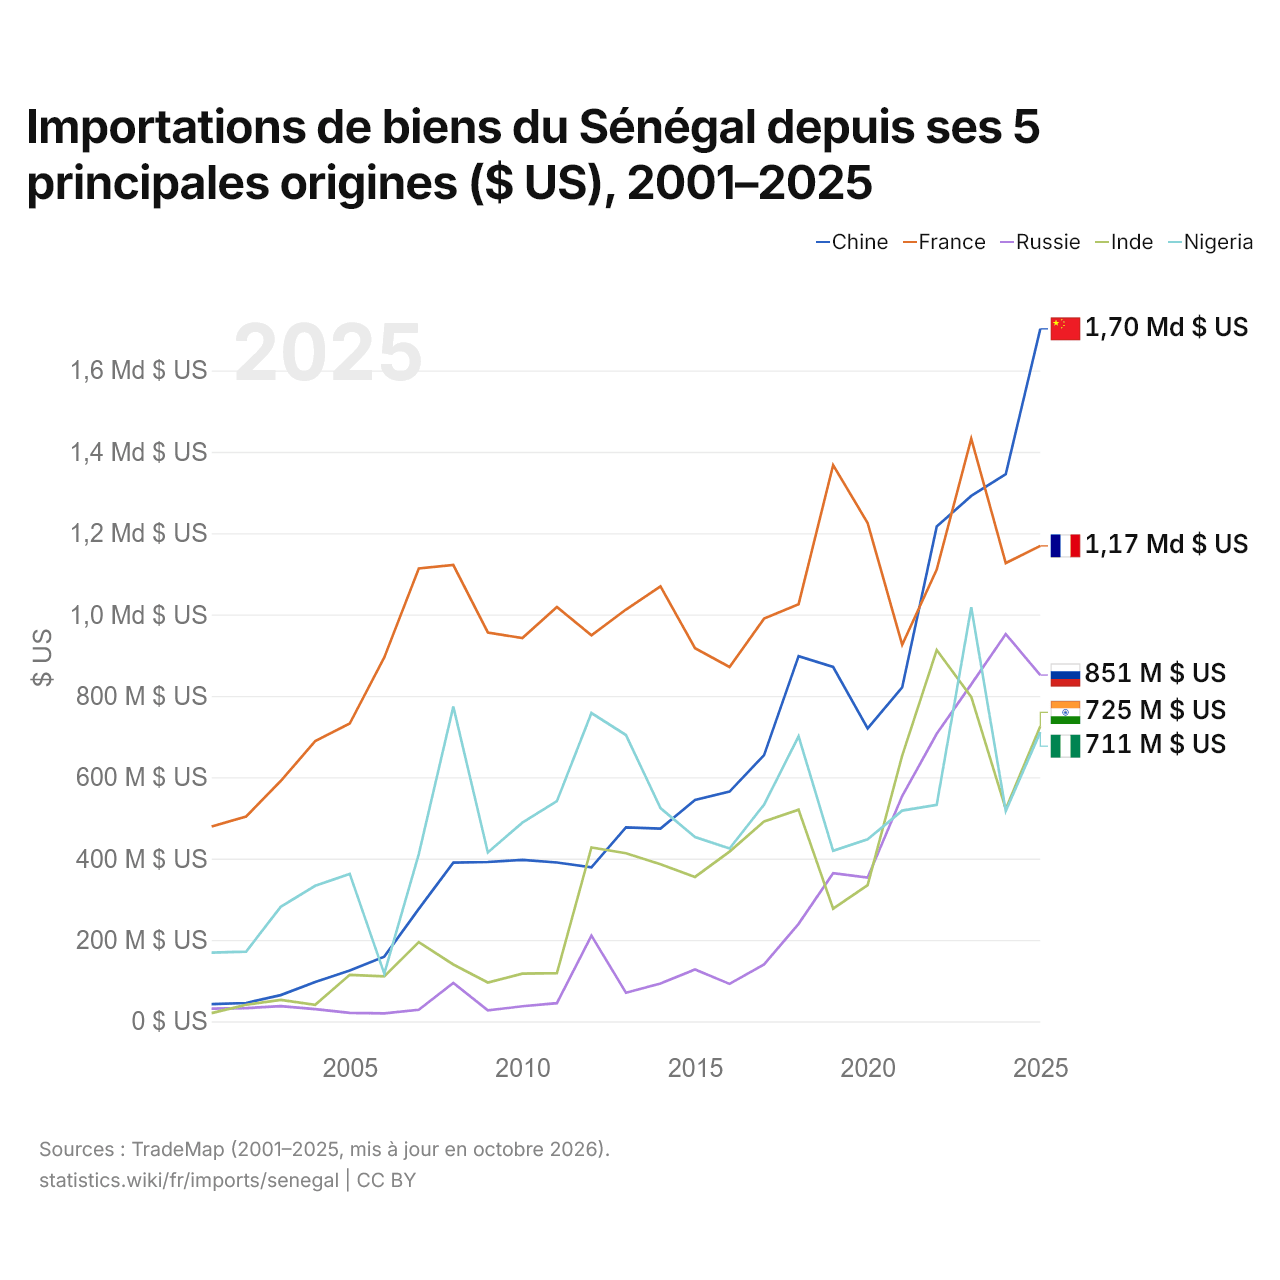
Importations de biens du Sénégal depuis ses 5 principales origines ($ US), 2001–2025
| Année | $ US | ||||
|---|---|---|---|---|---|
| Chine | France | Russie | Inde | Nigeria | |
| 2025 | 1 702 157 000 $ US | 1 168 745 000 $ US | 851 254 000 $ US | 725 178 000 $ US | 710 896 000 $ US |
| 2024 | 1 345 352 000 $ US | 1 126 508 000 $ US | 951 954 000 $ US | 522 138 000 $ US | 516 997 000 $ US |
| 2023 | 1 291 672 000 $ US | 1 432 235 000 $ US | 828 300 000 $ US | 797 657 000 $ US | 1 018 120 000 $ US |
| 2022 | 1 216 181 000 $ US | 1 110 448 000 $ US | 706 777 000 $ US | 912 869 000 $ US | 532 126 000 $ US |
| 2021 | 821 207 000 $ US | 925 811 000 $ US | 553 723 000 $ US | 653 202 000 $ US | 517 980 000 $ US |
| 2020 | 720 159 000 $ US | 1 224 970 000 $ US | 353 601 000 $ US | 334 927 000 $ US | 447 503 000 $ US |
| 2019 | 871 078 000 $ US | 1 367 349 000 $ US | 364 028 000 $ US | 276 971 000 $ US | 419 116 000 $ US |
| 2018 | 897 650 000 $ US | 1 025 519 000 $ US | 239 617 000 $ US | 520 221 000 $ US | 700 593 000 $ US |
| 2017 | 654 482 000 $ US | 989 949 000 $ US | 139 793 000 $ US | 491 078 000 $ US | 532 641 000 $ US |
| 2016 | 564 595 000 $ US | 870 973 000 $ US | 92 076 000 $ US | 417 270 000 $ US | 424 809 000 $ US |
| 2015 | 544 214 000 $ US | 917 069 000 $ US | 127 429 000 $ US | 354 885 000 $ US | 452 837 000 $ US |
| 2014 | 473 851 000 $ US | 1 069 495 000 $ US | 92 893 000 $ US | 386 198 000 $ US | 524 132 000 $ US |
| 2013 | 476 723 000 $ US | 1 012 303 000 $ US | 70 416 000 $ US | 413 083 000 $ US | 703 738 000 $ US |
| 2012 | 378 542 000 $ US | 948 741 000 $ US | 210 614 000 $ US | 427 592 000 $ US | 757 772 000 $ US |
| 2011 | 390 381 000 $ US | 1 018 421 000 $ US | 44 707 000 $ US | 118 628 000 $ US | 541 237 000 $ US |
| 2010 | 397 073 000 $ US | 942 202 000 $ US | 37 001 000 $ US | 117 332 000 $ US | 488 377 000 $ US |
| 2009 | 391 684 000 $ US | 955 870 000 $ US | 26 875 000 $ US | 95 370 000 $ US | 415 066 000 $ US |
| 2008 | 390 247 000 $ US | 1 121 696 000 $ US | 94 623 000 $ US | 139 793 000 $ US | 773 717 000 $ US |
| 2007 | 276 508 000 $ US | 1 113 388 000 $ US | 28 490 000 $ US | 194 633 000 $ US | 411 205 000 $ US |
| 2006 | 158 940 000 $ US | 894 558 000 $ US | 19 744 000 $ US | 110 540 000 $ US | 117 390 000 $ US |
| 2005 | 124 677 000 $ US | 731 992 000 $ US | 20 904 000 $ US | 114 375 000 $ US | 362 373 000 $ US |
| 2004 | 96 889 000 $ US | 688 778 000 $ US | 30 035 000 $ US | 40 443 000 $ US | 333 215 000 $ US |
| 2003 | 64 438 000 $ US | 590 610 000 $ US | 37 207 000 $ US | 52 772 000 $ US | 281 526 000 $ US |
| 2002 | 45 157 000 $ US | 503 562 000 $ US | 32 458 000 $ US | 40 895 000 $ US | 171 304 000 $ US |
| 2001 | 42 151 000 $ US | 478 972 000 $ US | 31 215 000 $ US | 20 096 000 $ US | 168 935 000 $ US |
En 2025, les importations de biens s'élevaient à 1,7 milliard de dollars en provenance de la Chine, 1,17 milliard de dollars en provenance de la France, 851 millions de dollars en provenance de la Russie, 725 millions de dollars en provenance de l'Inde et 711 millions de dollars en provenance du Nigeria. Le premier rang des cinq fournisseurs du Sénégal est occupé par la Chine depuis 2024.
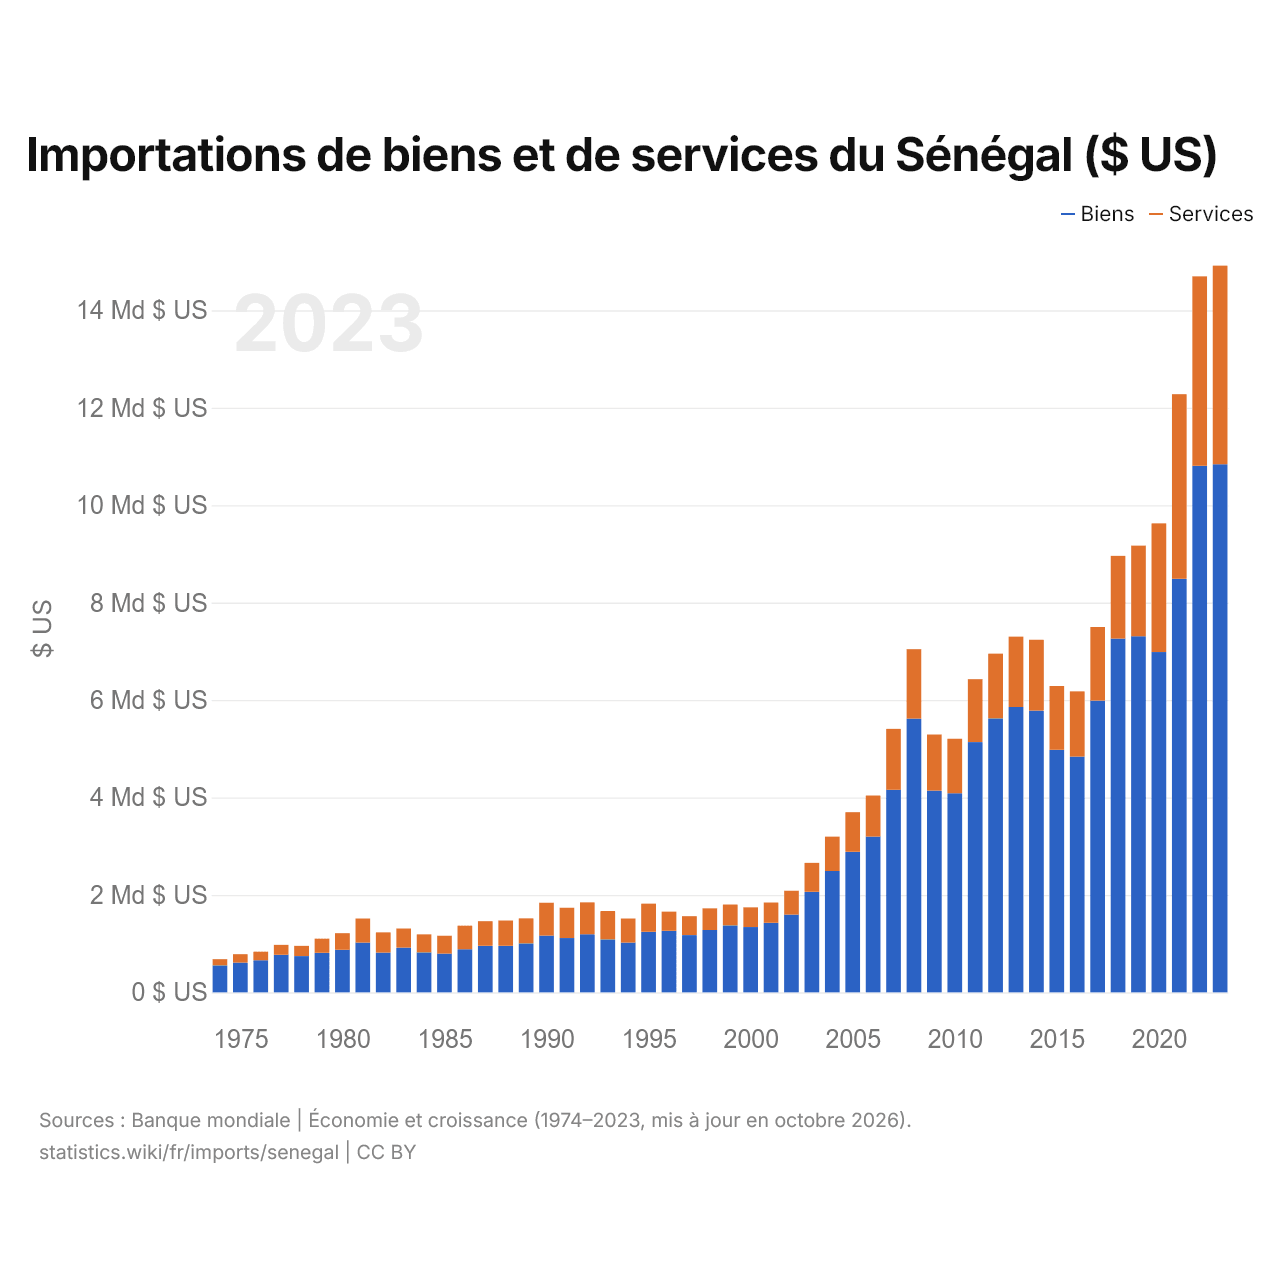
Importations de biens et de services du Sénégal ($ US)
| Année | $ US | |
|---|---|---|
| Biens | Services | |
| 2023 | 10 840 983 209 $ US | 4 075 229 563 $ US |
| 2022 | 10 807 686 369 $ US | 3 889 879 256 $ US |
| 2021 | 8 488 546 156 $ US | 3 789 028 855 $ US |
| 2020 | 6 985 131 793 $ US | 2 641 519 231 $ US |
| 2019 | 7 308 394 815 $ US | 1 861 419 395 $ US |
| 2018 | 7 262 295 292 $ US | 1 697 799 825 $ US |
| 2017 | 5 987 761 328 $ US | 1 511 658 825 $ US |
| 2016 | 4 839 937 434 $ US | 1 339 767 258 $ US |
| 2015 | 4 978 895 901 $ US | 1 309 508 426 $ US |
| 2014 | 5 784 191 803 $ US | 1 453 459 213 $ US |
| 2013 | 5 858 497 254 $ US | 1 442 641 775 $ US |
| 2012 | 5 623 105 588 $ US | 1 328 679 852 $ US |
| 2011 | 5 136 129 567 $ US | 1 292 650 985 $ US |
| 2010 | 4 086 324 669 $ US | 1 119 980 651 $ US |
| 2009 | 4 139 458 269 $ US | 1 153 598 951 $ US |
| 2008 | 5 617 981 541 $ US | 1 424 730 809 $ US |
| 2007 | 4 159 213 869 $ US | 1 248 261 409 $ US |
| 2006 | 3 195 402 217 $ US | 843 354 497 $ US |
| 2005 | 2 885 587 233 $ US | 810 722 087 $ US |
| 2004 | 2 492 374 757 $ US | 703 816 105 $ US |
| 2003 | 2 064 163 326 $ US | 593 104 891 $ US |
| 2002 | 1 596 867 348 $ US | 489 197 823 $ US |
| 2001 | 1 428 153 051 $ US | 414 385 521 $ US |
| 2000 | 1 339 887 795 $ US | 405 527 690 $ US |
| 1999 | 1 373 347 848 $ US | 429 576 683 $ US |
| 1998 | 1 279 036 749 $ US | 444 261 737 $ US |
| 1997 | 1 174 471 426 $ US | 388 786 890 $ US |
| 1996 | 1 263 717 972 $ US | 391 819 075 $ US |
| 1995 | 1 242 876 803 $ US | 578 224 803 $ US |
| 1994 | 1 021 983 431 $ US | 492 719 176 $ US |
| 1993 | 1 086 725 515 $ US | 581 291 498 $ US |
| 1992 | 1 191 763 398 $ US | 654 194 801 $ US |
| 1991 | 1 114 045 740 $ US | 622 636 293 $ US |
| 1990 | 1 164 307 740 $ US | 675 592 321 $ US |
| 1989 | 1 004 080 460 $ US | 514 438 026 $ US |
| 1988 | 955 990 273 $ US | 519 324 912 $ US |
| 1987 | 955 757 255 $ US | 503 832 209 $ US |
| 1986 | 883 265 335 $ US | 484 744 841 $ US |
| 1985 | 795 814 544 $ US | 366 711 734 $ US |
| 1984 | 818 937 043 $ US | 369 990 923 $ US |
| 1983 | 917 242 596 $ US | 391 926 821 $ US |
| 1982 | 815 078 830 $ US | 414 599 536 $ US |
| 1981 | 1 020 272 027 $ US | 494 679 577 $ US |
| 1980 | 875 096 503 $ US | 339 881 442 $ US |
| 1979 | 813 316 391 $ US | 287 934 969 $ US |
| 1978 | 744 230 617 $ US | 210 807 732 $ US |
| 1977 | 772 509 940 $ US | 202 743 665 $ US |
| 1976 | 659 634 543 $ US | 174 596 835 $ US |
| 1975 | 611 535 749 $ US | 170 358 387 $ US |
| 1974 | 552 502 788 $ US | 126 586 660 $ US |
Les importations de biens du Sénégal s'élèvent à 10,8 milliards de dollars (2023) et celles de services à 4,08 milliards de dollars ; les services représentent 27,3 % du total, contre 18,6 % en 1974.
Le Sénégal dans le classement mondial des importations, 2025
| Rang | Pays | Importations | Part mondiale | |
|---|---|---|---|---|
| 102 |
 Népal |
15,3 Md $US | 0,05 % | |
| 103 |
 Liban |
15,3 Md $US (2024) | 0,05 % | |
| 104 |
 Kirghizistan |
14,8 Md $US | 0,04 % | |
| 105 |
 Sénégal |
14,3 Md $US | 0,04 % | |
| 106 |
 Angola |
14,3 Md $US | 0,04 % | |
| 107 |
 Macédoine du Nord |
14,0 Md $US | 0,04 % | |
| 108 |
 Bolivie |
14,0 Md $US (2024) | 0,04 % |
Importations de biens et services du Sénégal, % du PIB, 1960–2025
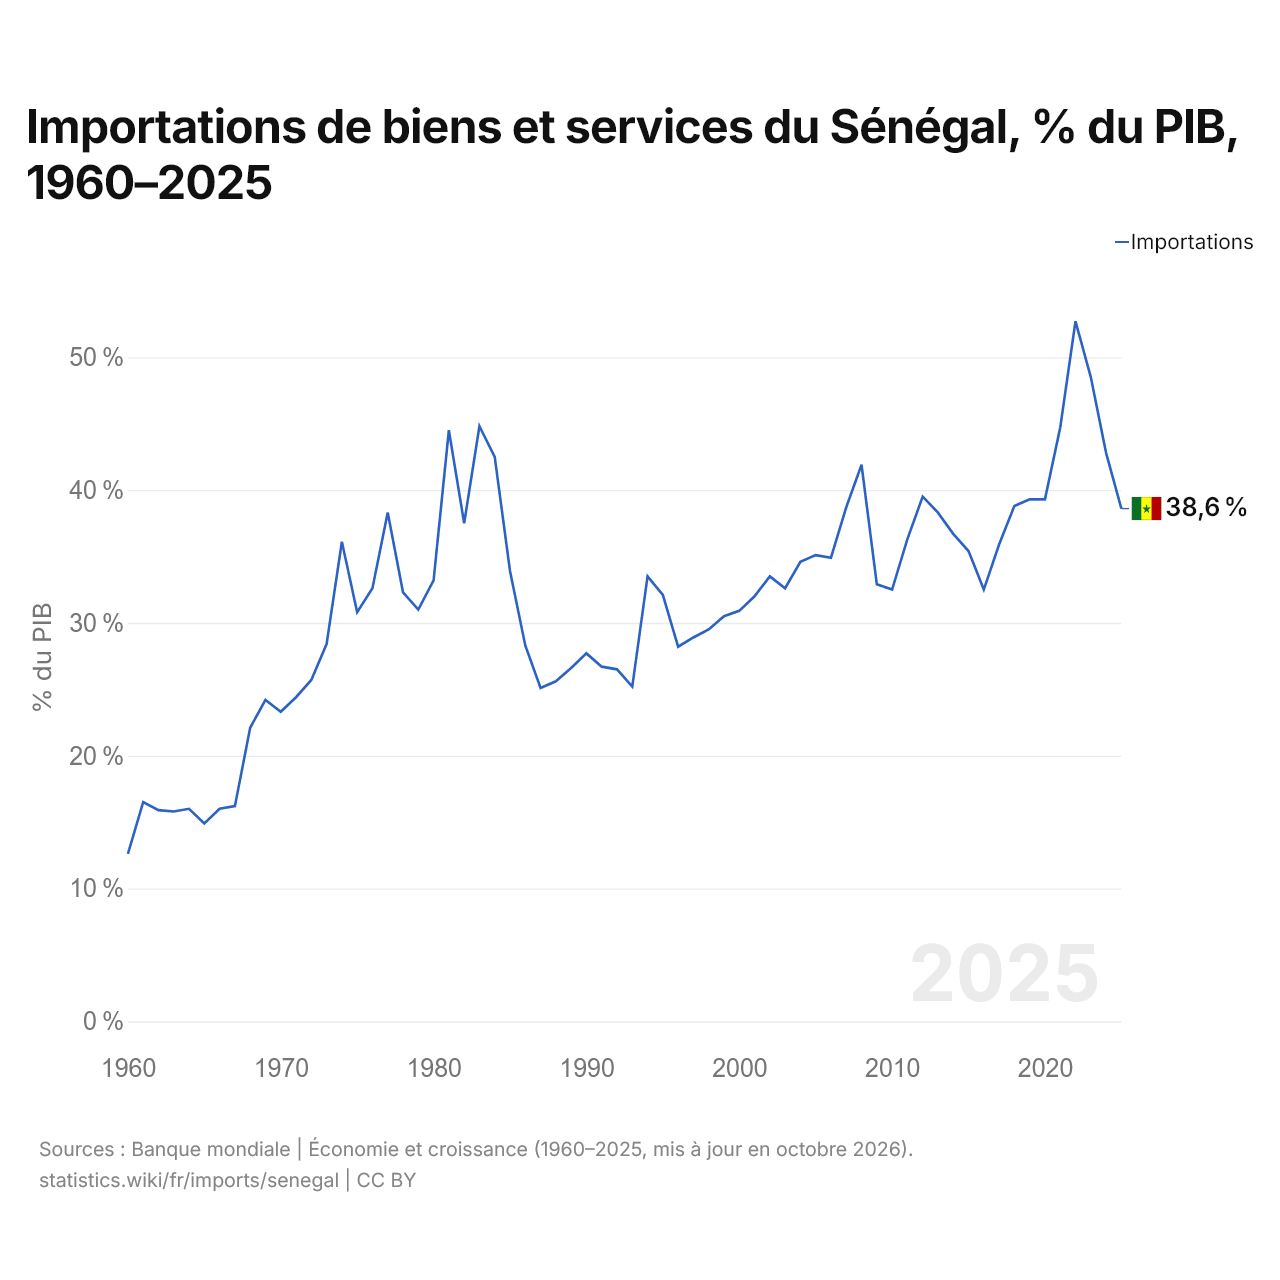
En 2025, les importations de biens et services du Sénégal équivalaient à 38,6 % de son PIB, contre 12,6 % en 1960. La part la plus élevée a été de 52,7 %, en 2022.
Comparer les importations du Sénégal avec celles d'autres pays
Sources :
- Banque mondiale | Économie et croissance (1960–2025, mis à jour en octobre 2026)
- TradeMap (2001–2025, mis à jour en octobre 2026)
Creative Commons Attribution (CC BY) : vous pouvez copier, partager, adapter et réutiliser ce contenu, y compris à des fins commerciales, à condition de citer statistics.wiki et d’indiquer les modifications apportées. Les sources citées ci-dessus peuvent avoir leurs propres conditions de licence.