
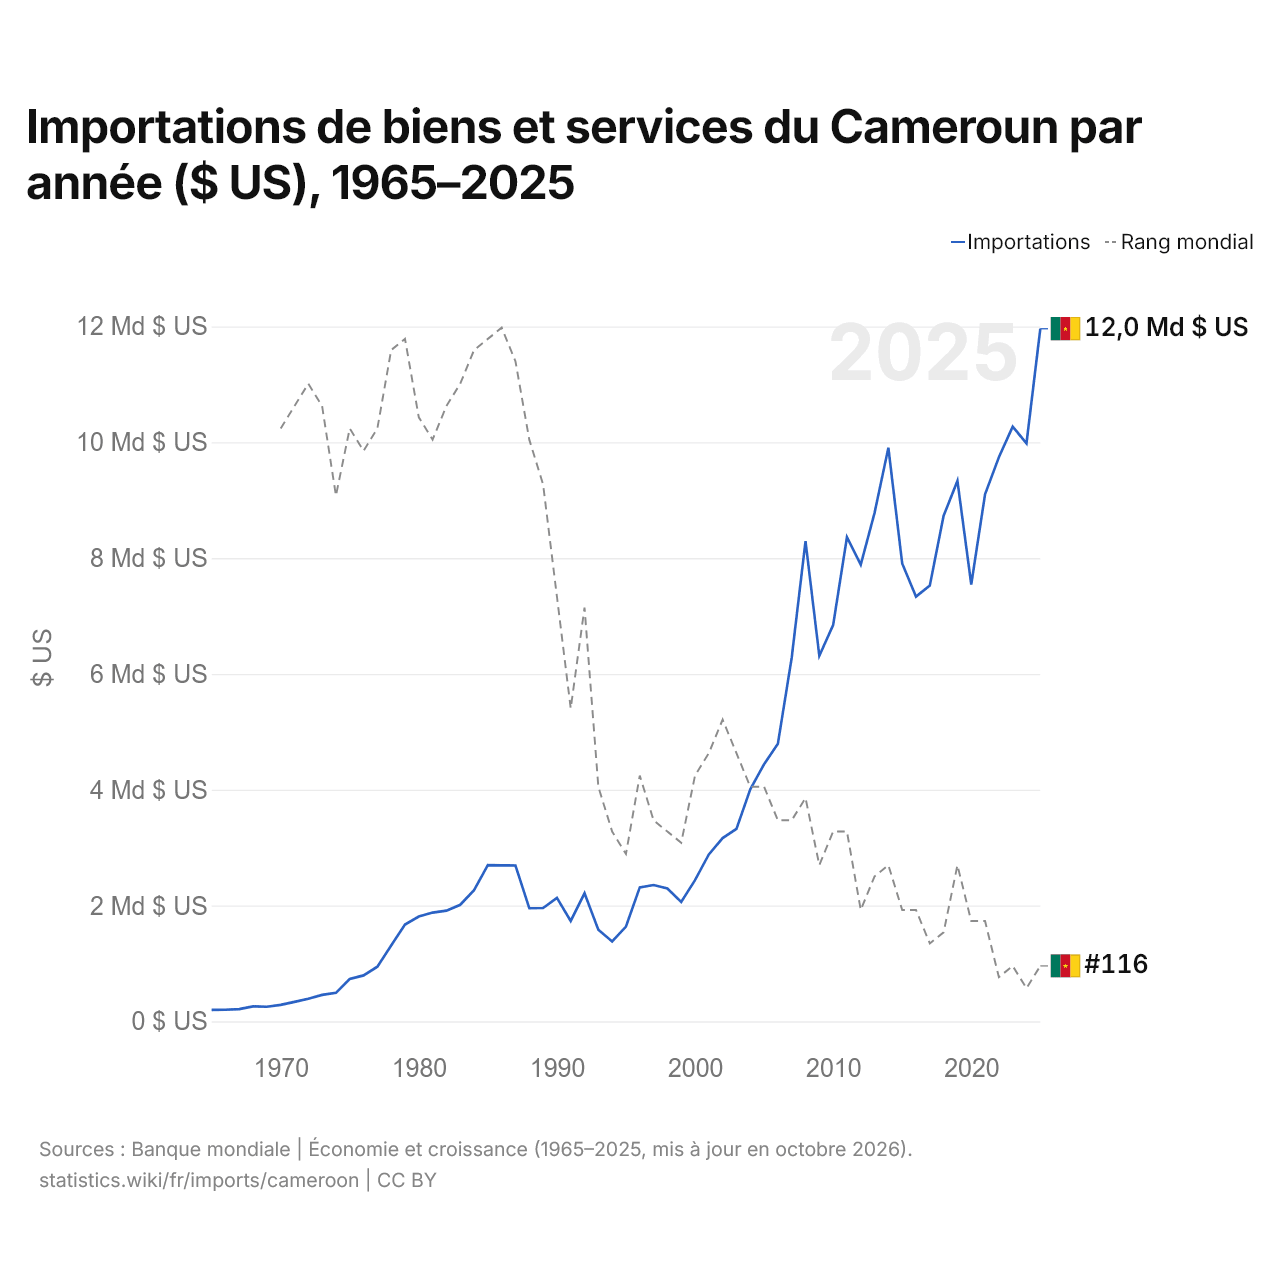
Importations de biens et services du Cameroun par année ($ US), 1965–2025
| Année | $ US | Rang mondial |
|---|---|---|
| Importations | Rang mondial | |
| 2025 | 11 960 615 220 $ US | #116 |
| 2024 | 9 982 430 836 $ US | #118 |
| 2023 | 10 269 387 816 $ US | #116 |
| 2022 | 9 740 770 348 $ US | #117 |
| 2021 | 9 102 291 771 $ US | #112 |
| 2020 | 7 544 311 297 $ US | #112 |
| 2019 | 9 333 197 588 $ US | #107 |
| 2018 | 8 730 827 317 $ US | #113 |
| 2017 | 7 525 797 298 $ US | #114 |
| 2016 | 7 333 874 148 $ US | #111 |
| 2015 | 7 907 933 406 $ US | #111 |
| 2014 | 9 905 295 758 $ US | #107 |
| 2013 | 8 781 390 774 $ US | #108 |
| 2012 | 7 888 349 868 $ US | #111 |
| 2011 | 8 359 880 286 $ US | #104 |
| 2010 | 6 841 031 832 $ US | #104 |
| 2009 | 6 311 089 301 $ US | #107 |
| 2008 | 8 291 276 216 $ US | #101 |
| 2007 | 6 278 066 804 $ US | #103 |
| 2006 | 4 793 806 221 $ US | #103 |
| 2005 | 4 438 925 461 $ US | #100 |
| 2004 | 4 008 132 753 $ US | #100 |
| 2003 | 3 322 828 644 $ US | #97 |
| 2002 | 3 165 848 310 $ US | #94 |
| 2001 | 2 881 977 219 $ US | #97 |
| 2000 | 2 437 829 406 $ US | #99 |
| 1999 | 2 059 848 165 $ US | #105 |
| 1998 | 2 295 271 124 $ US | #104 |
| 1997 | 2 354 149 771 $ US | #103 |
| 1996 | 2 313 348 982 $ US | #99 |
| 1995 | 1 636 645 933 $ US | #106 |
| 1994 | 1 378 107 626 $ US | #104 |
| 1993 | 1 580 660 005 $ US | #100 |
| 1992 | 2 211 014 453 $ US | #84 |
| 1991 | 1 733 392 181 $ US | #93 |
| 1990 | 2 132 071 772 $ US | #83 |
| 1989 | 1 956 872 130 $ US | #73 |
| 1988 | 1 953 074 691 $ US | #69 |
| 1987 | 2 691 627 936 $ US | #62 |
| 1986 | 2 694 449 198 $ US | #59 |
| 1985 | 2 698 093 753 $ US | #60 |
| 1984 | 2 266 220 105 $ US | #61 |
| 1983 | 2 013 215 078 $ US | #64 |
| 1982 | 1 911 383 891 $ US | #66 |
| 1981 | 1 878 440 367 $ US | #69 |
| 1980 | 1 810 903 419 $ US | #67 |
| 1979 | 1 671 668 198 $ US | #60 |
| 1978 | 1 311 288 739 $ US | #61 |
| 1977 | 943 911 999 $ US | #68 |
| 1976 | 793 051 293 $ US | #70 |
| 1975 | 729 774 049 $ US | #68 |
| 1974 | 491 889 090 $ US | #74 |
| 1973 | 456 280 563 $ US | #66 |
| 1972 | 390 830 241 $ US | #64 |
| 1971 | 335 928 207 $ US | #66 |
| 1970 | 284 005 473 $ US | #68 |
| 1969 | 251 576 565 $ US | - |
| 1968 | 257 710 417 $ US | - |
| 1967 | 211 381 300 $ US | - |
| 1966 | 200 668 815 $ US | - |
| 1965 | 197 501 862 $ US | - |
En 2025, les importations de biens et services du Cameroun s'élevaient à 12 milliards de dollars, contre 198 millions de dollars en 1965. Elles se classaient au 116e rang mondial, en hausse par rapport au 118e rang en 2024. Leur meilleur rang a été le 59e, occupé pour la dernière fois en 1986.
En 2025, les importations de biens et services du Cameroun étaient les 20es plus élevées de 50 pays situés en Afrique. En 2025, les importations du Cameroun dépassaient ses exportations de 4,25 milliards de dollars, soit un déficit commercial. Le commerce du Cameroun, exportations et importations réunies, équivalait à 33,4 % de son PIB en 2025, au 165e rang mondial.
Importations de biens du Cameroun par catégorie
Importations de biens, 2024: 8,25 Md $US
La première catégorie des importations de biens du Cameroun est « pétrole, gaz, minerais et autres matières premières », avec 27,3 %, suivie de « machines, électronique et véhicules », avec 22,3 %.
Origines des importations de biens du Cameroun : les 10 premières
| Rang | Pays | Importations de biens | Part | |
|---|---|---|---|---|
| 1 |
 Chine |
1,83 Md $US | 22,2 % | |
| 2 |
 Inde |
583 M $US | 7,07 % | |
| 3 |
 Belgique |
499 M $US | 6,06 % | |
| 4 |
 France |
490 M $US | 5,94 % | vs France |
| 5 |
 États-Unis |
350 M $US | 4,25 % | |
| 6 |
 Brésil |
274 M $US | 3,32 % | |
| 7 |
 Allemagne |
263 M $US | 3,19 % | |
| 8 |
 Nigeria |
247 M $US | 3 % | |
| 9 |
 Thaïlande |
221 M $US | 2,68 % | |
| 10 |
 Turquie |
200 M $US | 2,43 % | |
| Autres partenaires et non précisés | 3,29 Md $US | 39,9 % |
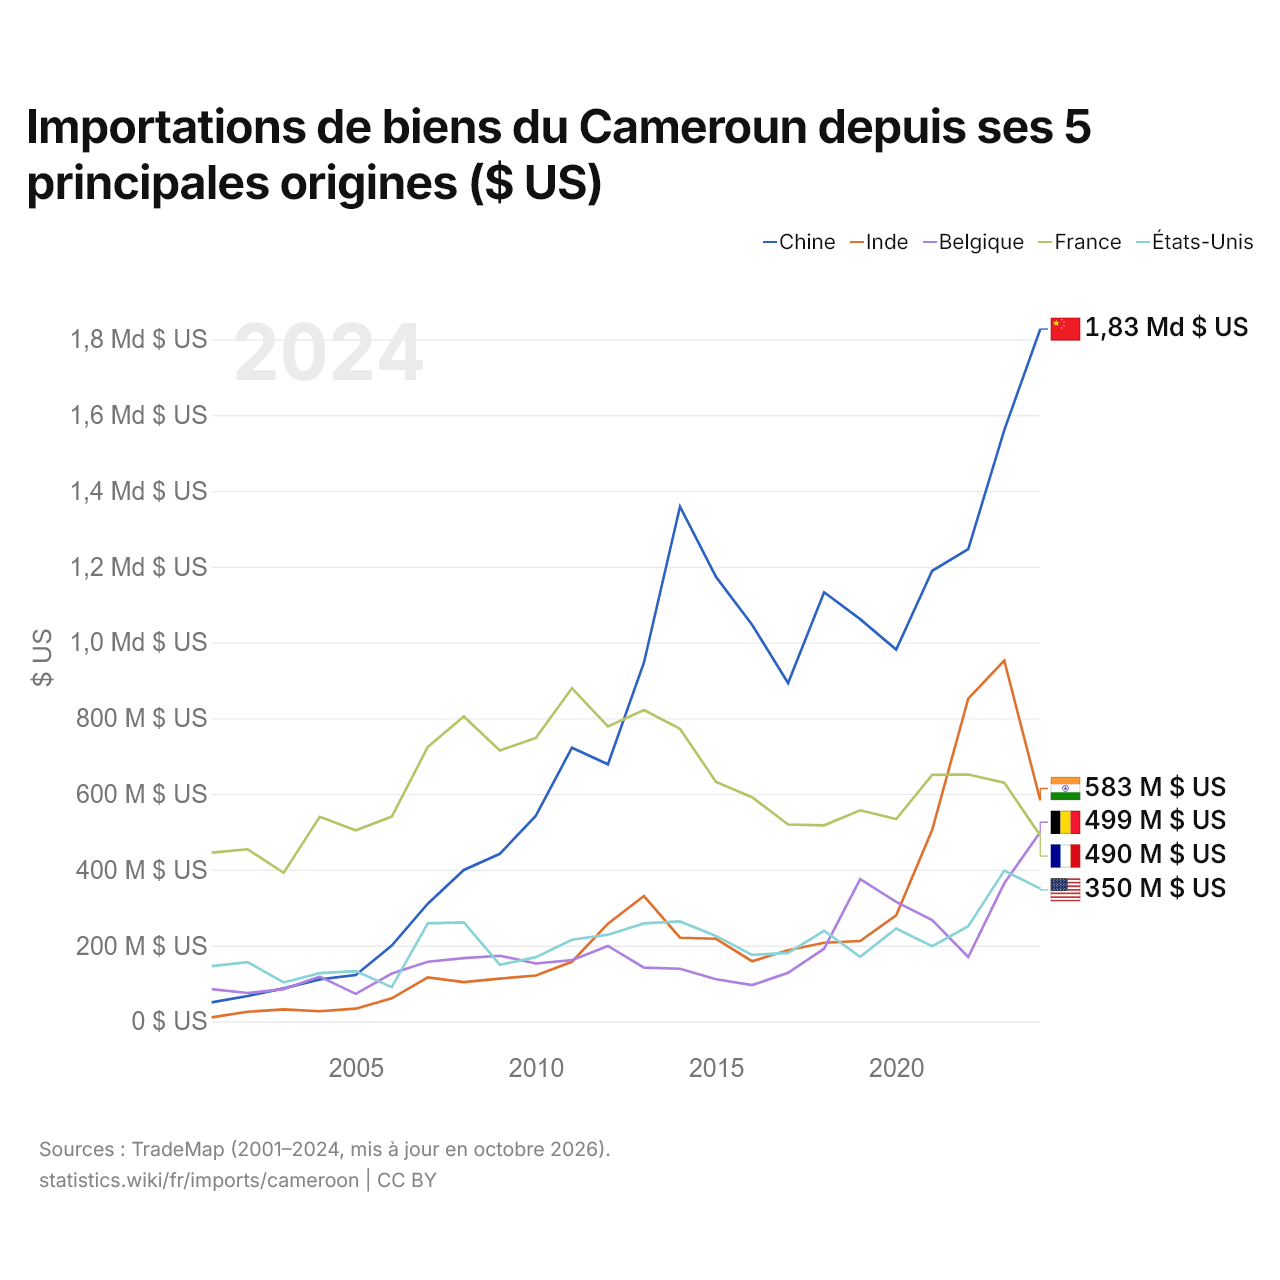
Importations de biens du Cameroun depuis ses 5 principales origines ($ US)
| Année | $ US | ||||
|---|---|---|---|---|---|
| Chine | Inde | Belgique | France | États-Unis | |
| 2024 | 1 827 028 000 $ US | 583 323 000 $ US | 499 498 000 $ US | 490 096 000 $ US | 350 230 000 $ US |
| 2023 | 1 560 267 000 $ US | 952 287 000 $ US | 364 327 000 $ US | 630 074 000 $ US | 397 771 000 $ US |
| 2022 | 1 246 437 000 $ US | 851 675 000 $ US | 169 625 000 $ US | 651 549 000 $ US | 251 177 000 $ US |
| 2021 | 1 189 138 000 $ US | 505 486 000 $ US | 267 022 000 $ US | 650 560 000 $ US | 198 052 000 $ US |
| 2020 | 981 051 000 $ US | 279 585 000 $ US | 315 273 000 $ US | 533 993 000 $ US | 245 074 000 $ US |
| 2019 | 1 061 410 000 $ US | 212 081 000 $ US | 375 488 000 $ US | 556 928 000 $ US | 169 998 000 $ US |
| 2018 | 1 132 495 000 $ US | 207 460 000 $ US | 191 670 000 $ US | 517 387 000 $ US | 238 998 000 $ US |
| 2017 | 892 751 000 $ US | 187 677 000 $ US | 128 005 000 $ US | 519 515 000 $ US | 180 611 000 $ US |
| 2016 | 1 046 767 000 $ US | 158 652 000 $ US | 95 581 000 $ US | 591 579 000 $ US | 175 388 000 $ US |
| 2015 | 1 172 904 000 $ US | 217 884 000 $ US | 110 957 000 $ US | 631 920 000 $ US | 225 461 000 $ US |
| 2014 | 1 358 520 000 $ US | 220 677 000 $ US | 138 707 000 $ US | 771 878 000 $ US | 263 709 000 $ US |
| 2013 | 947 208 000 $ US | 330 764 000 $ US | 141 750 000 $ US | 821 795 000 $ US | 258 403 000 $ US |
| 2012 | 678 286 000 $ US | 257 798 000 $ US | 199 020 000 $ US | 778 301 000 $ US | 228 700 000 $ US |
| 2011 | 722 137 000 $ US | 157 243 000 $ US | 161 472 000 $ US | 879 263 000 $ US | 215 258 000 $ US |
| 2010 | 543 049 000 $ US | 121 037 000 $ US | 152 707 000 $ US | 748 073 000 $ US | 169 417 000 $ US |
| 2009 | 442 046 000 $ US | 112 690 000 $ US | 173 149 000 $ US | 714 767 000 $ US | 149 338 000 $ US |
| 2008 | 399 636 000 $ US | 103 686 000 $ US | 167 023 000 $ US | 804 617 000 $ US | 261 304 000 $ US |
| 2007 | 310 577 000 $ US | 115 975 000 $ US | 157 143 000 $ US | 724 179 000 $ US | 258 614 000 $ US |
| 2006 | 199 822 000 $ US | 60 658 000 $ US | 126 062 000 $ US | 540 330 000 $ US | 90 317 000 $ US |
| 2005 | 122 190 000 $ US | 33 433 000 $ US | 72 540 000 $ US | 504 153 000 $ US | 132 520 000 $ US |
| 2004 | 110 617 000 $ US | 26 572 000 $ US | 118 112 000 $ US | 539 692 000 $ US | 127 150 000 $ US |
| 2003 | 87 083 000 $ US | 31 400 000 $ US | 85 068 000 $ US | 392 002 000 $ US | 102 630 000 $ US |
| 2002 | 66 832 000 $ US | 25 238 000 $ US | 74 815 000 $ US | 454 064 000 $ US | 156 413 000 $ US |
| 2001 | 49 900 000 $ US | 10 445 000 $ US | 84 964 000 $ US | 445 280 000 $ US | 145 650 000 $ US |
Les importations de biens s'élèvent à 1,83 milliard de dollars en provenance de la Chine (2024), 583 millions de dollars en provenance de l'Inde (2024), 499 millions de dollars en provenance de la Belgique (2024), 490 millions de dollars en provenance de la France (2024) et 350 millions de dollars en provenance des États-Unis (2024). Le premier rang des cinq fournisseurs du Cameroun est occupé par la Chine depuis 2013. Le changement le plus récent dans leur ordre remonte à 2024, quand les importations du Cameroun en provenance de la Belgique ont dépassé celles en provenance de la France.
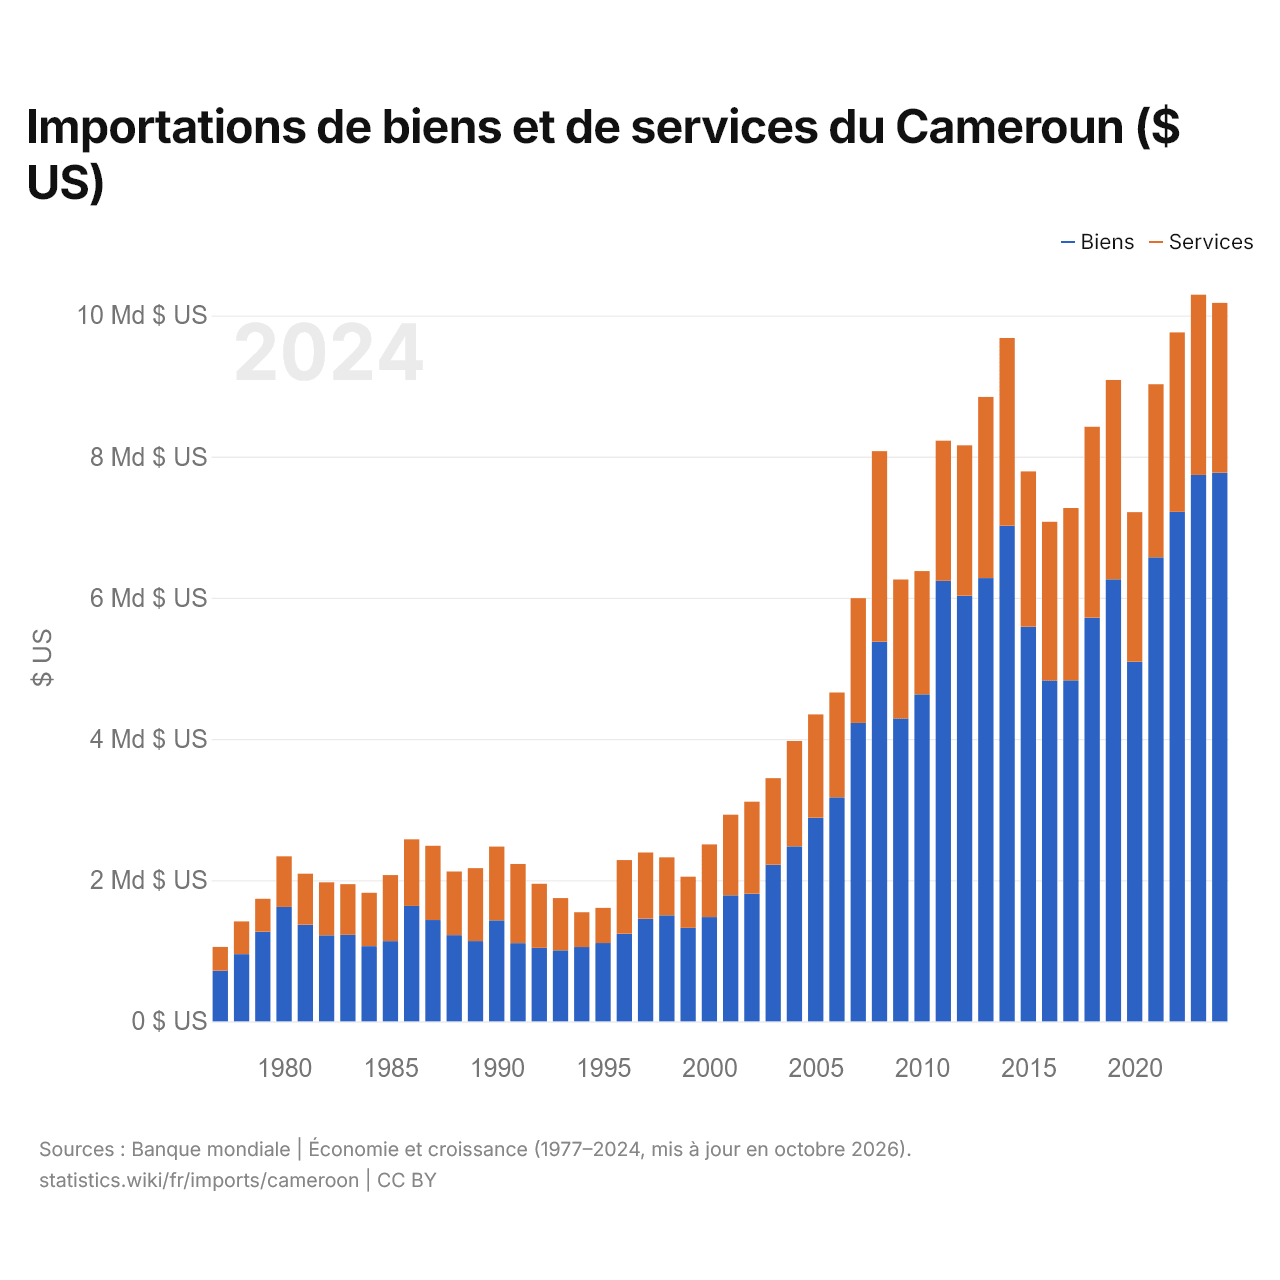
Importations de biens et de services du Cameroun ($ US)
| Année | $ US | |
|---|---|---|
| Biens | Services | |
| 2024 | 7 772 292 118 $ US | 2 404 715 120 $ US |
| 2023 | 7 740 040 642 $ US | 2 553 584 067 $ US |
| 2022 | 7 216 863 411 $ US | 2 542 112 844 $ US |
| 2021 | 6 572 721 822 $ US | 2 452 356 645 $ US |
| 2020 | 5 095 127 571 $ US | 2 117 330 015 $ US |
| 2019 | 6 262 420 717 $ US | 2 822 981 461 $ US |
| 2018 | 5 717 353 463 $ US | 2 705 153 819 $ US |
| 2017 | 4 830 181 010 $ US | 2 441 019 962 $ US |
| 2016 | 4 828 109 823 $ US | 2 248 397 056 $ US |
| 2015 | 5 591 229 015 $ US | 2 198 197 371 $ US |
| 2014 | 7 020 452 741 $ US | 2 659 419 761 $ US |
| 2013 | 6 278 861 279 $ US | 2 566 440 234 $ US |
| 2012 | 6 030 872 145 $ US | 2 128 519 261 $ US |
| 2011 | 6 240 650 560 $ US | 1 984 211 622 $ US |
| 2010 | 4 630 409 394 $ US | 1 747 257 529 $ US |
| 2009 | 4 289 241 354 $ US | 1 969 174 039 $ US |
| 2008 | 5 379 557 796 $ US | 2 696 901 095 $ US |
| 2007 | 4 226 864 765 $ US | 1 766 632 745 $ US |
| 2006 | 3 170 994 915 $ US | 1 486 600 126 $ US |
| 2005 | 2 884 716 693 $ US | 1 463 586 080 $ US |
| 2004 | 2 476 988 042 $ US | 1 494 813 482 $ US |
| 2003 | 2 219 104 521 $ US | 1 225 242 548 $ US |
| 2002 | 1 807 101 194 $ US | 1 304 751 827 $ US |
| 2001 | 1 786 652 268 $ US | 1 140 311 210 $ US |
| 2000 | 1 476 891 325 $ US | 1 029 797 079 $ US |
| 1999 | 1 324 321 193 $ US | 724 611 229 $ US |
| 1998 | 1 502 355 003 $ US | 820 922 524 $ US |
| 1997 | 1 454 213 704 $ US | 938 037 570 $ US |
| 1996 | 1 240 674 391 $ US | 1 043 199 227 $ US |
| 1995 | 1 109 028 840 $ US | 498 649 274 $ US |
| 1994 | 1 052 278 564 $ US | 493 151 449 $ US |
| 1993 | 1 005 323 516 $ US | 741 093 687 $ US |
| 1992 | 1 041 399 844 $ US | 907 319 378 $ US |
| 1991 | 1 107 204 362 $ US | 1 122 305 020 $ US |
| 1990 | 1 430 041 699 $ US | 1 045 122 295 $ US |
| 1989 | 1 136 772 932 $ US | 1 032 418 280 $ US |
| 1988 | 1 220 755 999 $ US | 901 365 135 $ US |
| 1987 | 1 434 767 193 $ US | 1 052 450 981 $ US |
| 1986 | 1 634 479 789 $ US | 944 049 745 $ US |
| 1985 | 1 135 904 898 $ US | 936 155 514 $ US |
| 1984 | 1 064 728 007 $ US | 755 818 656 $ US |
| 1983 | 1 225 220 712 $ US | 717 251 012 $ US |
| 1982 | 1 217 566 607 $ US | 752 055 075 $ US |
| 1981 | 1 368 814 675 $ US | 723 287 636 $ US |
| 1980 | 1 620 270 354 $ US | 716 822 788 $ US |
| 1979 | 1 270 768 665 $ US | 464 738 792 $ US |
| 1978 | 951 493 127 $ US | 464 069 490 $ US |
| 1977 | 719 188 479 $ US | 335 111 141 $ US |
Les importations de biens du Cameroun s'élèvent à 7,77 milliards de dollars (2024) et celles de services à 2,4 milliards de dollars ; les services représentent 23,6 % du total, contre 31,8 % en 1977.
Le Cameroun dans le classement mondial des importations, 2025







Importations de biens et services du Cameroun, % du PIB, 1965–2025
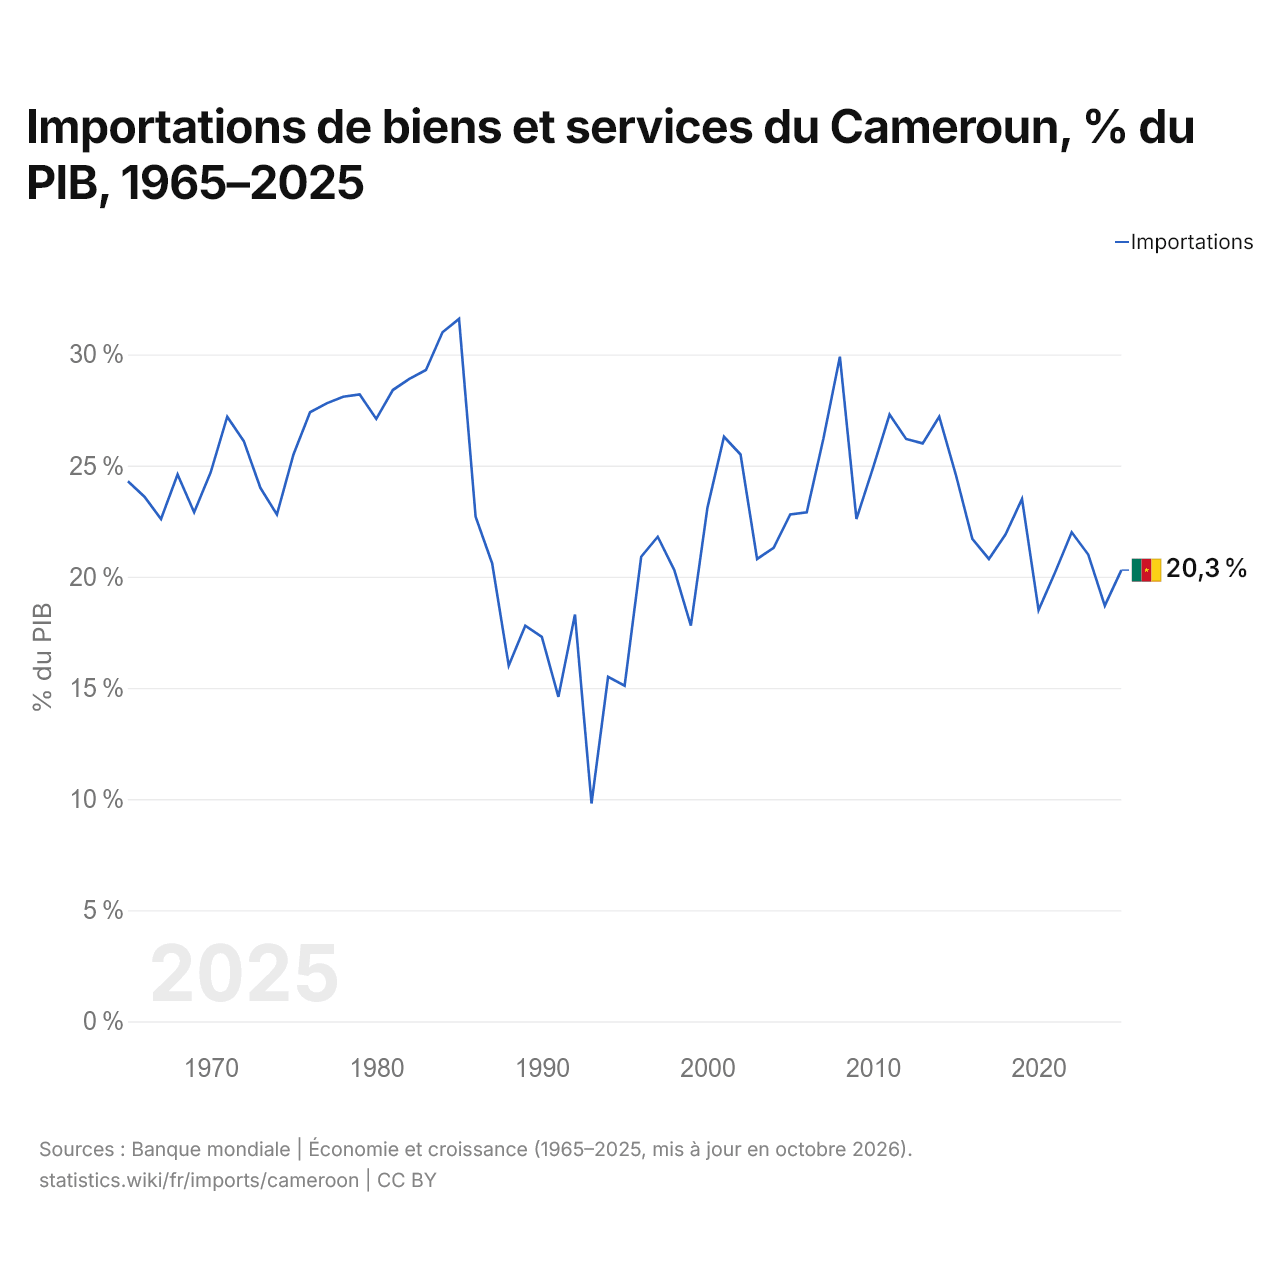
En 2025, les importations de biens et services du Cameroun équivalaient à 20,3 % de son PIB, contre 24,3 % en 1965. La part la plus élevée a été de 31,6 %, en 1985.
Comparer les importations du Cameroun avec celles d'autres pays
Sources :
- Banque mondiale | Économie et croissance (1965–2025, mis à jour en octobre 2026)
- TradeMap (2001–2024, mis à jour en octobre 2026)
Creative Commons Attribution (CC BY) : vous pouvez copier, partager, adapter et réutiliser ce contenu, y compris à des fins commerciales, à condition de citer statistics.wiki et d’indiquer les modifications apportées. Les sources citées ci-dessus peuvent avoir leurs propres conditions de licence.