
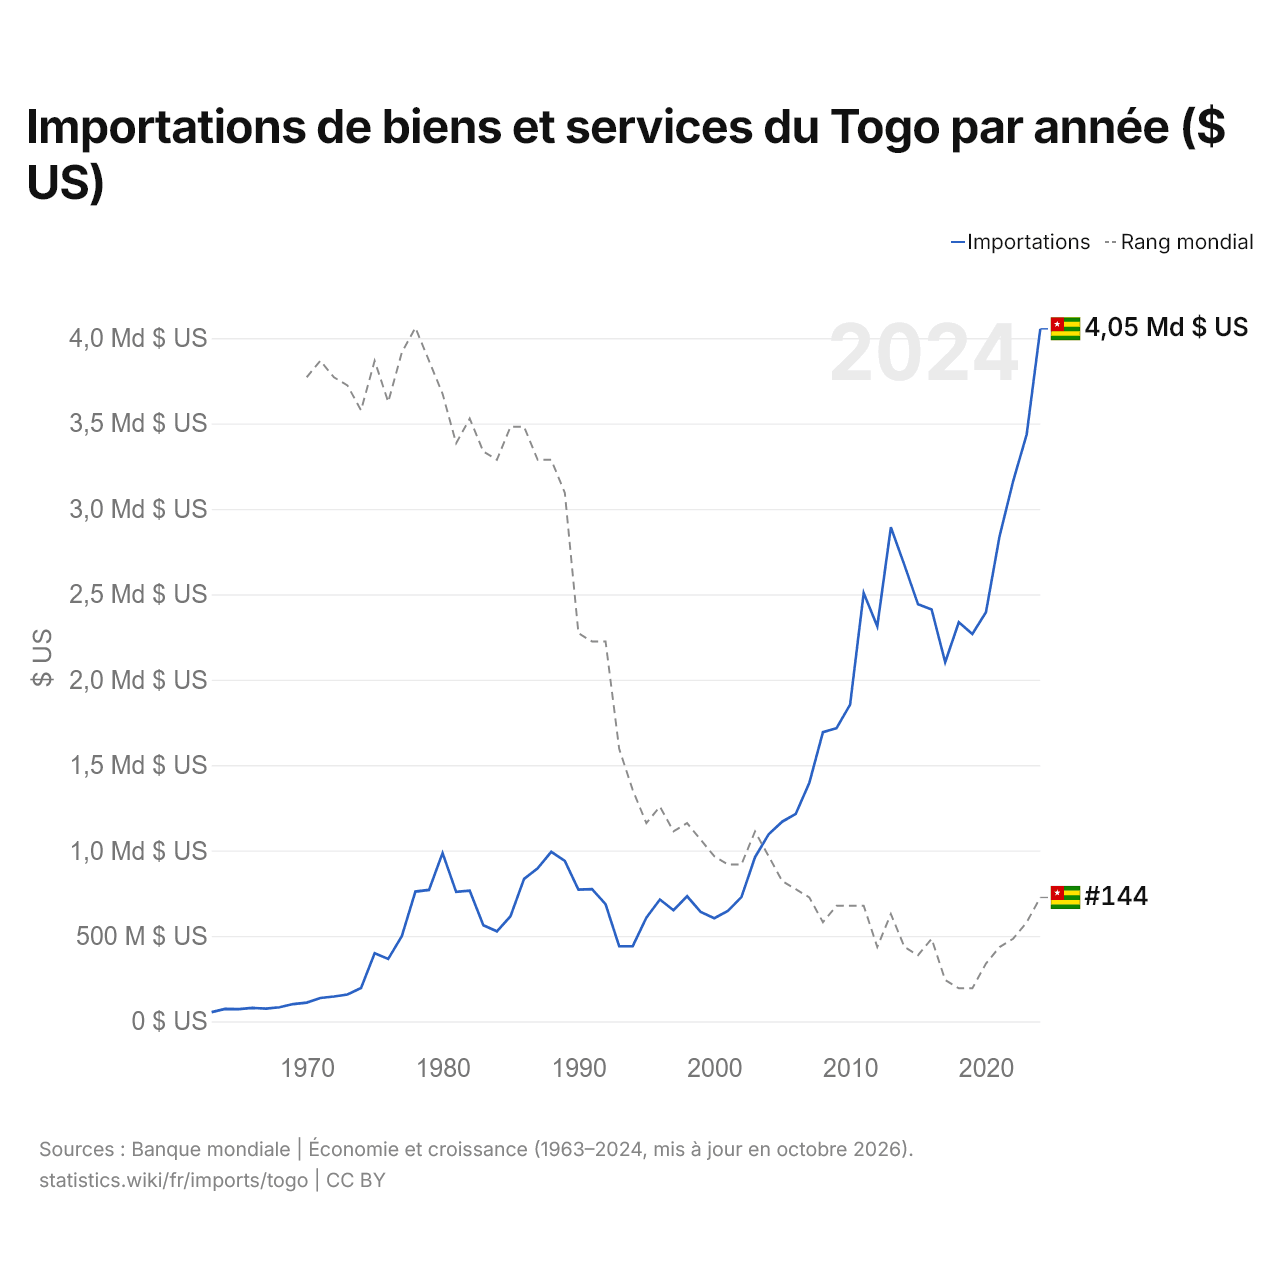
Importations de biens et services du Togo par année ($ US)
| Année | $ US | Rang mondial |
|---|---|---|
| Importations | Rang mondial | |
| 2024 | 4 054 200 385 $ US | #144 |
| 2023 | 3 436 907 297 $ US | #147 |
| 2022 | 3 161 651 830 $ US | #149 |
| 2021 | 2 839 529 121 $ US | #150 |
| 2020 | 2 395 207 646 $ US | #152 |
| 2019 | 2 268 030 418 $ US | #155 |
| 2018 | 2 336 770 685 $ US | #155 |
| 2017 | 2 101 895 827 $ US | #154 |
| 2016 | 2 411 075 703 $ US | #149 |
| 2015 | 2 441 321 789 $ US | #151 |
| 2014 | 2 670 919 336 $ US | #150 |
| 2013 | 2 892 638 363 $ US | #146 |
| 2012 | 2 312 882 854 $ US | #150 |
| 2011 | 2 507 209 432 $ US | #145 |
| 2010 | 1 854 510 188 $ US | #145 |
| 2009 | 1 716 360 384 $ US | #145 |
| 2008 | 1 693 309 261 $ US | #147 |
| 2007 | 1 396 901 169 $ US | #144 |
| 2006 | 1 214 295 355 $ US | #143 |
| 2005 | 1 168 639 790 $ US | #142 |
| 2004 | 1 094 601 313 $ US | #139 |
| 2003 | 960 946 956 $ US | #136 |
| 2002 | 727 191 364 $ US | #140 |
| 2001 | 646 569 240 $ US | #140 |
| 2000 | 603 640 477 $ US | #139 |
| 1999 | 640 566 114 $ US | #137 |
| 1998 | 732 267 660 $ US | #135 |
| 1997 | 650 425 459 $ US | #136 |
| 1996 | 713 174 632 $ US | #133 |
| 1995 | 607 330 077 $ US | #135 |
| 1994 | 440 495 843 $ US | #131 |
| 1993 | 439 633 299 $ US | #126 |
| 1992 | 685 717 468 $ US | #113 |
| 1991 | 773 548 332 $ US | #113 |
| 1990 | 770 924 274 $ US | #112 |
| 1989 | 939 823 755 $ US | #95 |
| 1988 | 992 268 271 $ US | #91 |
| 1987 | 895 615 928 $ US | #91 |
| 1986 | 834 337 849 $ US | #87 |
| 1985 | 615 157 678 $ US | #87 |
| 1984 | 527 122 812 $ US | #91 |
| 1983 | 562 466 530 $ US | #90 |
| 1982 | 764 523 144 $ US | #86 |
| 1981 | 757 473 026 $ US | #89 |
| 1980 | 985 520 656 $ US | #83 |
| 1979 | 769 349 354 $ US | #79 |
| 1978 | 759 576 051 $ US | #75 |
| 1977 | 498 214 852 $ US | #78 |
| 1976 | 365 145 882 $ US | #84 |
| 1975 | 398 858 808 $ US | #79 |
| 1974 | 194 986 227 $ US | #85 |
| 1973 | 156 842 537 $ US | #82 |
| 1972 | 145 568 282 $ US | #81 |
| 1971 | 136 365 018 $ US | #79 |
| 1970 | 109 497 686 $ US | #81 |
| 1969 | 101 041 777 $ US | - |
| 1968 | 82 142 881 $ US | - |
| 1967 | 74 628 175 $ US | - |
| 1966 | 78 749 869 $ US | - |
| 1965 | 71 750 919 $ US | - |
| 1964 | 72 692 943 $ US | - |
| 1963 | 53 698 470 $ US | - |
Les importations de biens et services du Togo s'élèvent à 4,05 milliards de dollars (2024), contre 53,7 millions de dollars en 1963. Elles se classent au 144e rang mondial, en hausse par rapport au 147e rang l'année précédente. Leur meilleur rang a été le 75e, occupé pour la dernière fois en 1978.
Les importations de biens et services du Togo sont les 35es plus élevées de 50 pays situés en Afrique. Les importations du Togo dépassent ses exportations de 1,46 milliard de dollars, soit un déficit commercial (2024). Le commerce du Togo, exportations et importations réunies, équivaut à 62,5 % de son PIB (2024), au 115e rang mondial.
Importations de biens du Togo par catégorie, 2025
Importations de biens, 2025: 3,35 Md $US
En 2025, la première catégorie des importations de biens du Togo était « machines, électronique et véhicules », avec 28,0 %, suivie de « pétrole, gaz, minerais et autres matières premières », avec 14,6 %.
Origines des importations de biens du Togo : les 10 premières, 2025
| Rang | Pays | Importations de biens | Part | |
|---|---|---|---|---|
| 1 |
 Chine |
890 M $US | 26,6 % | |
| 2 |
 France |
259 M $US | 7,72 % | vs France |
| 3 |
 Inde |
190 M $US | 5,67 % | |
| 4 |
 Nigeria |
185 M $US | 5,52 % | |
| 5 |
 Japon |
125 M $US | 3,73 % | |
| 6 |
 Malaisie |
111 M $US | 3,31 % | |
| 7 |
 Turquie |
97,0 M $US | 2,89 % | |
| 8 |
 Maroc |
91,5 M $US | 2,73 % | |
| 9 |
 Pays-Bas |
89,7 M $US | 2,68 % | |
| 10 |
 États-Unis |
88,1 M $US | 2,63 % | |
| Autres partenaires et non précisés | 1,23 Md $US | 36,6 % |
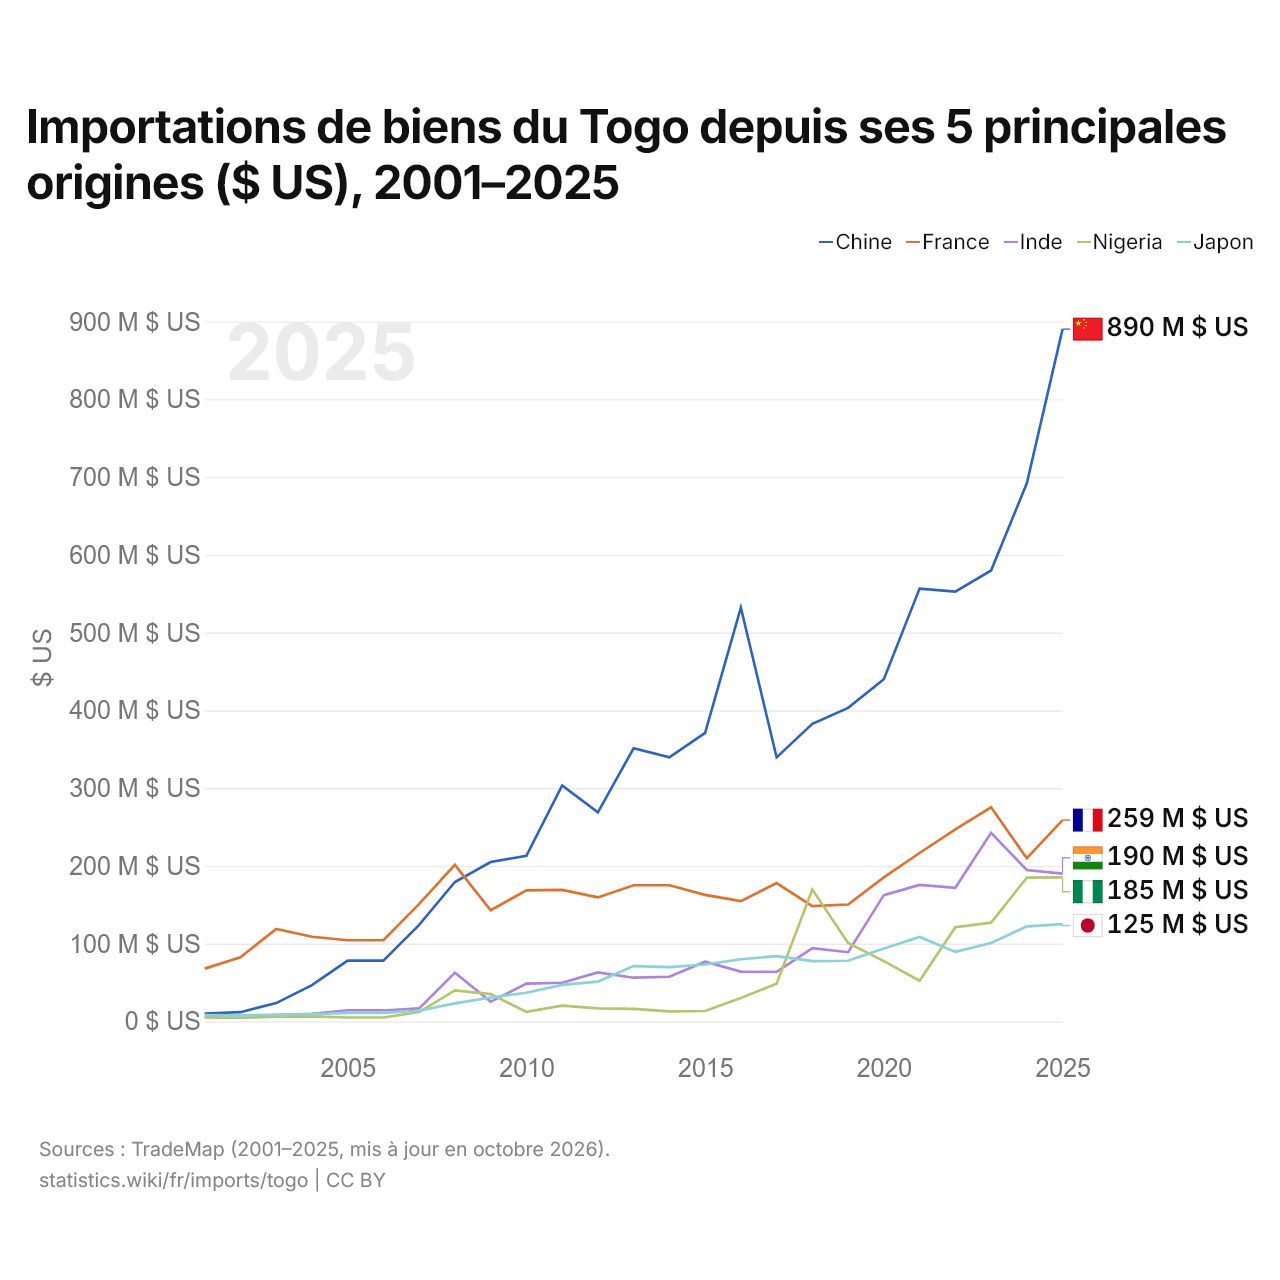
Importations de biens du Togo depuis ses 5 principales origines ($ US), 2001–2025
| Année | $ US | ||||
|---|---|---|---|---|---|
| Chine | France | Inde | Nigeria | Japon | |
| 2025 | 890 250 000 $ US | 258 780 000 $ US | 190 042 000 $ US | 185 039 000 $ US | 125 034 000 $ US |
| 2024 | 691 975 000 $ US | 209 678 000 $ US | 194 589 000 $ US | 184 790 000 $ US | 122 106 000 $ US |
| 2023 | 579 768 000 $ US | 275 216 000 $ US | 242 371 000 $ US | 126 950 000 $ US | 100 740 000 $ US |
| 2022 | 552 708 000 $ US | 247 006 000 $ US | 171 682 000 $ US | 121 004 000 $ US | 89 295 000 $ US |
| 2021 | 556 516 000 $ US | 216 495 000 $ US | 175 443 000 $ US | 52 243 000 $ US | 108 550 000 $ US |
| 2020 | 439 917 000 $ US | 185 154 000 $ US | 162 343 000 $ US | 77 430 000 $ US | 93 665 000 $ US |
| 2019 | 403 066 000 $ US | 150 214 000 $ US | 88 899 000 $ US | 100 882 000 $ US | 77 945 000 $ US |
| 2018 | 382 572 000 $ US | 148 254 000 $ US | 94 174 000 $ US | 169 531 000 $ US | 77 411 000 $ US |
| 2017 | 339 474 000 $ US | 177 790 000 $ US | 63 585 000 $ US | 48 489 000 $ US | 83 766 000 $ US |
| 2016 | 531 993 000 $ US | 154 641 000 $ US | 63 903 000 $ US | 30 106 000 $ US | 79 861 000 $ US |
| 2015 | 370 969 000 $ US | 162 628 000 $ US | 76 627 000 $ US | 13 262 000 $ US | 73 051 000 $ US |
| 2014 | 339 602 000 $ US | 175 056 000 $ US | 57 284 000 $ US | 12 757 000 $ US | 69 679 000 $ US |
| 2013 | 351 237 000 $ US | 174 985 000 $ US | 56 113 000 $ US | 16 088 000 $ US | 71 005 000 $ US |
| 2012 | 268 699 000 $ US | 159 351 000 $ US | 62 959 000 $ US | 16 714 000 $ US | 51 107 000 $ US |
| 2011 | 303 439 000 $ US | 169 122 000 $ US | 49 592 000 $ US | 20 264 000 $ US | 46 940 000 $ US |
| 2010 | 212 892 000 $ US | 168 341 000 $ US | 48 463 000 $ US | 12 153 000 $ US | 36 729 000 $ US |
| 2009 | 204 874 000 $ US | 142 892 000 $ US | 25 307 000 $ US | 35 015 000 $ US | 30 679 000 $ US |
| 2008 | 179 237 000 $ US | 201 228 000 $ US | 62 442 000 $ US | 39 768 000 $ US | 23 020 000 $ US |
| 2007 | 124 028 000 $ US | 151 064 000 $ US | 16 626 000 $ US | 11 951 000 $ US | 13 666 000 $ US |
| 2006 | 78 012 000 $ US | 104 279 000 $ US | 13 988 000 $ US | 4 922 000 $ US | 10 820 000 $ US |
| 2005 | 78 012 000 $ US | 104 279 000 $ US | 13 988 000 $ US | 4 922 000 $ US | 10 820 000 $ US |
| 2004 | 46 506 000 $ US | 108 739 000 $ US | 9 776 000 $ US | 6 300 000 $ US | 9 081 000 $ US |
| 2003 | 23 445 000 $ US | 118 736 000 $ US | 8 198 000 $ US | 5 952 000 $ US | 8 242 000 $ US |
| 2002 | 11 754 000 $ US | 82 493 000 $ US | 4 787 000 $ US | 4 561 000 $ US | 7 770 000 $ US |
| 2001 | 10 087 000 $ US | 67 777 000 $ US | 5 395 000 $ US | 5 065 000 $ US | 8 138 000 $ US |
En 2025, les importations de biens s'élevaient à 890 millions de dollars en provenance de la Chine, 259 millions de dollars en provenance de la France, 190 millions de dollars en provenance de l'Inde, 185 millions de dollars en provenance du Nigeria et 125 millions de dollars en provenance du Japon. Le premier rang des cinq fournisseurs du Togo est occupé par la Chine depuis 2009. Le changement le plus récent dans leur ordre remonte à 2022, quand les importations du Togo en provenance du Nigeria ont dépassé celles en provenance du Japon.
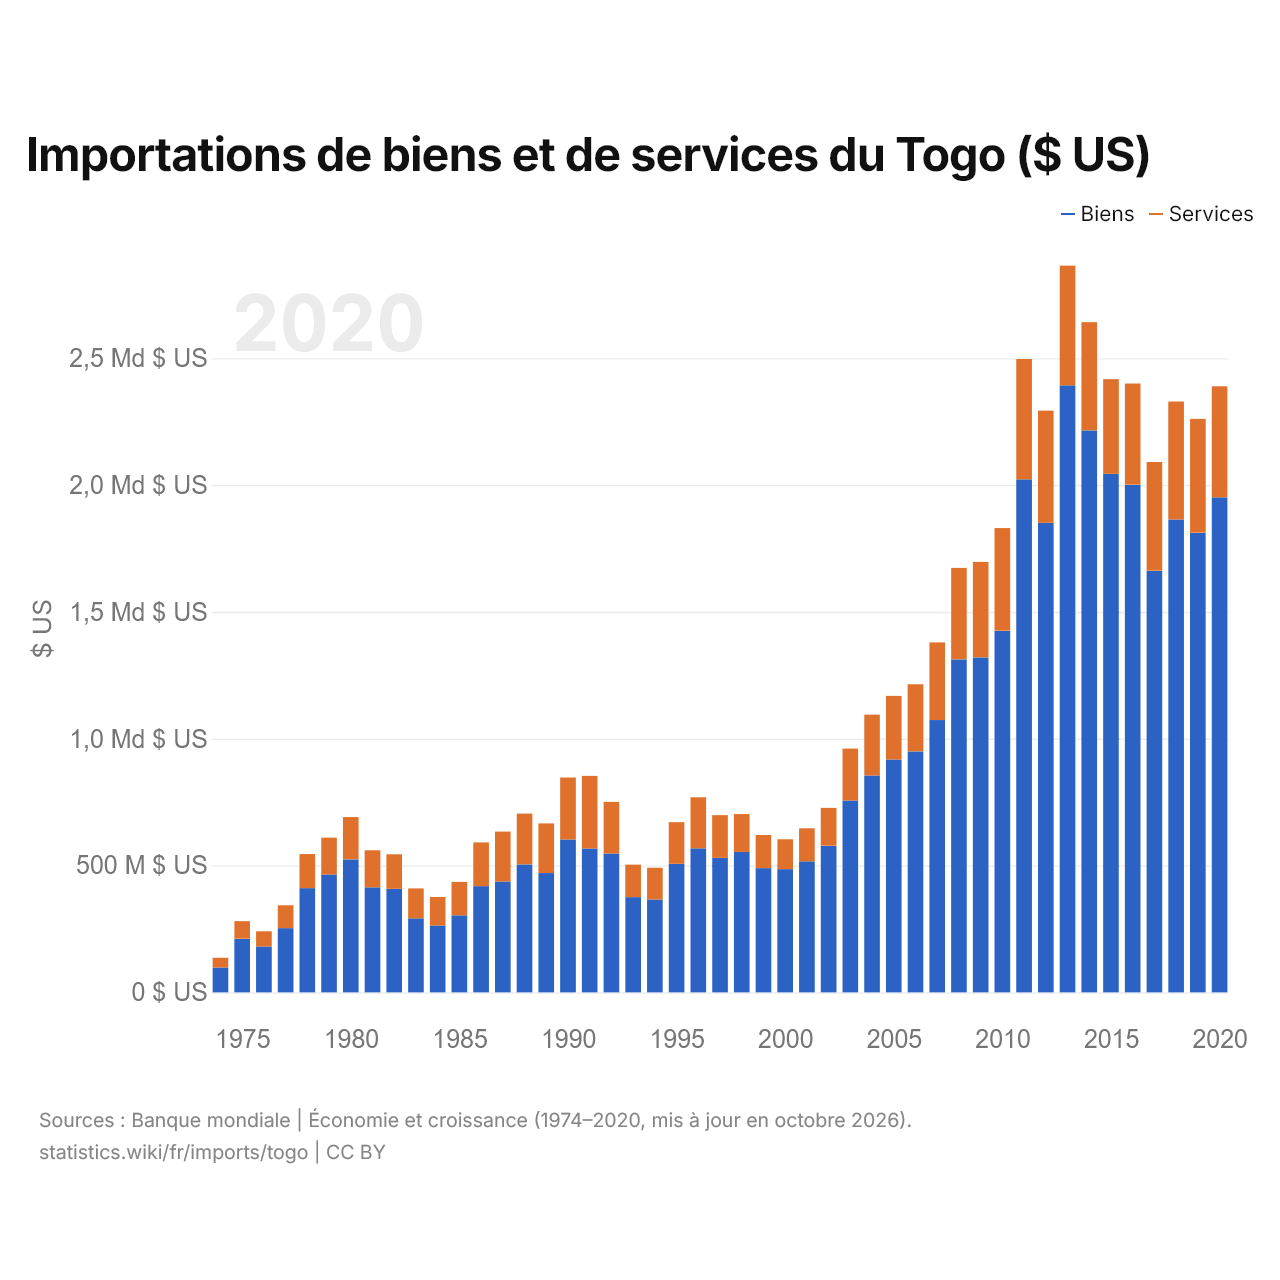
Importations de biens et de services du Togo ($ US)
| Année | $ US | |
|---|---|---|
| Biens | Services | |
| 2020 | 1 951 337 518 $ US | 437 851 967 $ US |
| 2019 | 1 811 991 883 $ US | 448 750 739 $ US |
| 2018 | 1 863 487 912 $ US | 465 434 343 $ US |
| 2017 | 1 662 373 053 $ US | 428 215 810 $ US |
| 2016 | 2 001 177 777 $ US | 398 956 298 $ US |
| 2015 | 2 044 085 022 $ US | 373 017 299 $ US |
| 2014 | 2 215 378 829 $ US | 426 590 194 $ US |
| 2013 | 2 393 130 704 $ US | 471 478 123 $ US |
| 2012 | 1 851 212 313 $ US | 441 997 921 $ US |
| 2011 | 2 022 459 224 $ US | 474 157 499 $ US |
| 2010 | 1 425 779 756 $ US | 404 359 984 $ US |
| 2009 | 1 320 457 990 $ US | 376 225 908 $ US |
| 2008 | 1 312 540 697 $ US | 360 627 769 $ US |
| 2007 | 1 073 394 414 $ US | 305 860 190 $ US |
| 2006 | 949 909 813 $ US | 264 384 045 $ US |
| 2005 | 917 788 762 $ US | 250 803 514 $ US |
| 2004 | 854 768 616 $ US | 239 760 822 $ US |
| 2003 | 756 140 511 $ US | 204 770 697 $ US |
| 2002 | 578 262 911 $ US | 148 882 847 $ US |
| 2001 | 516 515 827 $ US | 130 015 429 $ US |
| 2000 | 485 660 555 $ US | 117 954 181 $ US |
| 1999 | 489 598 778 $ US | 130 639 288 $ US |
| 1998 | 553 445 238 $ US | 149 268 133 $ US |
| 1997 | 530 521 241 $ US | 167 884 430 $ US |
| 1996 | 567 771 714 $ US | 201 404 575 $ US |
| 1995 | 506 462 581 $ US | 164 255 752 $ US |
| 1994 | 365 515 641 $ US | 125 332 153 $ US |
| 1993 | 375 289 702 $ US | 128 230 220 $ US |
| 1992 | 547 444 234 $ US | 203 255 257 $ US |
| 1991 | 567 004 901 $ US | 286 253 181 $ US |
| 1990 | 602 725 755 $ US | 244 096 934 $ US |
| 1989 | 470 125 700 $ US | 195 822 491 $ US |
| 1988 | 504 461 637 $ US | 200 179 139 $ US |
| 1987 | 437 131 506 $ US | 196 575 084 $ US |
| 1986 | 418 563 468 $ US | 172 289 873 $ US |
| 1985 | 303 748 609 $ US | 131 822 574 $ US |
| 1984 | 263 202 301 $ US | 112 608 421 $ US |
| 1983 | 291 776 200 $ US | 117 727 627 $ US |
| 1982 | 408 154 132 $ US | 136 026 018 $ US |
| 1981 | 413 938 096 $ US | 145 960 284 $ US |
| 1980 | 524 120 755 $ US | 166 769 567 $ US |
| 1979 | 464 315 704 $ US | 145 391 881 $ US |
| 1978 | 410 891 168 $ US | 134 164 475 $ US |
| 1977 | 252 739 658 $ US | 90 284 225 $ US |
| 1976 | 180 627 373 $ US | 60 012 431 $ US |
| 1975 | 211 513 166 $ US | 69 109 232 $ US |
| 1974 | 98 037 152 $ US | 38 229 421 $ US |
Les importations de biens du Togo s'élèvent à 1,95 milliard de dollars (2020) et celles de services à 438 millions de dollars ; les services représentent 18,3 % du total, contre 28,1 % en 1974.
Le Togo dans le classement mondial des importations







Importations de biens et services du Togo, % du PIB
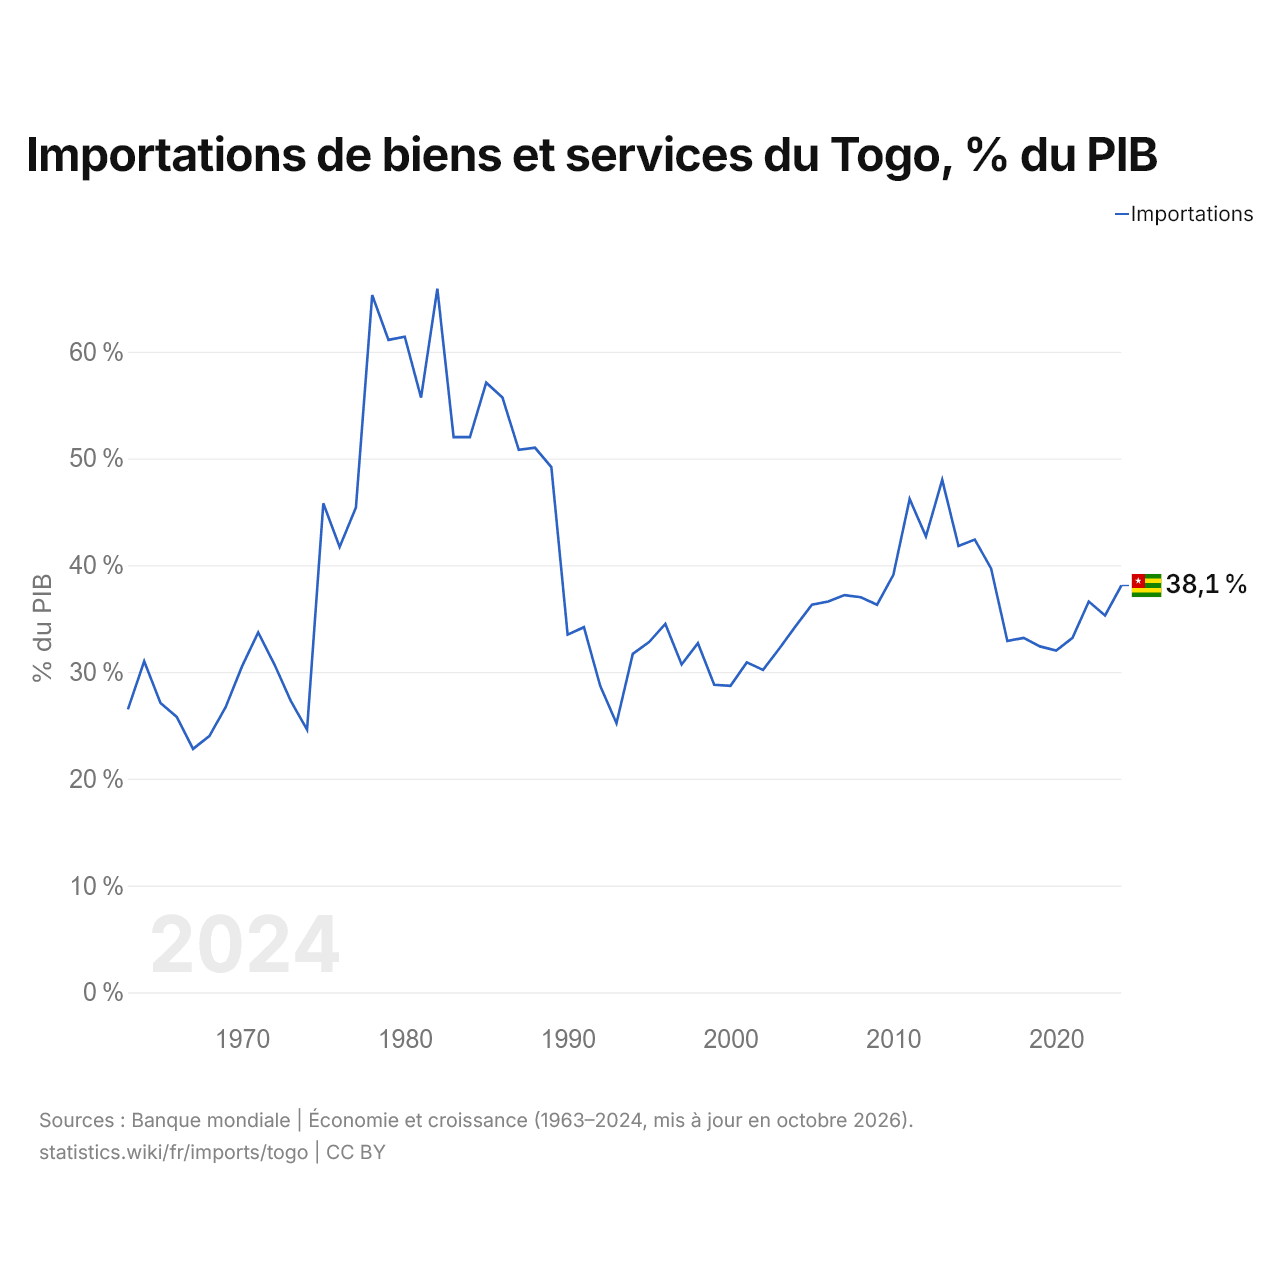
Les importations de biens et services du Togo équivalent à 38,1 % de son PIB (2024), contre 26,5 % en 1963. La part la plus élevée a été de 65,9 %, en 1982.
Comparer les importations du Togo avec celles d'autres pays
Sources :
- Banque mondiale | Économie et croissance (1963–2025, mis à jour en octobre 2026)
- TradeMap (2001–2025, mis à jour en octobre 2026)
Creative Commons Attribution (CC BY) : vous pouvez copier, partager, adapter et réutiliser ce contenu, y compris à des fins commerciales, à condition de citer statistics.wiki et d’indiquer les modifications apportées. Les sources citées ci-dessus peuvent avoir leurs propres conditions de licence.