
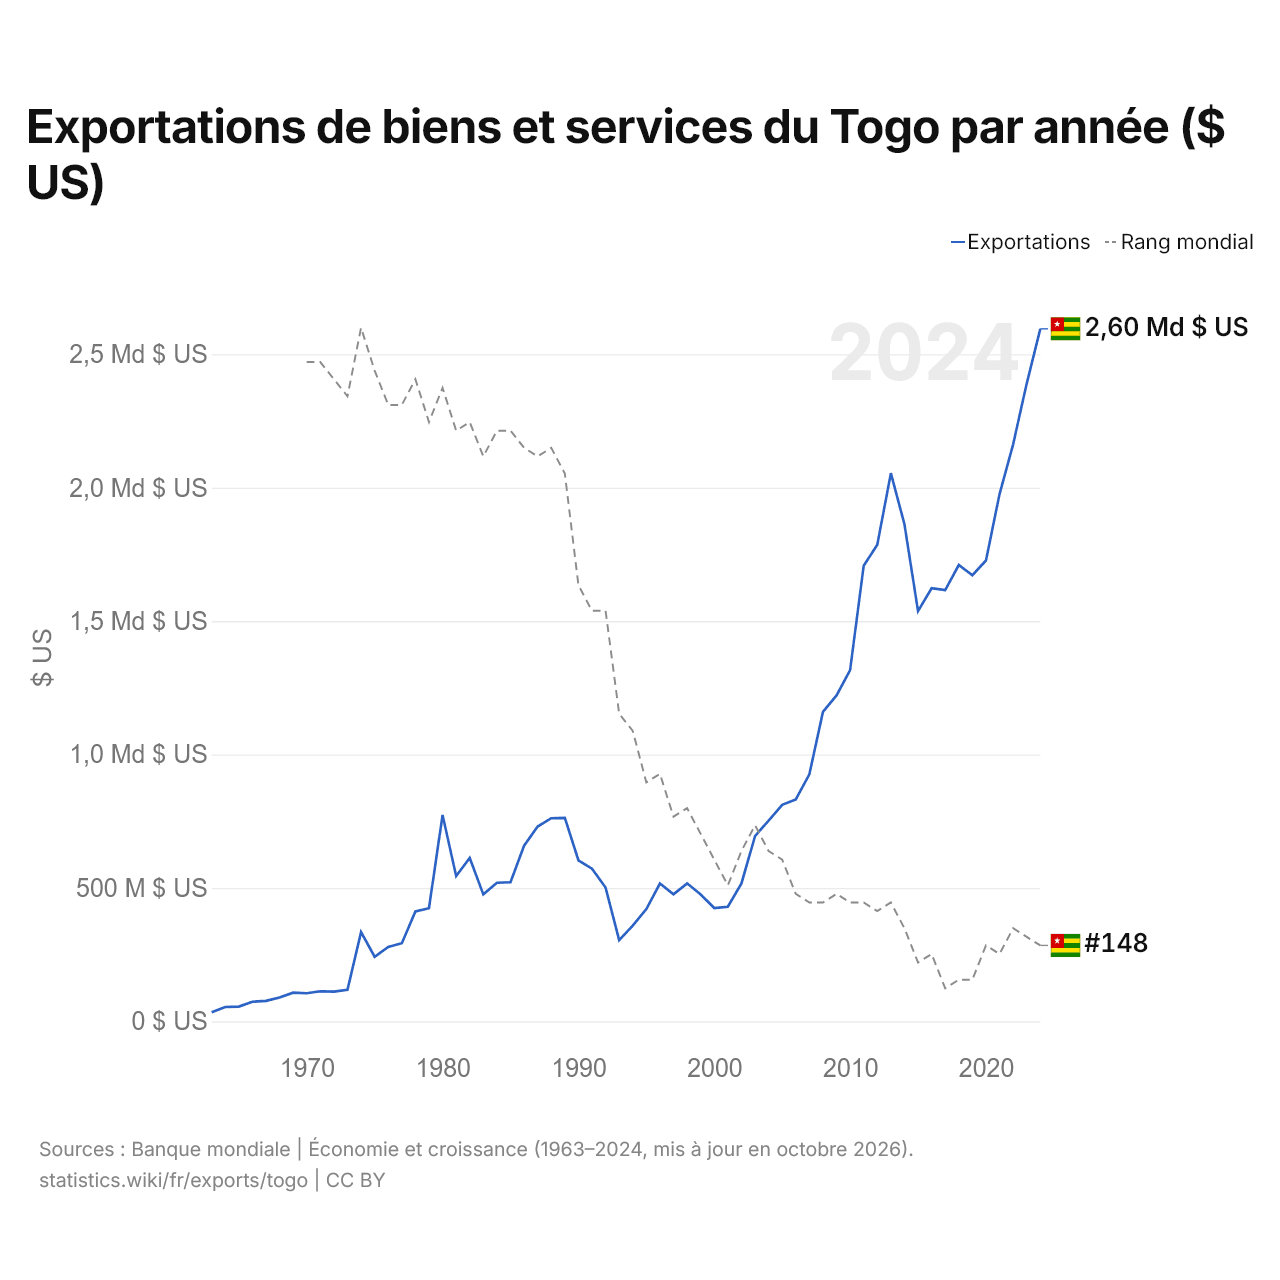
Exportations de biens et services du Togo par année ($ US)
| Année | $ US | Rang mondial |
|---|---|---|
| Exportations | Rang mondial | |
| 2024 | 2 595 208 462 $ US | #148 |
| 2023 | 2 390 186 784 $ US | #147 |
| 2022 | 2 162 409 655 $ US | #146 |
| 2021 | 1 976 054 796 $ US | #149 |
| 2020 | 1 727 046 855 $ US | #148 |
| 2019 | 1 671 782 879 $ US | #152 |
| 2018 | 1 710 211 644 $ US | #152 |
| 2017 | 1 616 151 022 $ US | #153 |
| 2016 | 1 622 914 086 $ US | #149 |
| 2015 | 1 537 319 040 $ US | #150 |
| 2014 | 1 862 941 457 $ US | #146 |
| 2013 | 2 054 079 312 $ US | #143 |
| 2012 | 1 785 883 226 $ US | #144 |
| 2011 | 1 707 777 924 $ US | #143 |
| 2010 | 1 315 957 055 $ US | #143 |
| 2009 | 1 221 146 144 $ US | #142 |
| 2008 | 1 159 663 571 $ US | #143 |
| 2007 | 925 780 996 $ US | #143 |
| 2006 | 831 810 885 $ US | #142 |
| 2005 | 811 362 054 $ US | #138 |
| 2004 | 752 390 244 $ US | #137 |
| 2003 | 694 096 765 $ US | #134 |
| 2002 | 516 701 879 $ US | #137 |
| 2001 | 429 366 653 $ US | #141 |
| 2000 | 424 670 348 $ US | #138 |
| 1999 | 475 147 222 $ US | #135 |
| 1998 | 517 181 588 $ US | #132 |
| 1997 | 475 868 141 $ US | #133 |
| 1996 | 516 316 176 $ US | #128 |
| 1995 | 420 808 142 $ US | #129 |
| 1994 | 358 302 927 $ US | #123 |
| 1993 | 304 394 721 $ US | #121 |
| 1992 | 501 433 055 $ US | #109 |
| 1991 | 571 926 371 $ US | #109 |
| 1990 | 603 505 041 $ US | #106 |
| 1989 | 762 306 409 $ US | #93 |
| 1988 | 761 211 516 $ US | #90 |
| 1987 | 730 213 616 $ US | #91 |
| 1986 | 658 172 673 $ US | #90 |
| 1985 | 521 170 889 $ US | #88 |
| 1984 | 519 366 253 $ US | #88 |
| 1983 | 475 737 820 $ US | #91 |
| 1982 | 612 220 841 $ US | #87 |
| 1981 | 544 664 193 $ US | #88 |
| 1980 | 773 472 155 $ US | #83 |
| 1979 | 423 733 952 $ US | #87 |
| 1978 | 411 848 054 $ US | #82 |
| 1977 | 292 684 965 $ US | #85 |
| 1976 | 278 511 973 $ US | #85 |
| 1975 | 241 897 335 $ US | #81 |
| 1974 | 334 262 104 $ US | #76 |
| 1973 | 118 108 145 $ US | #84 |
| 1972 | 111 476 082 $ US | #82 |
| 1971 | 112 649 362 $ US | #80 |
| 1970 | 105 117 779 $ US | #80 |
| 1969 | 107 560 601 $ US | - |
| 1968 | 89 558 558 $ US | - |
| 1967 | 76 924 426 $ US | - |
| 1966 | 73 576 520 $ US | - |
| 1965 | 55 333 336 $ US | - |
| 1964 | 53 756 126 $ US | - |
| 1963 | 34 342 045 $ US | - |
Les exportations de biens et services du Togo s'élèvent à 2,6 milliards de dollars (2024), contre 34,3 millions de dollars en 1963. Elles se classent au 148e rang mondial, en baisse par rapport au 147e rang l'année précédente. Leur meilleur rang a été le 76e, occupé pour la dernière fois en 1974.
Les exportations de biens et services du Togo sont les 38es plus élevées de 50 pays situés en Afrique. Les importations de biens et services du Togo s'élèvent à 4,05 milliards de dollars (2024), au 144e rang mondial. Les importations du Togo dépassent ses exportations de 1,46 milliard de dollars, soit un déficit commercial (2024).
Exportations de biens du Togo par catégorie, 2025
Exportations de biens, 2025: 1,70 Md $US
En 2025, la première catégorie des exportations de biens du Togo était « pétrole, gaz, minerais et autres matières premières », avec 31,4 %, suivie de « aliments transformés, huiles, aliments pour animaux, boissons et tabac », avec 24,0 %.
Destinations des exportations de biens du Togo : les 10 premières, 2025
| Rang | Pays | Exportations de biens | Part | |
|---|---|---|---|---|
| 1 |
 Inde |
330 M $US | 19,4 % | |
| 2 |
 Côte d’Ivoire |
203 M $US | 12 % | vs Côte d’Ivoire |
| 3 |
 Burkina Faso |
178 M $US | 10,5 % | vs Burkina Faso |
| 4 |
 Bénin |
126 M $US | 7,41 % | vs Bénin |
| 5 |
 Ghana |
103 M $US | 6,07 % | vs Ghana |
| 6 |
 France |
100 M $US | 5,9 % | vs France |
| 7 |
 Mali |
90,1 M $US | 5,31 % | |
| 8 |
 Niger |
74,0 M $US | 4,36 % | |
| 9 |
 Sénégal |
73,2 M $US | 4,31 % | |
| 10 |
 États-Unis |
69,5 M $US | 4,1 % | |
| Autres partenaires et non précisés | 351 M $US | 20,7 % |
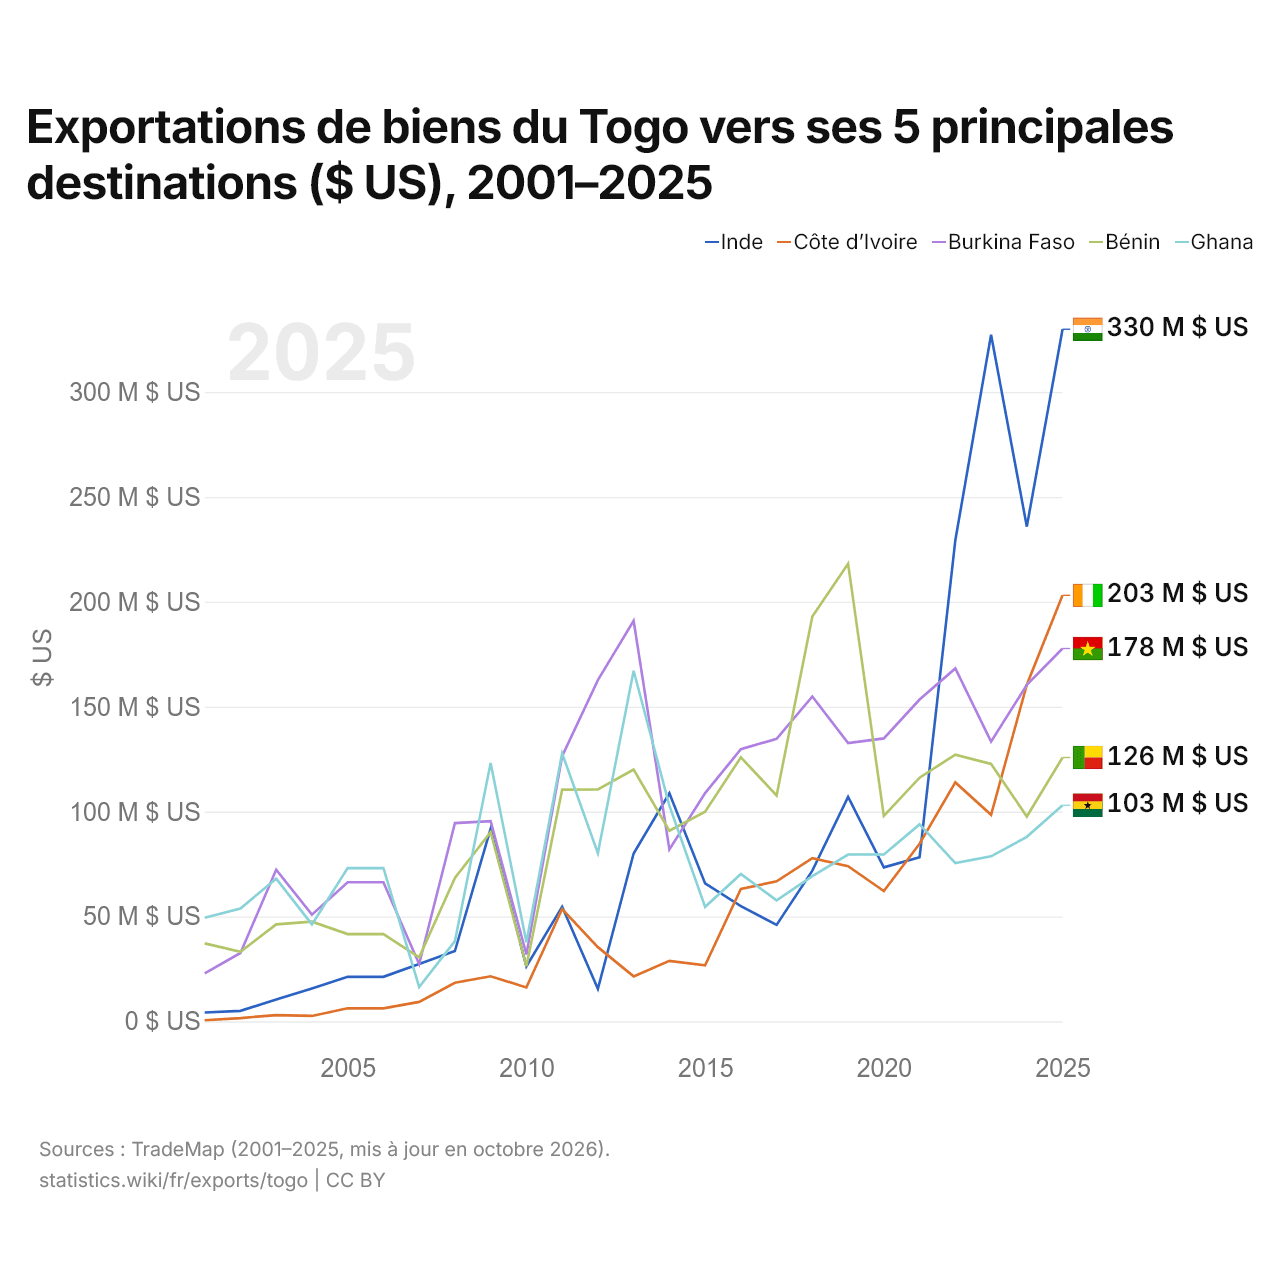
Exportations de biens du Togo vers ses 5 principales destinations ($ US), 2001–2025
| Année | $ US | ||||
|---|---|---|---|---|---|
| Inde | Côte d’Ivoire | Burkina Faso | Bénin | Ghana | |
| 2025 | 329 933 000 $ US | 203 078 000 $ US | 177 751 000 $ US | 125 769 000 $ US | 103 023 000 $ US |
| 2024 | 235 831 000 $ US | 160 509 000 $ US | 160 371 000 $ US | 97 651 000 $ US | 87 940 000 $ US |
| 2023 | 327 334 000 $ US | 98 444 000 $ US | 133 344 000 $ US | 122 664 000 $ US | 78 664 000 $ US |
| 2022 | 229 318 000 $ US | 113 907 000 $ US | 168 249 000 $ US | 127 156 000 $ US | 75 404 000 $ US |
| 2021 | 78 225 000 $ US | 84 666 000 $ US | 153 388 000 $ US | 116 153 000 $ US | 93 908 000 $ US |
| 2020 | 73 385 000 $ US | 62 126 000 $ US | 134 891 000 $ US | 97 893 000 $ US | 79 539 000 $ US |
| 2019 | 107 002 000 $ US | 73 982 000 $ US | 132 609 000 $ US | 218 163 000 $ US | 79 511 000 $ US |
| 2018 | 71 821 000 $ US | 77 821 000 $ US | 154 871 000 $ US | 192 987 000 $ US | 69 265 000 $ US |
| 2017 | 45 978 000 $ US | 66 757 000 $ US | 134 692 000 $ US | 107 671 000 $ US | 57 697 000 $ US |
| 2016 | 54 892 000 $ US | 63 080 000 $ US | 129 727 000 $ US | 125 844 000 $ US | 70 235 000 $ US |
| 2015 | 65 752 000 $ US | 26 751 000 $ US | 108 826 000 $ US | 99 920 000 $ US | 54 577 000 $ US |
| 2014 | 108 734 000 $ US | 28 841 000 $ US | 81 909 000 $ US | 90 893 000 $ US | 102 847 000 $ US |
| 2013 | 80 027 000 $ US | 21 431 000 $ US | 190 968 000 $ US | 120 073 000 $ US | 167 116 000 $ US |
| 2012 | 15 466 000 $ US | 35 369 000 $ US | 162 636 000 $ US | 110 566 000 $ US | 80 164 000 $ US |
| 2011 | 54 616 000 $ US | 53 527 000 $ US | 126 370 000 $ US | 110 431 000 $ US | 127 740 000 $ US |
| 2010 | 26 111 000 $ US | 16 154 000 $ US | 31 887 000 $ US | 26 246 000 $ US | 37 740 000 $ US |
| 2009 | 91 906 000 $ US | 21 476 000 $ US | 95 400 000 $ US | 90 169 000 $ US | 123 115 000 $ US |
| 2008 | 33 513 000 $ US | 18 384 000 $ US | 94 486 000 $ US | 68 376 000 $ US | 38 226 000 $ US |
| 2007 | 27 371 000 $ US | 9 257 000 $ US | 27 270 000 $ US | 30 482 000 $ US | 16 376 000 $ US |
| 2006 | 21 208 000 $ US | 6 213 000 $ US | 66 303 000 $ US | 41 610 000 $ US | 73 045 000 $ US |
| 2005 | 21 208 000 $ US | 6 213 000 $ US | 66 303 000 $ US | 41 610 000 $ US | 73 045 000 $ US |
| 2004 | 15 613 000 $ US | 2 568 000 $ US | 50 855 000 $ US | 47 485 000 $ US | 46 183 000 $ US |
| 2003 | 10 364 000 $ US | 2 993 000 $ US | 72 283 000 $ US | 46 215 000 $ US | 68 046 000 $ US |
| 2002 | 5 003 000 $ US | 1 533 000 $ US | 32 560 000 $ US | 33 135 000 $ US | 53 791 000 $ US |
| 2001 | 4 226 000 $ US | 506 000 $ US | 22 839 000 $ US | 37 157 000 $ US | 49 411 000 $ US |
En 2025, les exportations de biens s'élevaient à 330 millions de dollars vers l'Inde, 203 millions de dollars vers la Côte d’Ivoire, 178 millions de dollars vers le Burkina Faso, 126 millions de dollars vers le Bénin et 103 millions de dollars vers le Ghana. Le premier rang des cinq destinations du Togo est occupé par l'Inde depuis 2022. Le changement le plus récent dans leur ordre remonte à 2024, quand les exportations du Togo vers la Côte d’Ivoire ont dépassé celles vers le Burkina Faso.
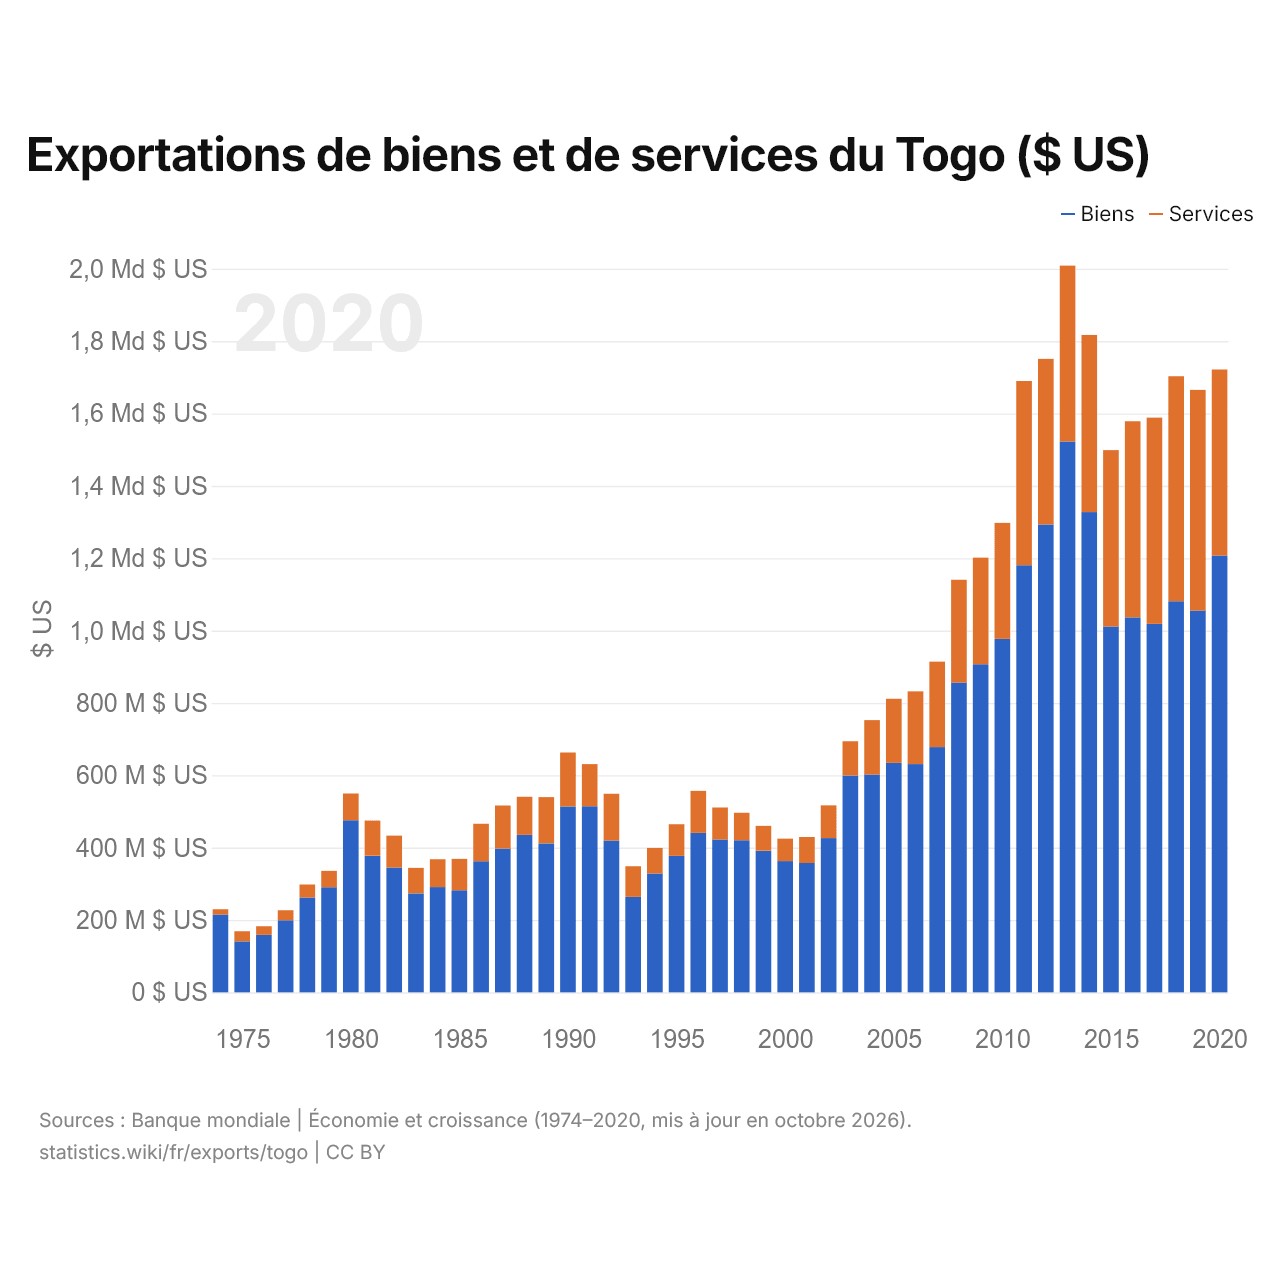
Exportations de biens et de services du Togo ($ US)
| Année | $ US | |
|---|---|---|
| Biens | Services | |
| 2020 | 1 207 444 306 $ US | 514 115 545 $ US |
| 2019 | 1 055 109 029 $ US | 610 027 789 $ US |
| 2018 | 1 081 014 486 $ US | 621 893 590 $ US |
| 2017 | 1 018 601 709 $ US | 569 993 809 $ US |
| 2016 | 1 036 501 362 $ US | 541 878 423 $ US |
| 2015 | 1 010 951 315 $ US | 487 737 681 $ US |
| 2014 | 1 327 504 733 $ US | 489 509 290 $ US |
| 2013 | 1 522 413 062 $ US | 486 121 249 $ US |
| 2012 | 1 293 274 454 $ US | 457 667 807 $ US |
| 2011 | 1 180 353 575 $ US | 509 418 271 $ US |
| 2010 | 977 107 167 $ US | 320 537 266 $ US |
| 2009 | 906 658 672 $ US | 294 732 380 $ US |
| 2008 | 856 052 464 $ US | 284 235 400 $ US |
| 2007 | 677 789 083 $ US | 236 328 941 $ US |
| 2006 | 630 912 956 $ US | 200 899 410 $ US |
| 2005 | 634 341 646 $ US | 176 983 651 $ US |
| 2004 | 602 097 669 $ US | 150 243 288 $ US |
| 2003 | 599 052 634 $ US | 95 009 906 $ US |
| 2002 | 426 236 618 $ US | 90 427 856 $ US |
| 2001 | 357 524 337 $ US | 71 817 539 $ US |
| 2000 | 362 720 511 $ US | 61 931 155 $ US |
| 1999 | 391 614 032 $ US | 68 451 380 $ US |
| 1998 | 420 269 945 $ US | 76 045 199 $ US |
| 1997 | 422 472 056 $ US | 88 502 160 $ US |
| 1996 | 440 644 960 $ US | 116 207 052 $ US |
| 1995 | 377 402 773 $ US | 87 320 720 $ US |
| 1994 | 328 386 992 $ US | 70 878 363 $ US |
| 1993 | 264 007 342 $ US | 84 633 358 $ US |
| 1992 | 419 725 884 $ US | 129 206 873 $ US |
| 1991 | 514 425 544 $ US | 116 438 127 $ US |
| 1990 | 513 830 676 $ US | 149 075 465 $ US |
| 1989 | 411 697 753 $ US | 128 043 691 $ US |
| 1988 | 435 345 897 $ US | 105 147 515 $ US |
| 1987 | 397 505 711 $ US | 118 810 835 $ US |
| 1986 | 362 358 824 $ US | 103 674 236 $ US |
| 1985 | 281 999 654 $ US | 86 966 884 $ US |
| 1984 | 290 973 934 $ US | 76 760 472 $ US |
| 1983 | 273 506 401 $ US | 70 628 178 $ US |
| 1982 | 344 816 932 $ US | 88 294 120 $ US |
| 1981 | 377 711 152 $ US | 97 070 103 $ US |
| 1980 | 475 772 489 $ US | 73 873 688 $ US |
| 1979 | 290 558 115 $ US | 45 232 821 $ US |
| 1978 | 261 956 414 $ US | 36 001 724 $ US |
| 1977 | 199 300 157 $ US | 27 649 824 $ US |
| 1976 | 158 861 358 $ US | 23 770 614 $ US |
| 1975 | 140 952 784 $ US | 27 931 123 $ US |
| 1974 | 215 056 071 $ US | 14 490 787 $ US |
Les exportations de biens du Togo s'élèvent à 1,21 milliard de dollars (2020) et celles de services à 514 millions de dollars ; les services représentent 29,9 % du total, contre 6,3 % en 1974.
Le Togo dans le classement mondial des exportations
| Rang | Pays | Exportations | Part mondiale | |
|---|---|---|---|---|
| 145 |
 Suriname |
3,18 Md $US (2025) | 0,009 % | |
| 146 |
 Afghanistan |
2,79 Md $US | 0,009 % | |
| 147 |
 Eswatini |
2,79 Md $US (2025) | 0,008 % | |
| 148 |
 Togo |
2,60 Md $US | 0,008 % | |
| 149 |
 Tadjikistan |
2,12 Md $US (2025) | 0,006 % | |
| 150 |
 Curaçao |
2,11 Md $US (2023) | 0,007 % | |
| 151 |
 Seychelles |
1,90 Md $US (2025) | 0,005 % |
Exportations de biens et services du Togo, % du PIB
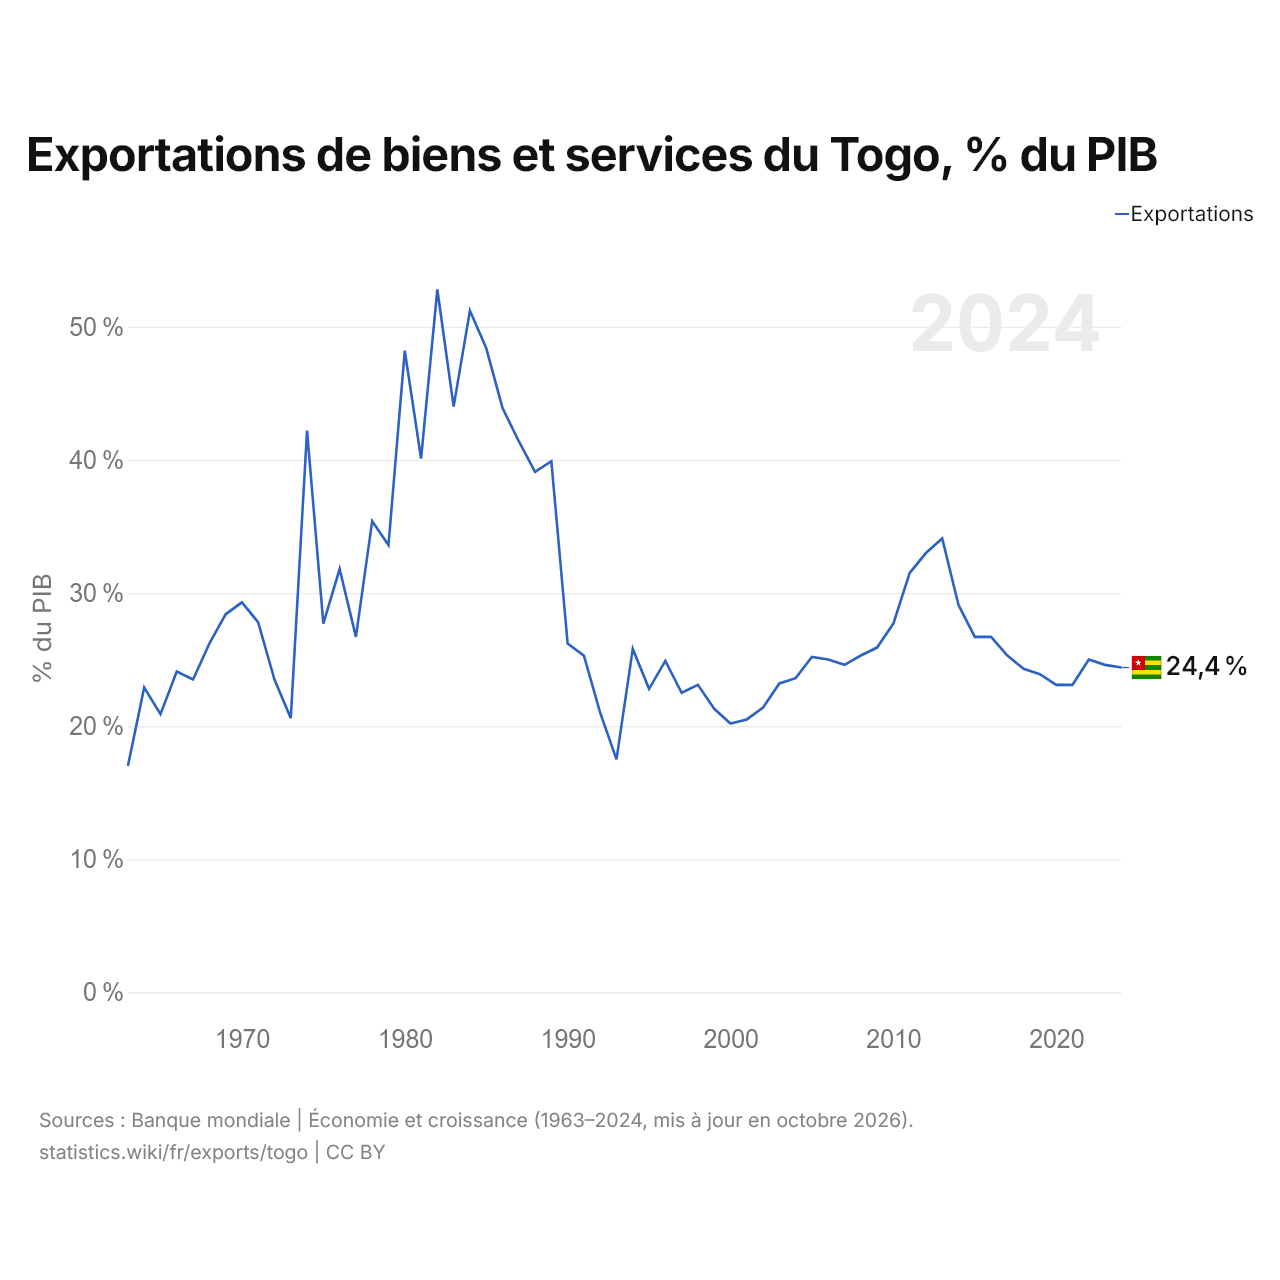
Les exportations de biens et services du Togo équivalent à 24,4 % de son PIB (2024), contre 17,0 % en 1963. La part la plus élevée a été de 52,8 %, en 1982.
Comparer les exportations du Togo avec celles d'autres pays
Sources :
- Banque mondiale | Économie et croissance (1963–2025, mis à jour en octobre 2026)
- TradeMap (2001–2025, mis à jour en octobre 2026)
Creative Commons Attribution (CC BY) : vous pouvez copier, partager, adapter et réutiliser ce contenu, y compris à des fins commerciales, à condition de citer statistics.wiki et d’indiquer les modifications apportées. Les sources citées ci-dessus peuvent avoir leurs propres conditions de licence.