
Togo vs Ghana : exportations de biens et services par année ($ US)
| Année | $ US | |
|---|---|---|
 Togo |
 Ghana |
|
| 2024 | 2 595 208 462 $ US | 29 197 465 999 $ US |
| 2023 | 2 390 186 784 $ US | 25 590 486 225 $ US |
| 2022 | 2 162 409 655 $ US | 25 623 315 467 $ US |
| 2021 | 1 976 054 796 $ US | 23 898 089 227 $ US |
| 2020 | 1 727 046 855 $ US | 22 070 393 252 $ US |
| 2019 | 1 671 782 879 $ US | 25 597 786 148 $ US |
| 2018 | 1 710 211 644 $ US | 22 501 546 549 $ US |
| 2017 | 1 616 151 022 $ US | 20 456 689 540 $ US |
| 2016 | 1 622 914 086 $ US | 17 513 188 147 $ US |
| 2015 | 1 537 319 040 $ US | 16 725 314 358 $ US |
| 2014 | 1 862 941 457 $ US | 15 436 790 167 $ US |
| 2013 | 2 054 079 312 $ US | 15 988 443 998 $ US |
| 2012 | 1 785 883 226 $ US | 16 656 935 875 $ US |
| 2011 | 1 707 777 924 $ US | 14 529 631 106 $ US |
| 2010 | 1 315 957 055 $ US | 9 490 812 129 $ US |
| 2009 | 1 221 146 144 $ US | 7 630 156 153 $ US |
| 2008 | 1 159 663 571 $ US | 7 178 293 982 $ US |
| 2007 | 925 780 996 $ US | 6 088 927 418 $ US |
| 2006 | 831 810 885 $ US | 5 149 454 654 $ US |
| 2005 | 811 362 054 $ US | 3 916 311 040 $ US |
| 2004 | 752 390 244 $ US | 3 490 692 555 $ US |
| 2003 | 694 096 765 $ US | 3 104 918 871 $ US |
| 2002 | 516 701 879 $ US | 2 627 802 407 $ US |
| 2001 | 429 366 653 $ US | 2 404 077 313 $ US |
| 2000 | 424 670 348 $ US | 2 431 743 617 $ US |
| 1999 | 475 147 222 $ US | 2 475 841 481 $ US |
| 1998 | 517 181 588 $ US | 2 534 277 965 $ US |
| 1997 | 475 868 141 $ US | 2 233 536 788 $ US |
| 1996 | 516 316 176 $ US | 2 226 334 937 $ US |
| 1995 | 420 808 142 $ US | 1 583 544 040 $ US |
| 1994 | 358 302 927 $ US | 1 375 682 237 $ US |
| 1993 | 304 394 721 $ US | 1 208 940 821 $ US |
| 1992 | 501 433 055 $ US | 1 105 235 207 $ US |
| 1991 | 571 926 371 $ US | 1 120 134 374 $ US |
| 1990 | 603 505 041 $ US | 993 956 954 $ US |
| 1989 | 762 306 409 $ US | 879 299 611 $ US |
| 1988 | 761 211 516 $ US | 945 129 549 $ US |
| 1987 | 730 213 616 $ US | 997 843 537 $ US |
| 1986 | 658 172 673 $ US | 950 751 458 $ US |
| 1985 | 521 170 889 $ US | 479 910 714 $ US |
| 1984 | 519 366 253 $ US | 354 924 984 $ US |
| 1983 | 475 737 820 $ US | 225 418 871 $ US |
| 1982 | 612 220 841 $ US | 134 733 894 $ US |
| 1981 | 544 664 193 $ US | 200 813 953 $ US |
| 1980 | 773 472 155 $ US | 376 348 548 $ US |
| 1979 | 423 733 952 $ US | 451 566 952 $ US |
| 1978 | 411 848 054 $ US | 306 108 202 $ US |
| 1977 | 292 684 965 $ US | 334 857 143 $ US |
| 1976 | 278 511 973 $ US | 434 322 034 $ US |
| 1975 | 241 897 335 $ US | 544 148 936 $ US |
| 1974 | 334 262 104 $ US | 530 434 783 $ US |
| 1973 | 118 108 145 $ US | 644 981 958 $ US |
| 1972 | 111 476 082 $ US | 437 466 068 $ US |
| 1971 | 112 649 362 $ US | 380 936 312 $ US |
| 1970 | 105 117 779 $ US | 472 617 875 $ US |
| 1969 | 107 560 601 $ US | 387 311 329 $ US |
| 1968 | 89 558 558 $ US | 339 265 114 $ US |
| 1967 | 76 924 426 $ US | 304 363 805 $ US |
| 1966 | 73 576 520 $ US | 310 960 968 $ US |
| 1965 | 55 333 336 $ US | 351 581 995 $ US |
| 1964 | 53 756 126 $ US | 344 578 370 $ US |
| 1963 | 34 342 045 $ US | 326 368 944 $ US |
| 1962 | - | 334 773 294 $ US |
| 1961 | - | 340 376 195 $ US |
| 1960 | - | 343 177 645 $ US |
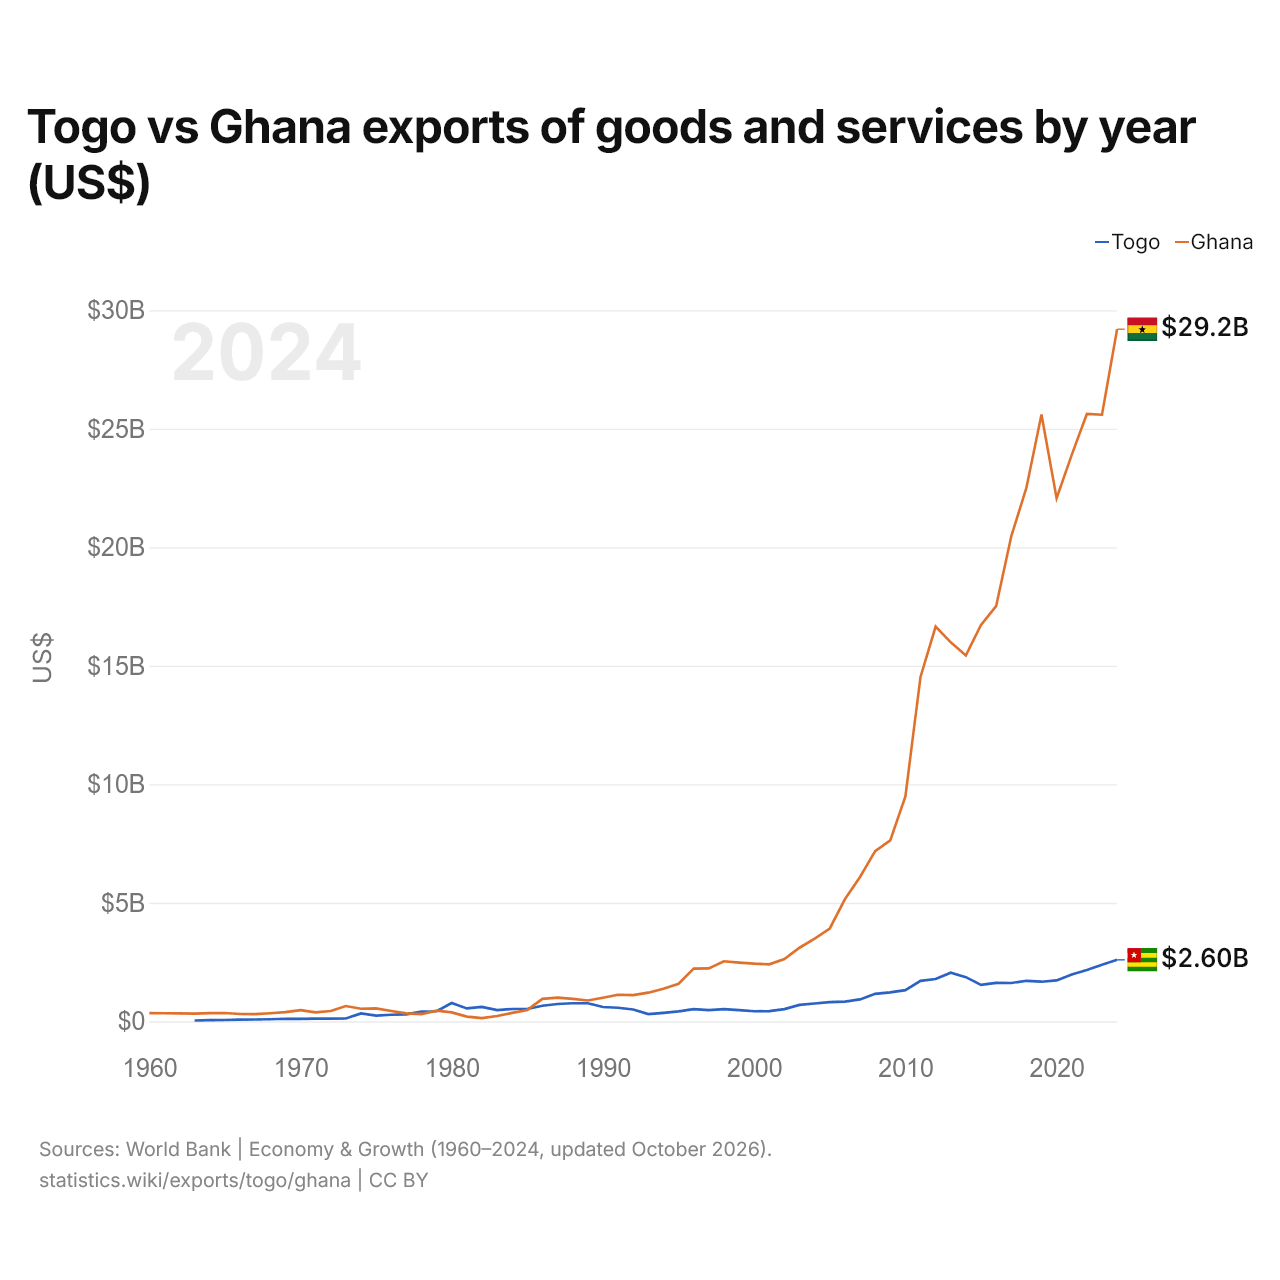
Les exportations de biens et services du Togo s'élèvent à 2,6 milliards de dollars (2024) et celles du Ghana à 29,2 milliards de dollars (2024) : celles du Ghana sont 11 fois plus élevées. En 1963, les exportations du Ghana étaient 9,5 fois plus élevées : 34,3 millions de dollars pour le Togo et 326 millions de dollars pour le Ghana.
Les exportations de biens et services du Ghana sont supérieures à celles du Togo chaque année depuis 1986.
Exportations de biens entre le Togo et le Ghana, selon chaque exportateur ($ US), 2001–2025
| Année | $ US | |
|---|---|---|
| Togo → Ghana | Ghana → Togo | |
| 2025 | 103 023 000 $ US | 306 497 000 $ US |
| 2024 | 87 940 000 $ US | 236 012 000 $ US |
| 2023 | 78 664 000 $ US | 255 044 000 $ US |
| 2022 | 75 404 000 $ US | 186 024 000 $ US |
| 2021 | 93 908 000 $ US | 398 205 000 $ US |
| 2020 | 79 539 000 $ US | 159 948 000 $ US |
| 2019 | 79 511 000 $ US | 159 948 000 $ US |
| 2018 | 69 265 000 $ US | 138 713 000 $ US |
| 2017 | 57 697 000 $ US | 194 463 000 $ US |
| 2016 | 70 235 000 $ US | 312 670 000 $ US |
| 2015 | 54 577 000 $ US | 185 422 000 $ US |
| 2014 | 102 847 000 $ US | 119 500 000 $ US |
| 2013 | 167 116 000 $ US | 75 543 000 $ US |
| 2012 | 80 164 000 $ US | 878 093 000 $ US |
| 2011 | 127 740 000 $ US | 4 594 009 000 $ US |
| 2010 | 37 740 000 $ US | 70 136 000 $ US |
| 2009 | 123 115 000 $ US | 50 184 000 $ US |
| 2008 | 38 226 000 $ US | 12 602 000 $ US |
| 2007 | 16 376 000 $ US | 6 863 000 $ US |
| 2006 | 73 045 000 $ US | 1 706 000 $ US |
| 2005 | 73 045 000 $ US | 75 000 $ US |
| 2004 | 46 183 000 $ US | 3 677 000 $ US |
| 2003 | 68 046 000 $ US | 30 034 000 $ US |
| 2002 | 53 791 000 $ US | 52 867 000 $ US |
| 2001 | 49 411 000 $ US | 52 867 000 $ US |
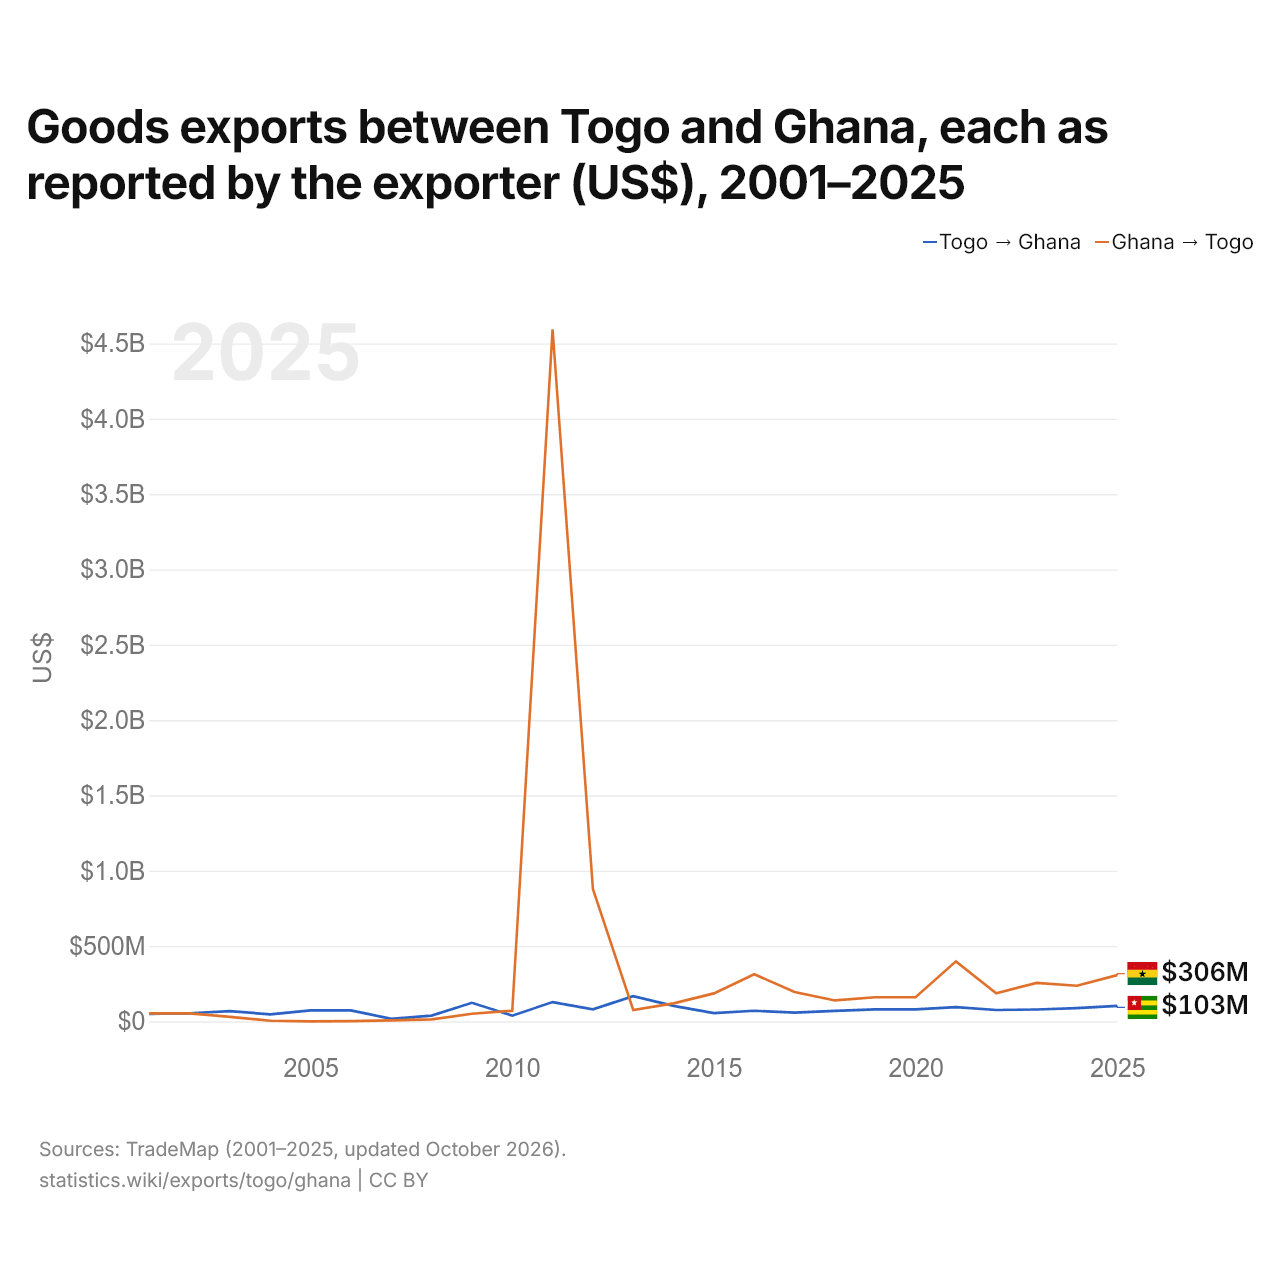
En 2025, les exportations de biens du Togo vers le Ghana, selon le Togo, s'élevaient à 103 millions de dollars, et celles du Ghana vers le Togo, selon le Ghana, à 306 millions de dollars : 3,0 fois plus pour celles du Ghana. En 2001, elles s'élevaient à 49,4 millions de dollars pour le Togo et à 52,9 millions de dollars pour le Ghana.
Togo vs Ghana : chiffres des exportations
|
Togo
|
Ghana
|
|
|---|---|---|
| Exportations | 2,60 Md $US (2024) | 29,2 Md $US (2024) |
| Rang mondial | 148/176 | 83/176 |
| Part mondiale | 0,008 % | 0,09 % |
| % du PIB | 24,4 % | 35,1 % |
| Première catégorie de biens | Pétrole, gaz, minerais et autres matières premières (31,4 %, 2025) | Métaux précieux, pierres précieuses, bijoux, montres, instruments de musique et art (63,1 %, 2025) |
| Première destination des biens | Inde (19,4 %, 2025) | Émirats arabes unis (25,9 %, 2025) |
Comparer les exportations de 2 pays au choix
Sources :
- Banque mondiale | Économie et croissance (1960–2024, mis à jour en octobre 2026)
- TradeMap (2001–2025, mis à jour en octobre 2026)
Creative Commons Attribution (CC BY) : vous pouvez copier, partager, adapter et réutiliser ce contenu, y compris à des fins commerciales, à condition de citer statistics.wiki et d’indiquer les modifications apportées. Les sources citées ci-dessus peuvent avoir leurs propres conditions de licence.