
Exportations de biens et services du Guyana par année ($ US)
| Année | $ US | Rang mondial |
|---|---|---|
| Exportations | Rang mondial | |
| 2023 | 13 739 107 699 $ US | #100 |
| 2022 | 11 517 488 745 $ US | #103 |
| 2021 | 4 593 656 260 $ US | #128 |
| 2020 | 2 772 936 722 $ US | #135 |
| 2019 | 1 798 058 123 $ US | #150 |
| 2018 | 1 568 801 927 $ US | #153 |
| 2017 | 1 643 614 998 $ US | #152 |
| 2016 | 1 680 519 748 $ US | #147 |
| 2015 | 1 296 096 535 $ US | #152 |
| 2014 | 1 348 029 272 $ US | #153 |
| 2013 | 1 539 804 818 $ US | #150 |
| 2012 | 1 713 223 752 $ US | #146 |
| 2011 | 1 426 674 913 $ US | #145 |
| 2010 | 1 133 030 208 $ US | #145 |
| 2009 | 938 490 818 $ US | #147 |
| 2008 | 1 013 400 726 $ US | #144 |
| 2007 | 847 778 000 $ US | #146 |
| 2006 | 727 246 000 $ US | #145 |
| 2005 | 698 037 584 $ US | #143 |
| 2004 | 752 856 480 $ US | #136 |
| 2003 | 666 355 170 $ US | #136 |
| 2002 | 670 242 445 $ US | #132 |
| 2001 | 661 420 416 $ US | #130 |
| 2000 | 684 731 124 $ US | #125 |
| 1999 | 670 497 421 $ US | #126 |
| 1998 | 688 346 952 $ US | #123 |
| 1997 | 746 591 431 $ US | #121 |
| 1996 | 723 896 875 $ US | #120 |
| 1995 | 629 152 004 $ US | #123 |
| 1994 | 567 658 924 $ US | #115 |
| 1993 | 519 140 473 $ US | #111 |
| 1992 | 469 762 448 $ US | #111 |
| 1991 | 356 599 995 $ US | #117 |
| 1990 | 248 683 534 $ US | #121 |
| 1989 | 251 948 537 $ US | #107 |
| 1988 | 263 299 990 $ US | #106 |
| 1987 | 282 142 847 $ US | #103 |
| 1986 | 233 674 419 $ US | #103 |
| 1985 | 218 069 767 $ US | #101 |
| 1984 | 193 263 158 $ US | #102 |
| 1983 | 224 500 000 $ US | #98 |
| 1982 | 254 400 000 $ US | #97 |
| 1981 | 393 107 143 $ US | #96 |
| 1980 | 490 319 960 $ US | #92 |
| 1979 | 317 240 000 $ US | #89 |
| 1978 | 319 880 000 $ US | #87 |
| 1977 | 284 360 000 $ US | #86 |
| 1976 | 300 280 000 $ US | #82 |
| 1975 | 370 500 000 $ US | #77 |
| 1974 | 296 590 909 $ US | #80 |
| 1973 | 160 238 095 $ US | #80 |
| 1972 | 164 000 000 $ US | #77 |
| 1971 | 164 750 000 $ US | #76 |
| 1970 | 151 200 000 $ US | #76 |
| 1969 | 147 700 000 $ US | - |
| 1968 | 133 800 000 $ US | - |
| 1967 | 143 705 882 $ US | - |
| 1966 | 125 764 706 $ US | - |
| 1965 | 117 823 529 $ US | - |
| 1964 | 111 241 389 $ US | - |
| 1963 | 110 599 724 $ US | - |
| 1962 | 110 424 724 $ US | - |
| 1961 | 96 774 758 $ US | - |
| 1960 | 82 949 793 $ US | - |
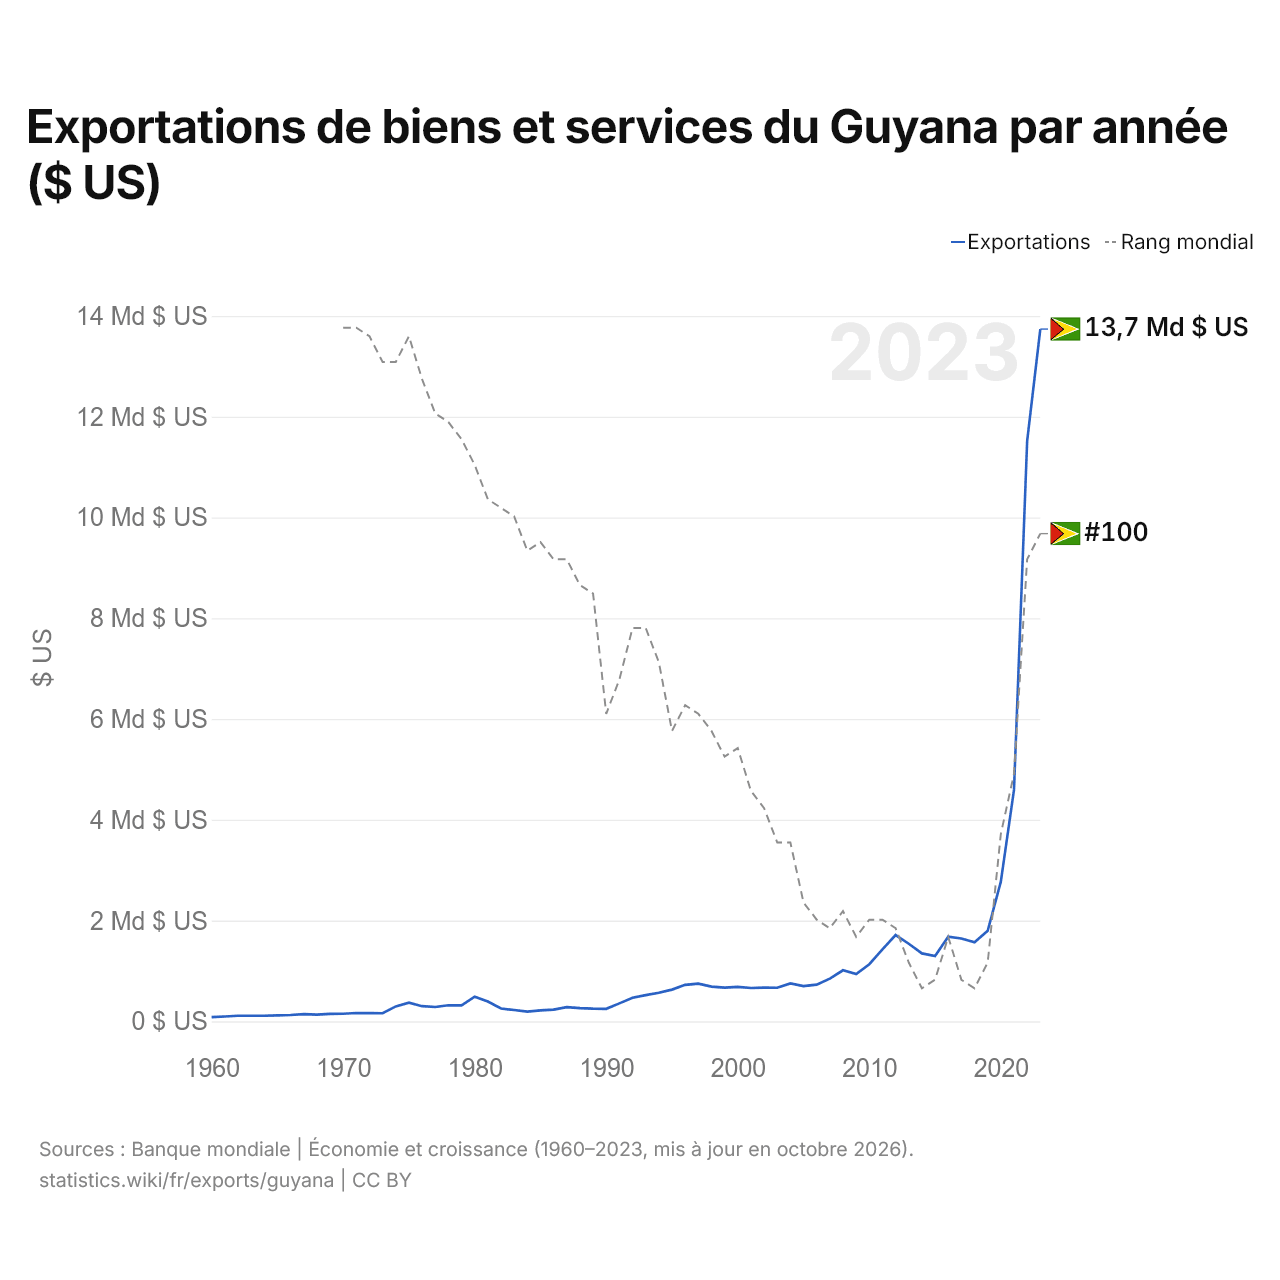
Les exportations de biens et services du Guyana s'élèvent à 13,7 milliards de dollars (2023), contre 82,9 millions de dollars en 1960. Elles se classent au 100e rang mondial, en hausse par rapport au 103e rang l'année précédente. Leur meilleur rang a été le 76e, occupé pour la dernière fois en 1971.
Les exportations de biens et services du Guyana sont les 16es plus élevées de 27 pays situés en Amérique latine. Les importations de biens et services du Guyana s'élèvent à 11 milliards de dollars (2023), au 117e rang mondial. Les exportations du Guyana dépassent ses importations de 2,78 milliards de dollars, soit un excédent commercial (2023).
Exportations de biens du Guyana par catégorie, 2025
Exportations de biens, 2025: 24,3 Md $US
En 2025, la première catégorie des exportations de biens du Guyana était « pétrole, gaz, minerais et autres matières premières », avec 76,5 %, suivie de « métaux précieux, pierres précieuses, bijoux, montres, instruments de musique et art », avec 21,0 %.
Destinations des exportations de biens du Guyana : les 10 premières, 2025
| Rang | Pays | Exportations de biens | Part | |
|---|---|---|---|---|
| 1 |
 États-Unis |
6,70 Md $US | 27,6 % | |
| 2 |
 Belgique |
3,85 Md $US | 15,9 % | |
| 3 |
 Royaume-Uni |
2,36 Md $US | 9,7 % | |
| 4 |
 Panama |
1,92 Md $US | 7,9 % | |
| 5 |
 Singapour |
1,65 Md $US | 6,8 % | |
| 6 |
 Pays-Bas |
1,22 Md $US | 5,02 % | |
| 7 |
 EAU |
713 M $US | 2,93 % | |
| 8 |
 Italie |
660 M $US | 2,72 % | |
| 9 |
 Espagne |
642 M $US | 2,64 % | |
| 10 |
 Pologne |
578 M $US | 2,38 % | |
| Autres partenaires et non précisés | 4,01 Md $US | 16,5 % |
Exportations de biens du Guyana vers ses 5 principales destinations ($ US), 2001–2025
| Année | $ US | ||||
|---|---|---|---|---|---|
| États-Unis | Belgique | Royaume-Uni | Panama | Singapour | |
| 2025 | 6 700 641 000 $ US | 3 854 599 000 $ US | 2 358 012 000 $ US | 1 919 616 000 $ US | 1 653 354 000 $ US |
| 2024 | 3 353 926 000 $ US | 197 110 000 $ US | 3 142 326 000 $ US | 2 527 033 000 $ US | 1 170 989 000 $ US |
| 2023 | 510 180 000 $ US | 12 807 000 $ US | 798 051 000 $ US | 3 018 202 000 $ US | 1 062 000 $ US |
| 2022 | 2 703 102 000 $ US | 3 300 000 $ US | 448 531 000 $ US | 149 000 $ US | 802 385 000 $ US |
| 2021 | 1 780 744 000 $ US | 3 276 000 $ US | 292 475 000 $ US | 556 000 $ US | 698 153 000 $ US |
| 2020 | 796 692 000 $ US | 14 239 000 $ US | 84 567 000 $ US | 29 352 000 $ US | 125 630 000 $ US |
| 2019 | 175 038 000 $ US | 63 570 000 $ US | 25 076 000 $ US | 96 371 000 $ US | 1 506 000 $ US |
| 2018 | 227 345 000 $ US | 39 374 000 $ US | 46 805 000 $ US | 162 042 000 $ US | 3 018 000 $ US |
| 2017 | 284 880 000 $ US | 57 778 000 $ US | 127 071 000 $ US | 157 294 000 $ US | 1 918 000 $ US |
| 2016 | 280 026 000 $ US | 29 334 000 $ US | 77 053 000 $ US | 32 291 000 $ US | 4 415 000 $ US |
| 2015 | 310 880 000 $ US | 33 314 000 $ US | 91 224 000 $ US | 75 827 000 $ US | 3 996 000 $ US |
| 2014 | 300 200 000 $ US | 23 039 000 $ US | 97 077 000 $ US | 28 689 000 $ US | 3 678 000 $ US |
| 2013 | 361 865 000 $ US | 21 361 000 $ US | 116 387 000 $ US | 2 411 000 $ US | 4 275 000 $ US |
| 2012 | 333 525 000 $ US | 14 259 000 $ US | 114 610 000 $ US | 1 626 000 $ US | 7 477 000 $ US |
| 2011 | 226 800 000 $ US | 14 506 000 $ US | 77 606 000 $ US | 976 000 $ US | 8 666 000 $ US |
| 2010 | 92 322 000 $ US | 15 522 000 $ US | 48 150 000 $ US | 1 177 000 $ US | 6 541 000 $ US |
| 2009 | 97 309 000 $ US | 15 030 000 $ US | 111 799 000 $ US | 681 000 $ US | 5 913 000 $ US |
| 2008 | 116 132 000 $ US | 28 060 000 $ US | 140 411 000 $ US | 2 589 000 $ US | 5 429 000 $ US |
| 2007 | 113 082 000 $ US | 30 001 000 $ US | 124 941 000 $ US | 1 686 000 $ US | 7 250 000 $ US |
| 2006 | 87 675 000 $ US | 27 683 000 $ US | 115 725 000 $ US | 215 000 $ US | 802 000 $ US |
| 2005 | 83 419 000 $ US | 27 135 000 $ US | 105 478 000 $ US | 194 000 $ US | 557 000 $ US |
| 2004 | 89 666 000 $ US | 76 116 000 $ US | 64 562 000 $ US | 1 205 000 $ US | 211 000 $ US |
| 2003 | 94 289 000 $ US | 19 667 000 $ US | 105 406 000 $ US | 359 000 $ US | 216 000 $ US |
| 2002 | 113 874 000 $ US | 11 941 000 $ US | 46 203 000 $ US | 195 000 $ US | 22 000 $ US |
| 2001 | 160 002 000 $ US | 10 423 000 $ US | 66 440 000 $ US | 198 000 $ US | 48 000 $ US |
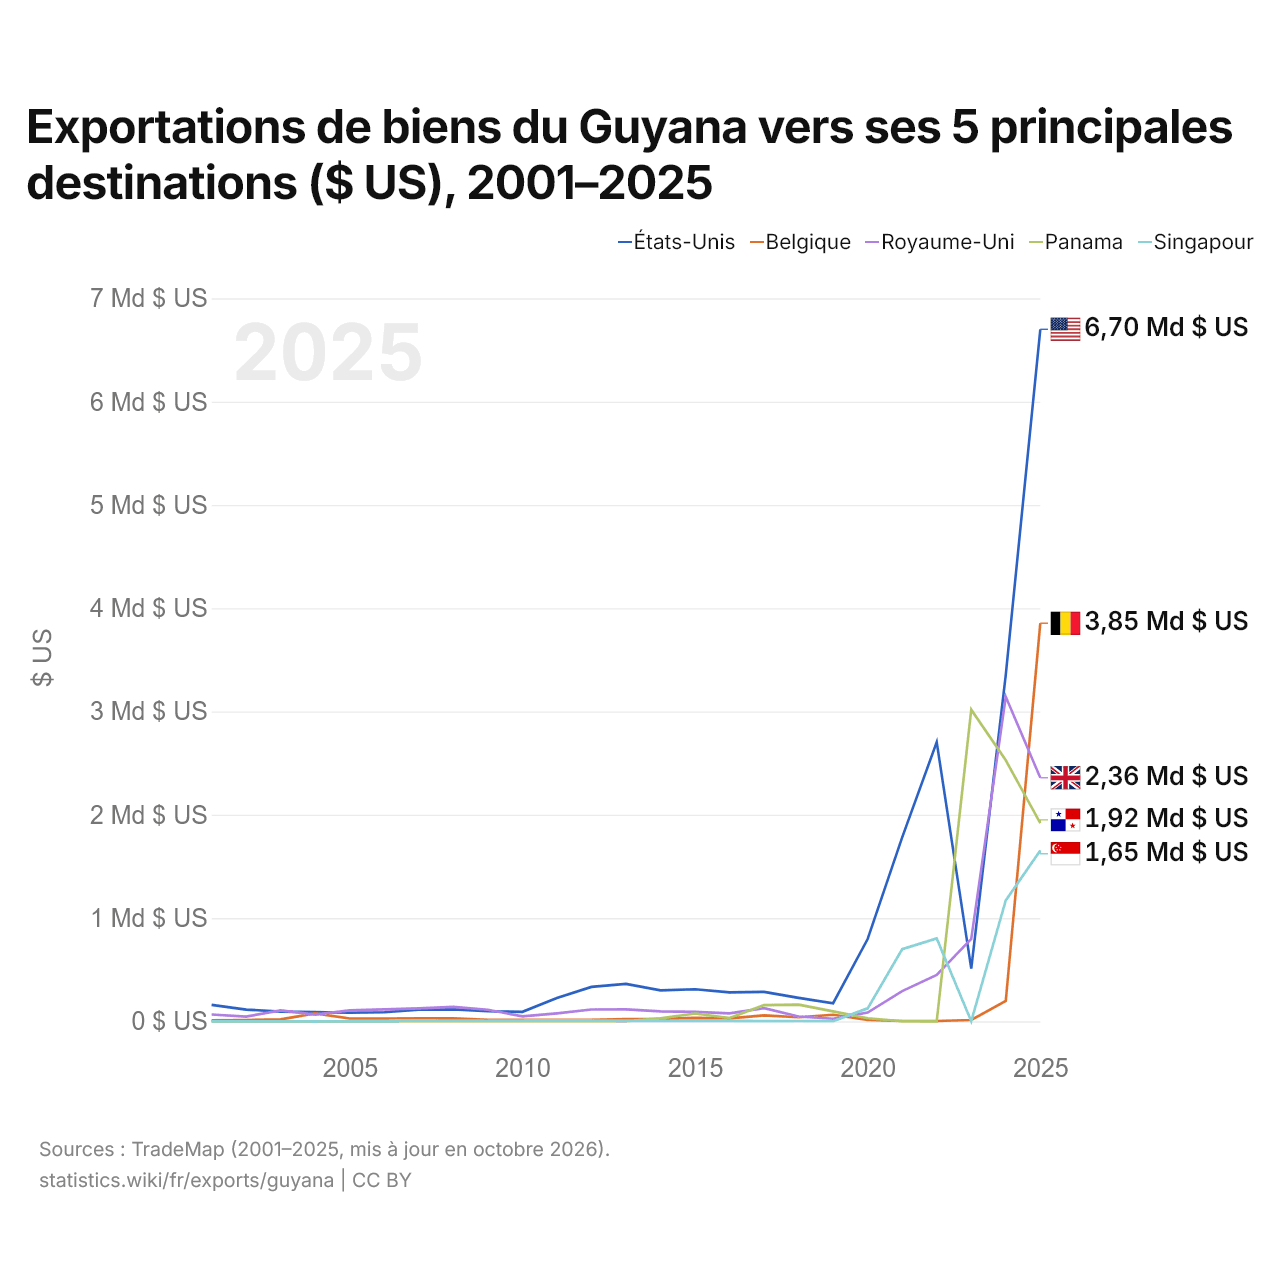
En 2025, les exportations de biens s'élevaient à 6,7 milliards de dollars vers les États-Unis, 3,85 milliards de dollars vers la Belgique, 2,36 milliards de dollars vers le Royaume-Uni, 1,92 milliard de dollars vers le Panama et 1,65 milliard de dollars vers Singapour. Le premier rang des cinq destinations du Guyana est occupé par les États-Unis depuis 2024. Le changement le plus récent dans leur ordre remonte à 2025, quand les exportations du Guyana vers la Belgique ont dépassé celles vers le Royaume-Uni.
Exportations de biens et de services du Guyana ($ US)
| Année | $ US | |
|---|---|---|
| Biens | Services | |
| 2023 | 13 210 200 502 $ US | 528 907 197 $ US |
| 2022 | 11 280 422 542 $ US | 237 066 202 $ US |
| 2021 | 4 355 912 633 $ US | 237 743 627 $ US |
| 2020 | 2 589 953 960 $ US | 182 982 762 $ US |
| 2019 | 1 567 001 510 $ US | 231 056 613 $ US |
| 2018 | 1 377 136 300 $ US | 191 665 627 $ US |
| 2017 | 1 437 329 894 $ US | 206 285 104 $ US |
| 2016 | 1 434 405 435 $ US | 246 114 312 $ US |
| 2015 | 1 151 257 152 $ US | 144 839 383 $ US |
| 2014 | 1 167 188 505 $ US | 180 840 766 $ US |
| 2013 | 1 375 114 818 $ US | 164 690 000 $ US |
| 2012 | 1 415 453 833 $ US | 297 769 919 $ US |
| 2011 | 1 129 076 609 $ US | 297 598 304 $ US |
| 2010 | 884 979 901 $ US | 248 050 307 $ US |
| 2009 | 768 183 773 $ US | 170 307 046 $ US |
| 2008 | 801 519 877 $ US | 211 880 849 $ US |
| 2007 | 674 881 000 $ US | 172 897 000 $ US |
| 2006 | 579 602 000 $ US | 147 644 000 $ US |
| 2005 | 545 631 000 $ US | 147 866 000 $ US |
| 2004 | 583 994 000 $ US | 160 893 000 $ US |
| 2003 | 508 000 000 $ US | 156 800 000 $ US |
| 2002 | 490 100 000 $ US | 172 300 000 $ US |
| 2001 | 485 400 000 $ US | 172 000 000 $ US |
| 2000 | 502 900 000 $ US | 169 300 000 $ US |
| 1999 | 522 300 000 $ US | 147 000 000 $ US |
| 1998 | 545 100 000 $ US | 141 800 000 $ US |
| 1997 | 590 600 000 $ US | 148 100 000 $ US |
| 1996 | 572 300 000 $ US | 140 100 000 $ US |
| 1995 | 495 700 000 $ US | 133 475 000 $ US |
| 1994 | 463 400 000 $ US | 120 715 000 $ US |
| 1993 | 415 500 000 $ US | 115 325 000 $ US |
| 1992 | 381 700 000 $ US | 105 852 000 $ US |
| 1991 | - | - |
| 1990 | - | - |
| 1989 | - | - |
| 1988 | - | - |
| 1987 | - | - |
| 1986 | - | - |
| 1985 | 214 024 232 $ US | 48 002 578 $ US |
| 1984 | 216 882 280 $ US | 29 230 825 $ US |
| 1983 | 193 333 333 $ US | 31 533 333 $ US |
| 1982 | 241 433 333 $ US | 22 600 000 $ US |
| 1981 | 346 417 778 $ US | 22 968 889 $ US |
| 1980 | 388 862 745 $ US | 19 764 706 $ US |
| 1979 | 292 705 882 $ US | 18 549 020 $ US |
| 1978 | 295 607 843 $ US | 18 156 863 $ US |
| 1977 | 259 333 333 $ US | 16 156 863 $ US |
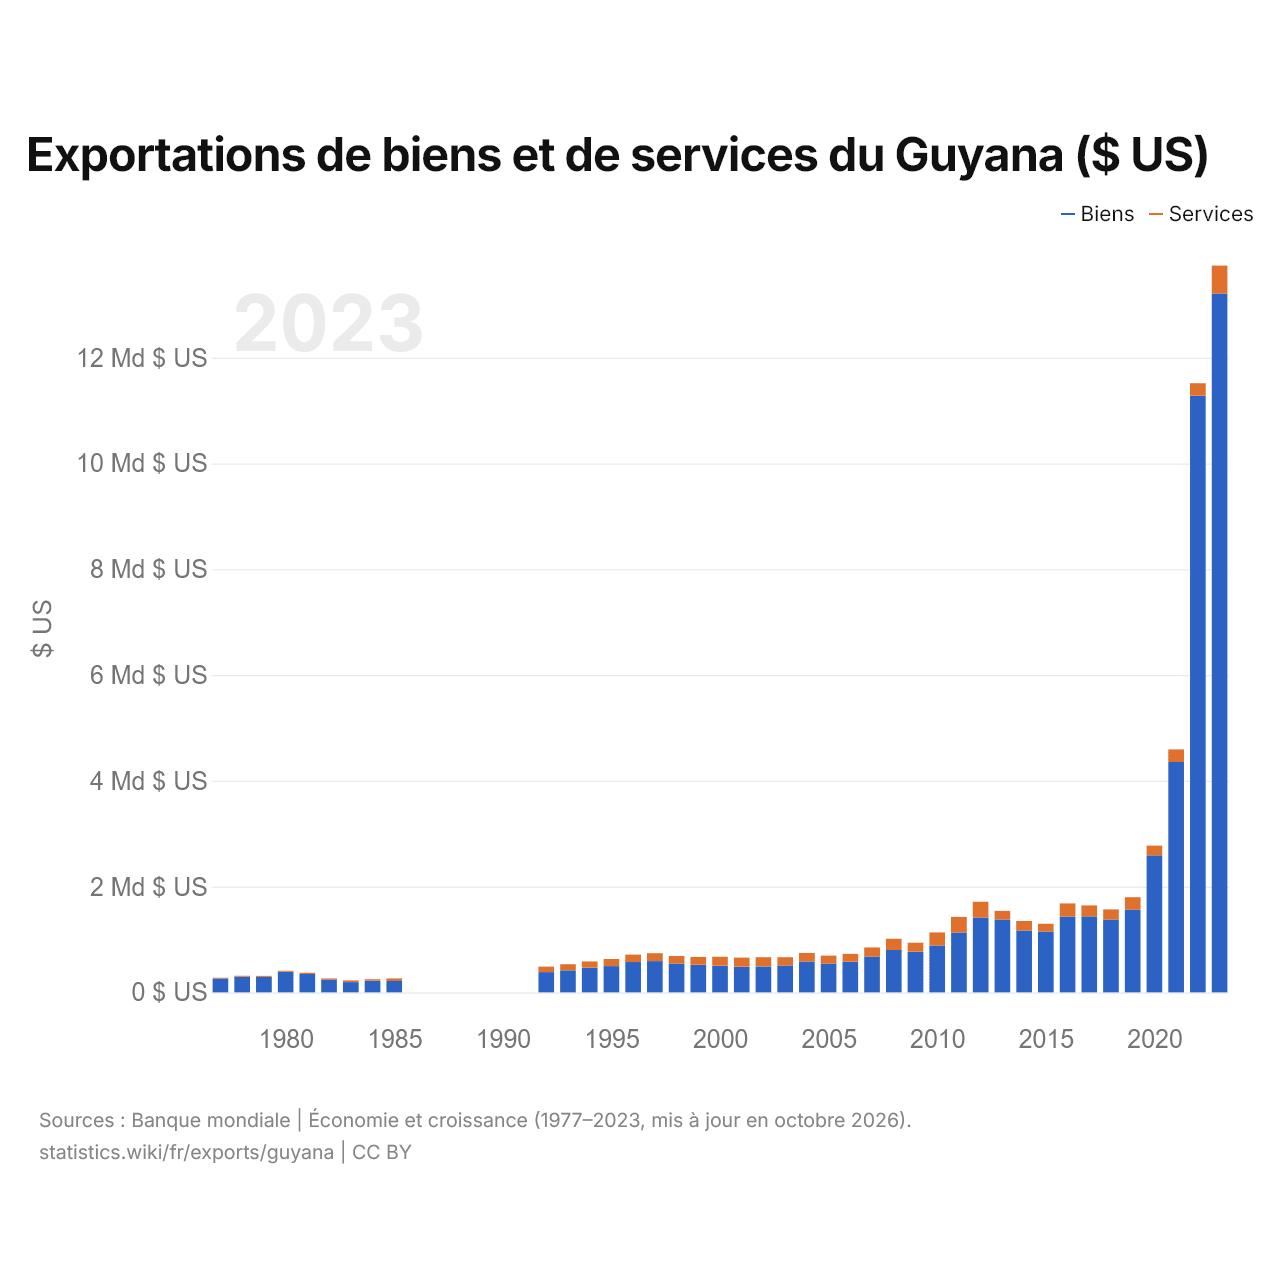
Les exportations de biens du Guyana s'élèvent à 13,2 milliards de dollars (2023) et celles de services à 529 millions de dollars ; les services représentent 3,8 % du total, contre 5,9 % en 1977.
Le Guyana dans le classement mondial des exportations
| Rang | Pays | Exportations | Part mondiale | |
|---|---|---|---|---|
| 97 |
 Venezuela |
14,9 Md $US (2025) | 0,04 % | |
| 98 |
 Arménie |
14,1 Md $US (2025) | 0,04 % | |
| 99 |
 Honduras |
13,9 Md $US (2025) | 0,04 % | |
| 100 |
 Guyana |
13,7 Md $US | 0,04 % | |
| 101 |
 Papouasie |
13,5 Md $US (2024) | 0,04 % | |
| 102 |
 Bosnie-Herzégovine |
13,4 Md $US (2025) | 0,04 % | |
| 103 |
 Ouganda |
13,3 Md $US (2025) | 0,04 % |
Exportations de biens et services du Guyana, % du PIB
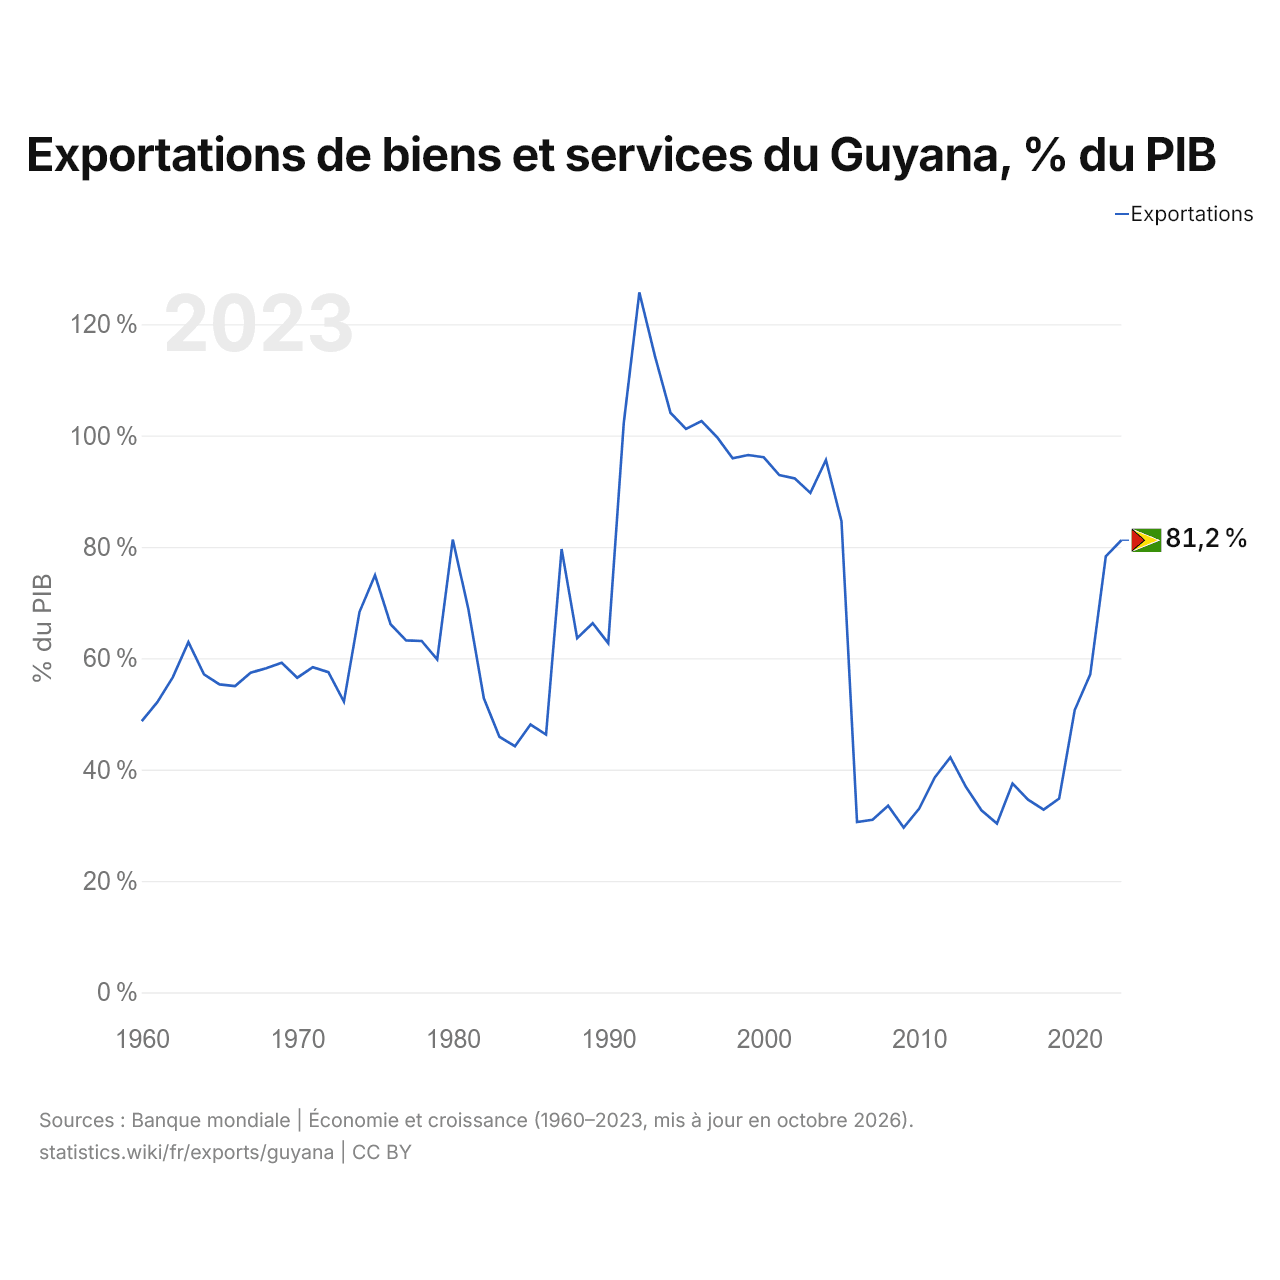
Les exportations de biens et services du Guyana équivalent à 81,2 % de son PIB (2023), contre 48,7 % en 1960. La part la plus élevée a été de 125,7 %, en 1992.
Comparer les exportations du Guyana avec celles d'autres pays
Sources :
- Banque mondiale | Économie et croissance (1960–2025, mis à jour en octobre 2026)
- TradeMap (2001–2025, mis à jour en octobre 2026)
Creative Commons Attribution (CC BY) : vous pouvez copier, partager, adapter et réutiliser ce contenu, y compris à des fins commerciales, à condition de citer statistics.wiki et d’indiquer les modifications apportées. Les sources citées ci-dessus peuvent avoir leurs propres conditions de licence.