
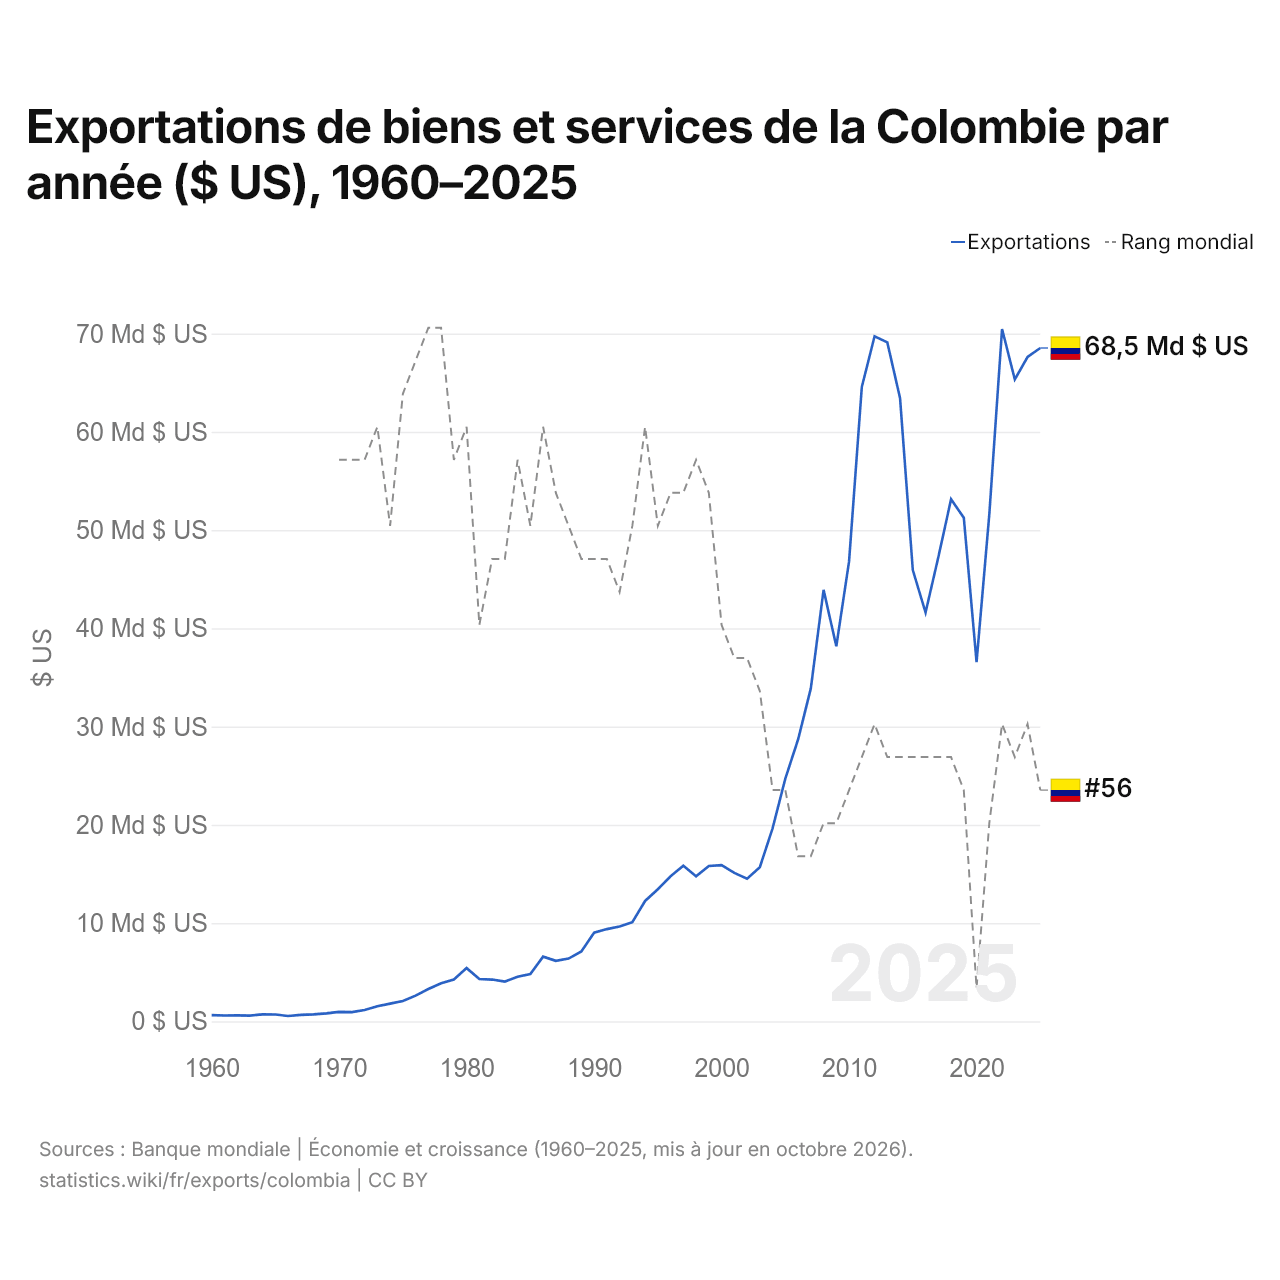
Exportations de biens et services de la Colombie par année ($ US), 1960–2025
| Année | $ US | Rang mondial |
|---|---|---|
| Exportations | Rang mondial | |
| 2025 | 68 538 536 937 $ US | #56 |
| 2024 | 67 618 959 764 $ US | #54 |
| 2023 | 65 337 018 069 $ US | #55 |
| 2022 | 70 468 824 549 $ US | #54 |
| 2021 | 51 591 453 811 $ US | #57 |
| 2020 | 36 557 247 849 $ US | #62 |
| 2019 | 51 258 795 210 $ US | #56 |
| 2018 | 53 136 579 845 $ US | #55 |
| 2017 | 47 233 141 872 $ US | #55 |
| 2016 | 41 608 310 927 $ US | #55 |
| 2015 | 45 932 176 699 $ US | #55 |
| 2014 | 63 418 461 300 $ US | #55 |
| 2013 | 69 107 146 201 $ US | #55 |
| 2012 | 69 731 471 881 $ US | #54 |
| 2011 | 64 569 763 970 $ US | #55 |
| 2010 | 46 816 280 695 $ US | #56 |
| 2009 | 38 181 805 547 $ US | #57 |
| 2008 | 43 916 519 836 $ US | #57 |
| 2007 | 33 889 993 567 $ US | #58 |
| 2006 | 28 683 606 694 $ US | #58 |
| 2005 | 24 709 929 564 $ US | #56 |
| 2004 | 19 637 278 136 $ US | #56 |
| 2003 | 15 687 687 300 $ US | #53 |
| 2002 | 14 511 230 142 $ US | #52 |
| 2001 | 15 110 265 986 $ US | #52 |
| 2000 | 15 895 257 719 $ US | #51 |
| 1999 | 15 812 211 475 $ US | #47 |
| 1998 | 14 773 797 430 $ US | #46 |
| 1997 | 15 829 917 577 $ US | #47 |
| 1996 | 14 767 813 599 $ US | #47 |
| 1995 | 13 444 770 139 $ US | #48 |
| 1994 | 12 254 186 688 $ US | #45 |
| 1993 | 10 089 611 943 $ US | #48 |
| 1992 | 9 649 972 063 $ US | #50 |
| 1991 | 9 389 847 563 $ US | #49 |
| 1990 | 9 024 672 480 $ US | #49 |
| 1989 | 7 118 228 011 $ US | #49 |
| 1988 | 6 386 221 631 $ US | #48 |
| 1987 | 6 165 155 373 $ US | #47 |
| 1986 | 6 582 202 894 $ US | #45 |
| 1985 | 4 818 142 149 $ US | #48 |
| 1984 | 4 546 303 965 $ US | #46 |
| 1983 | 4 050 952 668 $ US | #49 |
| 1982 | 4 252 517 718 $ US | #49 |
| 1981 | 4 312 469 260 $ US | #51 |
| 1980 | 5 416 924 889 $ US | #45 |
| 1979 | 4 251 544 715 $ US | #46 |
| 1978 | 3 867 783 604 $ US | #42 |
| 1977 | 3 283 905 564 $ US | #42 |
| 1976 | 2 615 131 863 $ US | #43 |
| 1975 | 2 071 845 445 $ US | #44 |
| 1974 | 1 798 616 360 $ US | #48 |
| 1973 | 1 539 558 029 $ US | #45 |
| 1972 | 1 149 373 248 $ US | #46 |
| 1971 | 935 820 963 $ US | #46 |
| 1970 | 955 259 648 $ US | #46 |
| 1969 | 808 812 068 $ US | - |
| 1968 | 701 707 004 $ US | - |
| 1967 | 653 146 477 $ US | - |
| 1966 | 541 851 852 $ US | - |
| 1965 | 699 047 619 $ US | - |
| 1964 | 714 265 144 $ US | - |
| 1963 | 579 510 844 $ US | - |
| 1962 | 605 741 204 $ US | - |
| 1961 | 589 865 537 $ US | - |
| 1960 | 632 672 494 $ US | - |
En 2025, les exportations de biens et services de la Colombie s'élevaient à 68,5 milliards de dollars, contre 633 millions de dollars en 1960. Le maximum a été de 70,5 milliards de dollars, en 2022. Elles se classaient au 56e rang mondial, en baisse par rapport au 54e rang en 2024. Leur meilleur rang a été le 42e, occupé pour la dernière fois en 1978.
En 2025, les exportations de biens et services de la Colombie étaient les 6es plus élevées de 27 pays situés en Amérique latine. Les importations de biens et services de la Colombie s'élevaient à 93,2 milliards de dollars en 2025, au 52e rang mondial. En 2025, les importations de la Colombie dépassaient ses exportations de 24,7 milliards de dollars, soit un déficit commercial.
Exportations de biens de la Colombie par catégorie, 2025
Exportations de biens, 2025: 50,2 Md $US
En 2025, la première catégorie des exportations de biens de la Colombie était « pétrole, gaz, minerais et autres matières premières », avec 37,7 %, suivie de « cultures, plantes et fleurs (céréales, fruits, légumes, café, oléagineux) », avec 21,6 %.
Destinations des exportations de biens de la Colombie : les 10 premières, 2025
| Rang | Pays | Exportations de biens | Part | |
|---|---|---|---|---|
| 1 |
 États-Unis |
15,4 Md $US | 30,7 % | vs USA |
| 2 |
 Panama |
3,68 Md $US | 7,34 % | |
| 3 |
 Inde |
2,17 Md $US | 4,33 % | |
| 4 |
 Brésil |
1,90 Md $US | 3,78 % | vs Brésil |
| 5 |
 Pays-Bas |
1,88 Md $US | 3,75 % | |
| 6 |
 Équateur |
1,85 Md $US | 3,68 % | vs Équateur |
| 7 |
 Chine |
1,65 Md $US | 3,28 % | |
| 8 |
 Canada |
1,64 Md $US | 3,27 % | vs Canada |
| 9 |
 Mexique |
1,59 Md $US | 3,17 % | vs Mexique |
| 10 |
 Pérou |
1,56 Md $US | 3,12 % | vs Pérou |
| Autres partenaires et non précisés | 16,9 Md $US | 33,6 % |
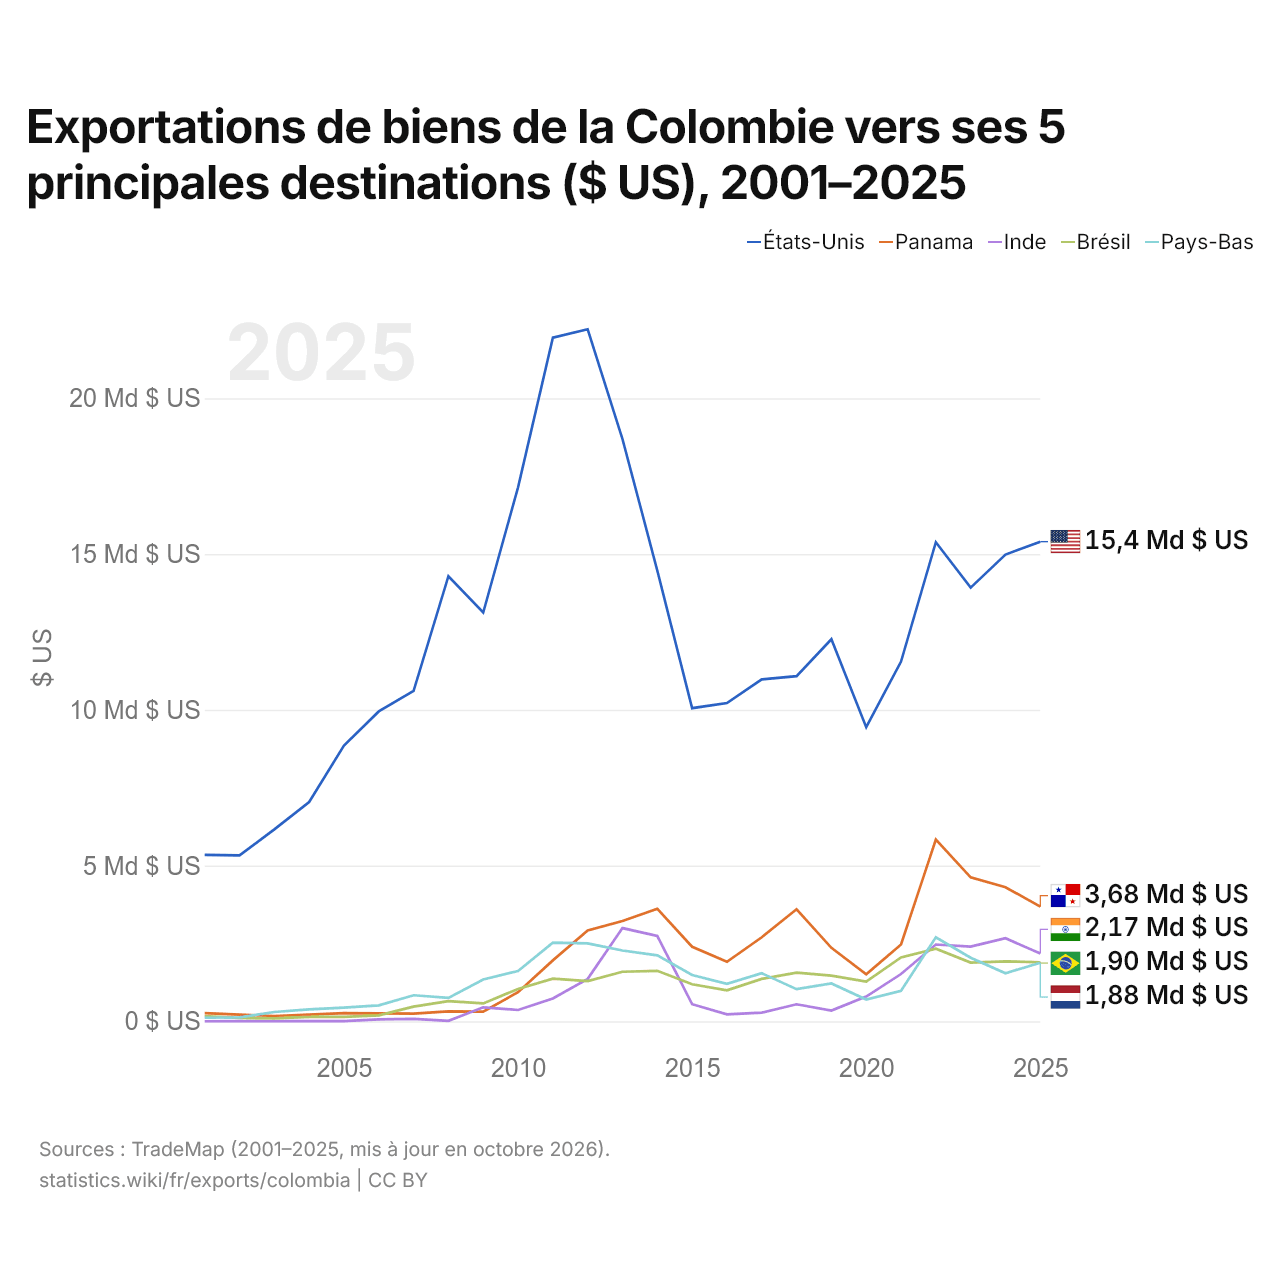
Exportations de biens de la Colombie vers ses 5 principales destinations ($ US), 2001–2025
| Année | $ US | ||||
|---|---|---|---|---|---|
| États-Unis | Panama | Inde | Brésil | Pays-Bas | |
| 2025 | 15 398 935 000 $ US | 3 681 560 000 $ US | 2 174 394 000 $ US | 1 896 398 000 $ US | 1 881 677 000 $ US |
| 2024 | 14 984 412 000 $ US | 4 304 109 000 $ US | 2 668 089 000 $ US | 1 927 267 000 $ US | 1 543 042 000 $ US |
| 2023 | 13 922 127 000 $ US | 4 622 878 000 $ US | 2 397 798 000 $ US | 1 885 421 000 $ US | 2 042 400 000 $ US |
| 2022 | 15 380 933 000 $ US | 5 834 436 000 $ US | 2 465 690 000 $ US | 2 332 731 000 $ US | 2 697 795 000 $ US |
| 2021 | 11 549 621 000 $ US | 2 468 201 000 $ US | 1 519 164 000 $ US | 2 049 079 000 $ US | 981 102 000 $ US |
| 2020 | 9 442 028 000 $ US | 1 510 555 000 $ US | 795 165 000 $ US | 1 274 000 000 $ US | 698 997 000 $ US |
| 2019 | 12 265 471 000 $ US | 2 360 822 000 $ US | 346 182 000 $ US | 1 465 743 000 $ US | 1 215 053 000 $ US |
| 2018 | 11 080 579 000 $ US | 3 597 082 000 $ US | 548 077 000 $ US | 1 561 755 000 $ US | 1 034 657 000 $ US |
| 2017 | 10 975 962 000 $ US | 2 699 759 000 $ US | 279 640 000 $ US | 1 363 480 000 $ US | 1 542 294 000 $ US |
| 2016 | 10 215 894 000 $ US | 1 912 114 000 $ US | 225 635 000 $ US | 994 850 000 $ US | 1 206 479 000 $ US |
| 2015 | 10 052 617 000 $ US | 2 394 166 000 $ US | 550 468 000 $ US | 1 189 887 000 $ US | 1 489 798 000 $ US |
| 2014 | 14 470 697 000 $ US | 3 615 462 000 $ US | 2 738 698 000 $ US | 1 622 413 000 $ US | 2 117 118 000 $ US |
| 2013 | 18 692 895 000 $ US | 3 219 265 000 $ US | 2 993 066 000 $ US | 1 590 629 000 $ US | 2 272 605 000 $ US |
| 2012 | 22 216 238 000 $ US | 2 916 011 000 $ US | 1 362 710 000 $ US | 1 290 579 000 $ US | 2 503 054 000 $ US |
| 2011 | 21 948 535 000 $ US | 1 956 816 000 $ US | 731 878 000 $ US | 1 370 308 000 $ US | 2 524 104 000 $ US |
| 2010 | 17 143 277 000 $ US | 936 345 000 $ US | 364 999 000 $ US | 1 040 263 000 $ US | 1 617 219 000 $ US |
| 2009 | 13 123 466 000 $ US | 309 589 000 $ US | 449 134 000 $ US | 576 636 000 $ US | 1 344 590 000 $ US |
| 2008 | 14 288 833 000 $ US | 318 980 000 $ US | 15 685 000 $ US | 648 941 000 $ US | 752 336 000 $ US |
| 2007 | 10 609 167 000 $ US | 246 322 000 $ US | 76 889 000 $ US | 471 366 000 $ US | 836 178 000 $ US |
| 2006 | 9 948 230 000 $ US | 257 484 000 $ US | 62 854 000 $ US | 190 701 000 $ US | 513 297 000 $ US |
| 2005 | 8 851 631 000 $ US | 264 140 000 $ US | 5 350 000 $ US | 141 348 000 $ US | 439 704 000 $ US |
| 2004 | 7 042 201 000 $ US | 216 490 000 $ US | 8 168 000 $ US | 141 188 000 $ US | 386 158 000 $ US |
| 2003 | 6 160 245 000 $ US | 170 524 000 $ US | 6 330 000 $ US | 92 848 000 $ US | 301 076 000 $ US |
| 2002 | 5 328 470 000 $ US | 214 697 000 $ US | 4 077 000 $ US | 107 823 000 $ US | 128 839 000 $ US |
| 2001 | 5 344 533 000 $ US | 265 163 000 $ US | 2 898 000 $ US | 166 704 000 $ US | 114 302 000 $ US |
En 2025, les exportations de biens s'élevaient à 15,4 milliards de dollars vers les États-Unis, 3,68 milliards de dollars vers le Panama, 2,17 milliards de dollars vers l'Inde, 1,9 milliard de dollars vers le Brésil et 1,88 milliard de dollars vers les Pays-Bas. Le premier rang des cinq destinations de la Colombie est occupé par les États-Unis chaque année depuis 2001. Le changement le plus récent dans leur ordre remonte à 2024, quand les exportations de la Colombie vers le Brésil ont dépassé celles vers les Pays-Bas.
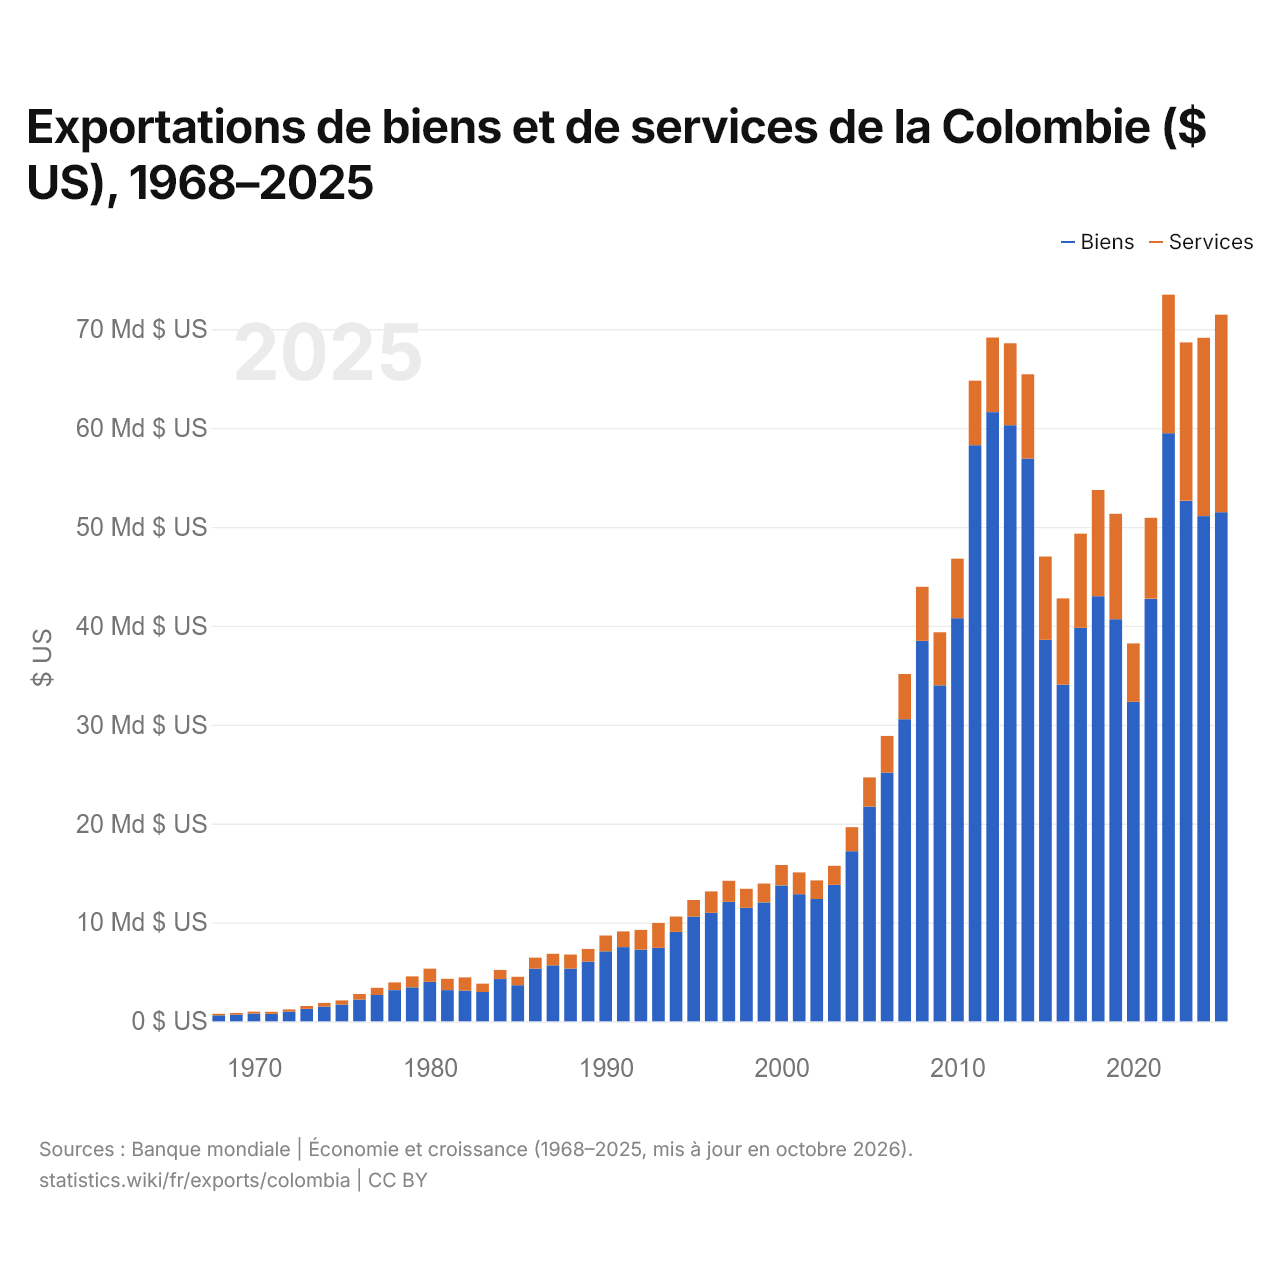
Exportations de biens et de services de la Colombie ($ US), 1968–2025
| Année | $ US | |
|---|---|---|
| Biens | Services | |
| 2025 | 51 486 105 795 $ US | 19 970 115 649 $ US |
| 2024 | 51 090 686 412 $ US | 18 035 372 898 $ US |
| 2023 | 52 641 941 236 $ US | 16 018 772 420 $ US |
| 2022 | 59 473 451 661 $ US | 14 008 964 946 $ US |
| 2021 | 42 735 574 446 $ US | 8 177 865 908 $ US |
| 2020 | 32 308 967 195 $ US | 5 914 665 261 $ US |
| 2019 | 40 655 600 660 $ US | 10 668 419 360 $ US |
| 2018 | 42 993 049 353 $ US | 10 730 969 446 $ US |
| 2017 | 39 785 612 624 $ US | 9 536 024 797 $ US |
| 2016 | 34 063 233 599 $ US | 8 705 602 438 $ US |
| 2015 | 38 572 113 082 $ US | 8 434 422 179 $ US |
| 2014 | 56 898 749 075 $ US | 8 527 732 712 $ US |
| 2013 | 60 282 300 134 $ US | 8 284 493 339 $ US |
| 2012 | 61 603 864 423 $ US | 7 547 834 052 $ US |
| 2011 | 58 262 191 478 $ US | 6 525 697 419 $ US |
| 2010 | 40 761 915 542 $ US | 6 023 536 246 $ US |
| 2009 | 33 977 347 462 $ US | 5 372 183 796 $ US |
| 2008 | 38 476 021 835 $ US | 5 465 043 510 $ US |
| 2007 | 30 555 767 082 $ US | 4 571 964 064 $ US |
| 2006 | 25 166 243 998 $ US | 3 695 485 532 $ US |
| 2005 | 21 708 662 781 $ US | 2 956 157 546 $ US |
| 2004 | 17 194 908 681 $ US | 2 437 296 675 $ US |
| 2003 | 13 798 246 747 $ US | 1 929 641 222 $ US |
| 2002 | 12 367 040 812 $ US | 1 890 269 315 $ US |
| 2001 | 12 860 428 586 $ US | 2 202 653 333 $ US |
| 2000 | 13 744 694 741 $ US | 2 061 970 320 $ US |
| 1999 | 12 026 896 970 $ US | 1 913 507 342 $ US |
| 1998 | 11 479 103 737 $ US | 1 921 092 215 $ US |
| 1997 | 12 084 264 961 $ US | 2 126 765 659 $ US |
| 1996 | 10 972 379 030 $ US | 2 168 281 980 $ US |
| 1995 | 10 592 634 724 $ US | 1 676 976 106 $ US |
| 1994 | 9 050 197 139 $ US | 1 550 740 018 $ US |
| 1993 | 7 428 500 000 $ US | 2 519 900 000 $ US |
| 1992 | 7 263 200 000 $ US | 1 982 900 000 $ US |
| 1991 | 7 507 000 000 $ US | 1 593 000 000 $ US |
| 1990 | 7 079 000 000 $ US | 1 600 000 000 $ US |
| 1989 | 6 031 000 000 $ US | 1 291 000 000 $ US |
| 1988 | 5 343 000 000 $ US | 1 408 000 000 $ US |
| 1987 | 5 661 000 000 $ US | 1 166 000 000 $ US |
| 1986 | 5 331 000 000 $ US | 1 108 000 000 $ US |
| 1985 | 3 650 000 000 $ US | 855 000 000 $ US |
| 1984 | 4 273 000 000 $ US | 927 000 000 $ US |
| 1983 | 2 970 000 000 $ US | 844 000 000 $ US |
| 1982 | 3 113 768 170 $ US | 1 335 097 740 $ US |
| 1981 | 3 157 725 680 $ US | 1 148 369 480 $ US |
| 1980 | 3 986 297 060 $ US | 1 341 992 780 $ US |
| 1979 | 3 441 000 000 $ US | 1 104 980 000 $ US |
| 1978 | 3 155 392 000 $ US | 779 628 000 $ US |
| 1977 | 2 660 000 000 $ US | 729 950 240 $ US |
| 1976 | 2 201 906 800 $ US | 567 778 560 $ US |
| 1975 | 1 683 186 550 $ US | 431 195 150 $ US |
| 1974 | 1 494 502 640 $ US | 365 602 560 $ US |
| 1973 | 1 262 548 990 $ US | 281 342 680 $ US |
| 1972 | 978 567 700 $ US | 225 827 680 $ US |
| 1971 | 754 166 460 $ US | 217 646 660 $ US |
| 1970 | 788 000 000 $ US | 192 000 000 $ US |
| 1969 | 672 000 000 $ US | 178 000 000 $ US |
| 1968 | 605 000 000 $ US | 158 000 000 $ US |
En 2025, les exportations de biens de la Colombie s'élevaient à 51,5 milliards de dollars et celles de services à 20 milliards de dollars ; les services représentaient 27,9 % du total, contre 20,7 % en 1968.
La Colombie dans le classement mondial des exportations, 2025







Exportations de biens et services de la Colombie, % du PIB, 1960–2025
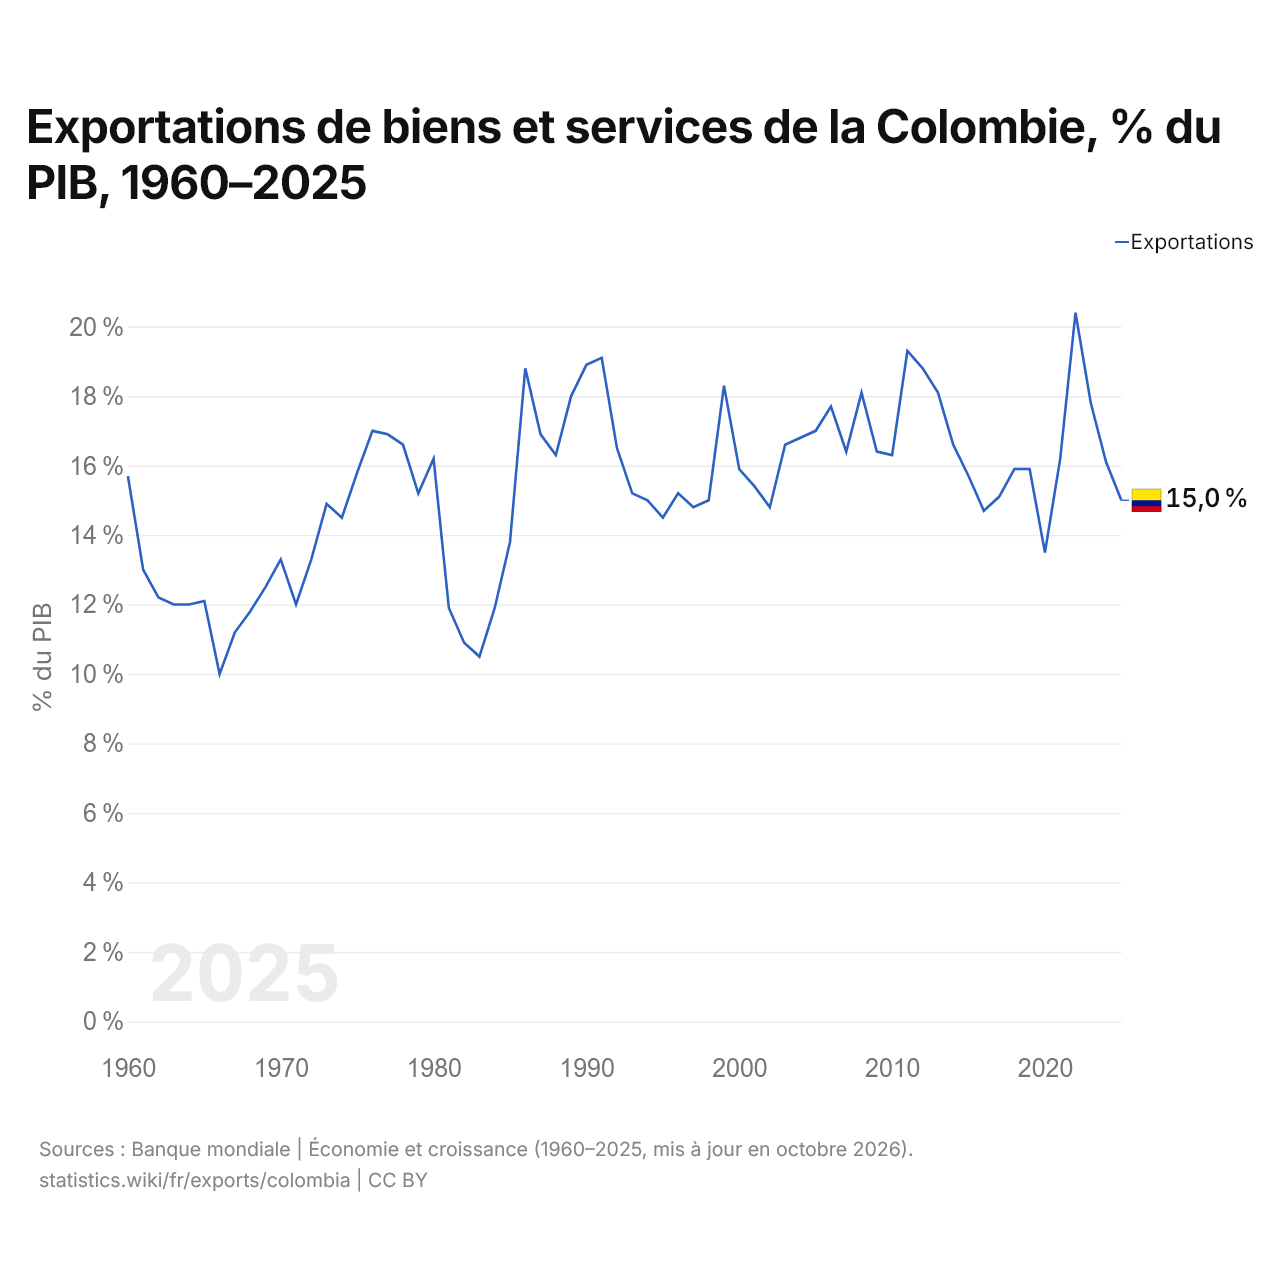
En 2025, les exportations de biens et services de la Colombie équivalaient à 15,0 % de son PIB, contre 15,7 % en 1960. La part la plus élevée a été de 20,4 %, en 2022.
Comparer les exportations de la Colombie avec celles d'autres pays
Sources :
- Banque mondiale | Économie et croissance (1960–2025, mis à jour en octobre 2026)
- TradeMap (2001–2025, mis à jour en octobre 2026)
Creative Commons Attribution (CC BY) : vous pouvez copier, partager, adapter et réutiliser ce contenu, y compris à des fins commerciales, à condition de citer statistics.wiki et d’indiquer les modifications apportées. Les sources citées ci-dessus peuvent avoir leurs propres conditions de licence.