
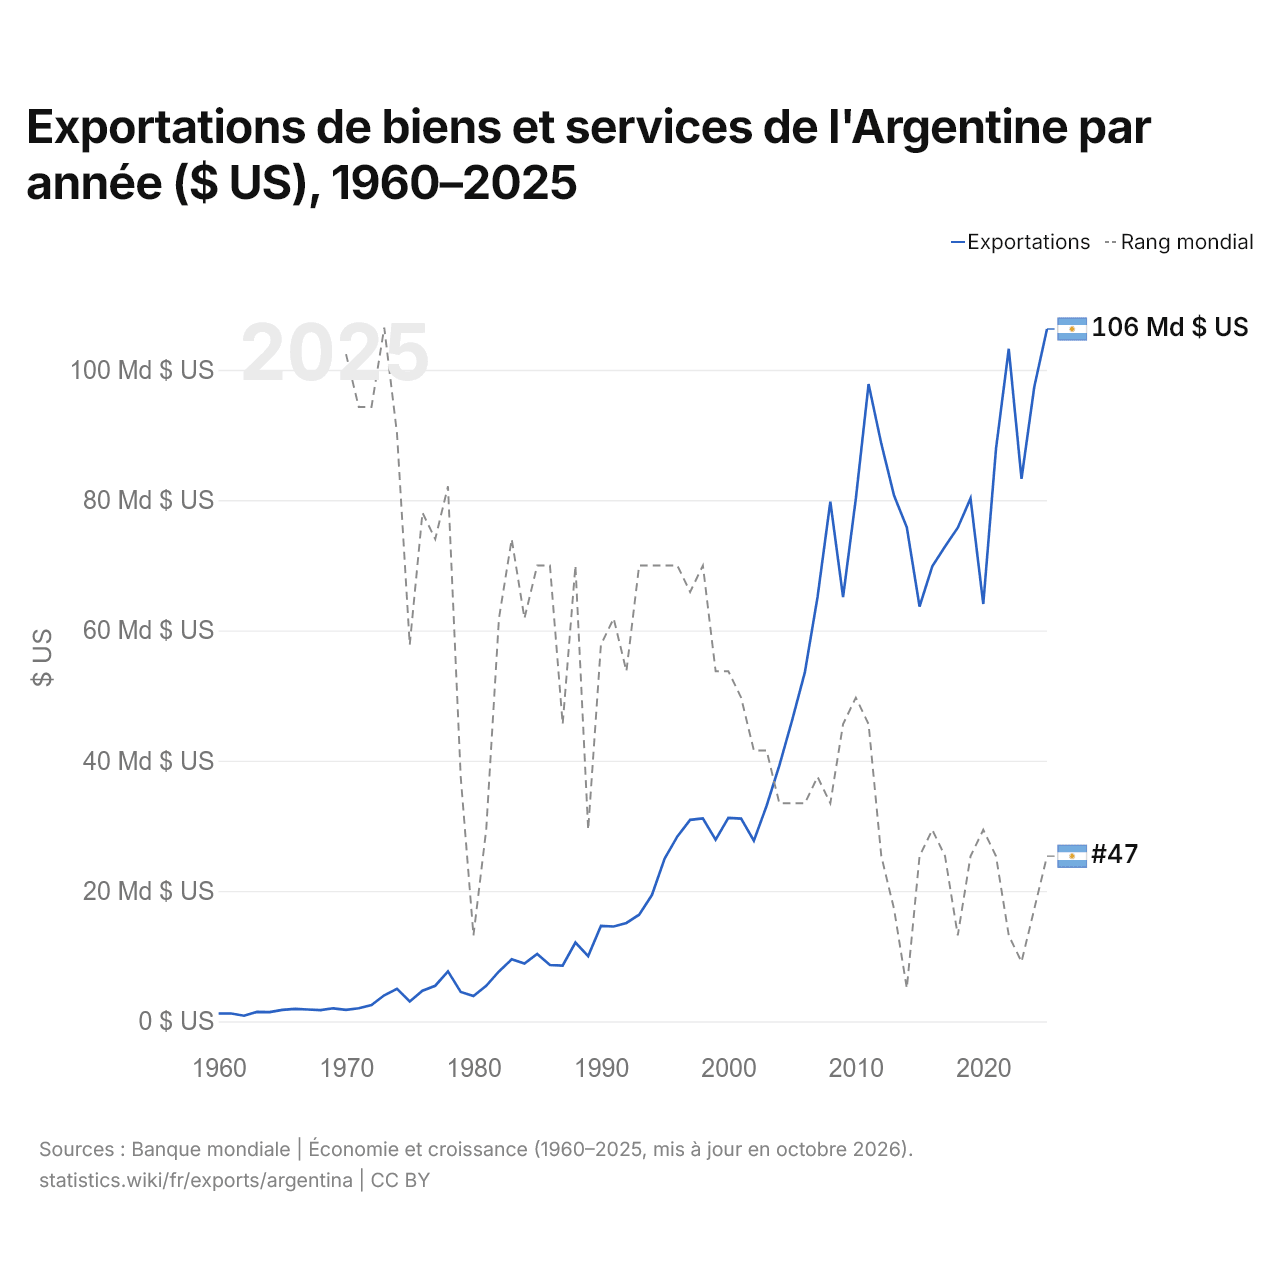
Exportations de biens et services de l'Argentine par année ($ US), 1960–2025
| Année | $ US | Rang mondial |
|---|---|---|
| Exportations | Rang mondial | |
| 2025 | 106 260 393 151 $ US | #47 |
| 2024 | 97 349 127 043 $ US | #49 |
| 2023 | 83 276 004 575 $ US | #51 |
| 2022 | 103 224 756 800 $ US | #50 |
| 2021 | 87 906 118 245 $ US | #47 |
| 2020 | 64 053 810 078 $ US | #46 |
| 2019 | 80 259 482 469 $ US | #47 |
| 2018 | 75 766 598 613 $ US | #50 |
| 2017 | 72 860 557 903 $ US | #47 |
| 2016 | 69 842 604 407 $ US | #46 |
| 2015 | 63 671 789 069 $ US | #47 |
| 2014 | 75 818 867 911 $ US | #52 |
| 2013 | 80 690 471 898 $ US | #49 |
| 2012 | 88 655 850 854 $ US | #47 |
| 2011 | 97 809 980 731 $ US | #42 |
| 2010 | 80 208 867 996 $ US | #41 |
| 2009 | 65 133 480 388 $ US | #42 |
| 2008 | 79 762 958 392 $ US | #45 |
| 2007 | 65 162 321 195 $ US | #44 |
| 2006 | 53 550 250 227 $ US | #45 |
| 2005 | 46 198 180 131 $ US | #45 |
| 2004 | 39 266 996 606 $ US | #45 |
| 2003 | 33 084 505 278 $ US | #43 |
| 2002 | 27 736 610 298 $ US | #43 |
| 2001 | 31 112 418 400 $ US | #41 |
| 2000 | 31 223 690 400 $ US | #40 |
| 1999 | 27 862 300 000 $ US | #40 |
| 1998 | 31 137 200 000 $ US | #36 |
| 1997 | 30 928 400 000 $ US | #37 |
| 1996 | 28 381 400 000 $ US | #36 |
| 1995 | 24 978 532 000 $ US | #36 |
| 1994 | 19 385 100 000 $ US | #36 |
| 1993 | 16 357 317 317 $ US | #36 |
| 1992 | 15 095 261 860 $ US | #40 |
| 1991 | 14 561 091 033 $ US | #38 |
| 1990 | 14 643 479 947 $ US | #39 |
| 1989 | 10 006 623 327 $ US | #46 |
| 1988 | 12 094 686 105 $ US | #36 |
| 1987 | 8 566 904 947 $ US | #42 |
| 1986 | 8 641 279 278 $ US | #36 |
| 1985 | 10 345 475 059 $ US | #36 |
| 1984 | 8 873 730 059 $ US | #38 |
| 1983 | 9 515 669 467 $ US | #35 |
| 1982 | 7 663 966 256 $ US | #38 |
| 1981 | 5 445 263 190 $ US | #46 |
| 1980 | 3 895 791 555 $ US | #50 |
| 1979 | 4 508 960 597 $ US | #44 |
| 1978 | 7 665 724 160 $ US | #33 |
| 1977 | 5 459 999 881 $ US | #35 |
| 1976 | 4 695 000 304 $ US | #34 |
| 1975 | 3 054 054 017 $ US | #39 |
| 1974 | 4 999 999 840 $ US | #31 |
| 1973 | 4 000 000 136 $ US | #27 |
| 1972 | 2 500 000 047 $ US | #30 |
| 1971 | 2 000 000 003 $ US | #30 |
| 1970 | 1 769 210 603 $ US | #28 |
| 1969 | 2 000 000 041 $ US | - |
| 1968 | 1 714 285 705 $ US | - |
| 1967 | 1 818 181 858 $ US | - |
| 1966 | 1 904 761 830 $ US | - |
| 1965 | 1 764 705 803 $ US | - |
| 1964 | 1 424 603 255 $ US | - |
| 1963 | 1 441 753 550 $ US | - |
| 1962 | 860 375 634 $ US | - |
| 1961 | 1 206 915 940 $ US | - |
| 1960 | 1 206 418 458 $ US | - |
En 2025, les exportations de biens et services de l'Argentine s'élevaient à 106 milliards de dollars, contre 1,21 milliard de dollars en 1960. Le minimum a été de 860 millions de dollars, en 1962. Elles se classaient au 47e rang mondial, en hausse par rapport au 49e rang en 2024. Leur meilleur rang a été le 27e, occupé pour la dernière fois en 1973.
En 2025, les exportations de biens et services de l'Argentine étaient les 4es plus élevées de 27 pays situés en Amérique latine. Les importations de biens et services de l'Argentine s'élevaient à 101 milliards de dollars en 2025, au 49e rang mondial. En 2025, les exportations de l'Argentine dépassaient ses importations de 5,1 milliards de dollars, soit un excédent commercial.
Exportations de biens de l'Argentine par catégorie, 2025
Exportations de biens, 2025: 87,1 Md $US
En 2025, la première catégorie des exportations de biens de l'Argentine était « aliments transformés, huiles, aliments pour animaux, boissons et tabac », avec 25,6 %, suivie de « cultures, plantes et fleurs (céréales, fruits, légumes, café, oléagineux) », avec 22,4 %.
Destinations des exportations de biens de l'Argentine : les 10 premières, 2025
| Rang | Pays | Exportations de biens | Part | |
|---|---|---|---|---|
| 1 |
 Brésil |
12,8 Md $US | 14,7 % | vs Brésil |
| 2 |
 Chine |
9,71 Md $US | 11,1 % | vs Chine |
| 3 |
 États-Unis |
8,34 Md $US | 9,58 % | vs USA |
| 4 |
 Chili |
6,28 Md $US | 7,21 % | vs Chili |
| 5 |
 Inde |
5,47 Md $US | 6,28 % | vs Inde |
| 6 |
 Vietnam |
2,73 Md $US | 3,14 % | |
| 7 |
 Pérou |
2,55 Md $US | 2,93 % | vs Pérou |
| 8 |
 Pays-Bas |
2,07 Md $US | 2,38 % | |
| 9 |
 Suisse |
2,06 Md $US | 2,37 % | vs Suisse |
| 10 |
 Uruguay |
1,91 Md $US | 2,2 % | vs Uruguay |
| Autres partenaires et non précisés | 33,2 Md $US | 38,1 % |
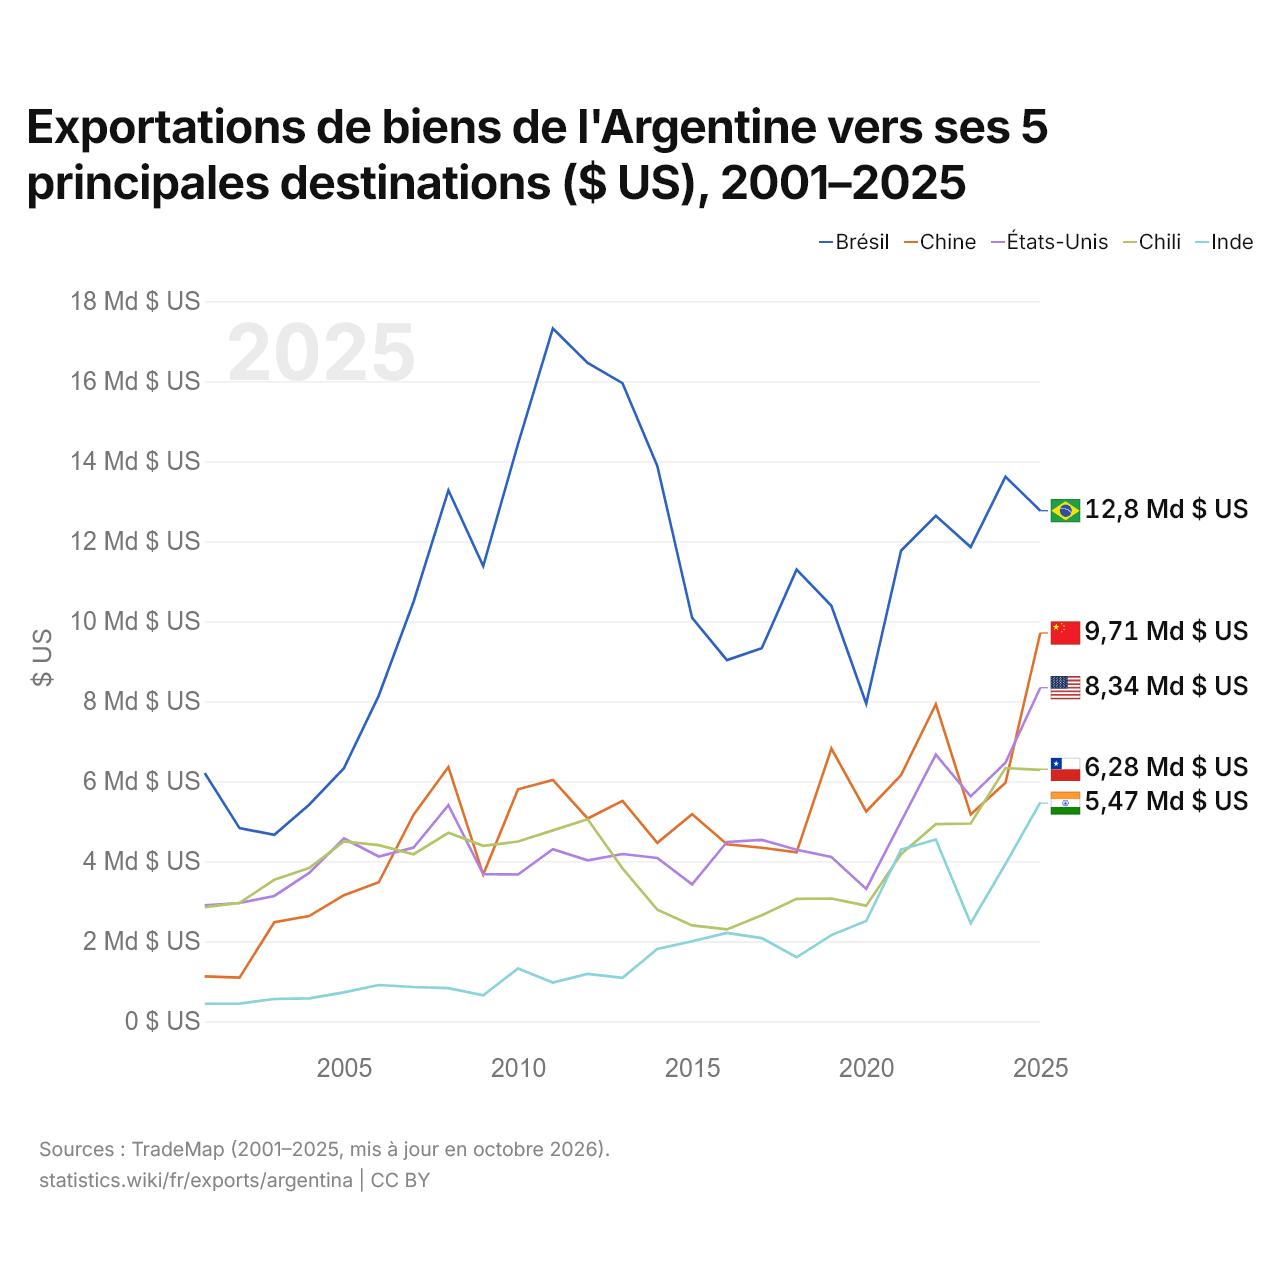
Exportations de biens de l'Argentine vers ses 5 principales destinations ($ US), 2001–2025
| Année | $ US | ||||
|---|---|---|---|---|---|
| Brésil | Chine | États-Unis | Chili | Inde | |
| 2025 | 12 760 949 000 $ US | 9 706 247 000 $ US | 8 337 648 000 $ US | 6 282 459 000 $ US | 5 471 506 000 $ US |
| 2024 | 13 610 525 000 $ US | 5 964 592 000 $ US | 6 464 129 000 $ US | 6 330 312 000 $ US | 3 933 406 000 $ US |
| 2023 | 11 853 729 000 $ US | 5 169 052 000 $ US | 5 621 311 000 $ US | 4 945 036 000 $ US | 2 450 284 000 $ US |
| 2022 | 12 633 621 000 $ US | 7 924 382 000 $ US | 6 666 120 000 $ US | 4 929 082 000 $ US | 4 542 232 000 $ US |
| 2021 | 11 761 549 000 $ US | 6 154 212 000 $ US | 4 991 829 000 $ US | 4 176 196 000 $ US | 4 293 273 000 $ US |
| 2020 | 7 941 610 000 $ US | 5 244 394 000 $ US | 3 309 515 000 $ US | 2 890 384 000 $ US | 2 507 528 000 $ US |
| 2019 | 10 385 573 000 $ US | 6 817 853 000 $ US | 4 109 532 000 $ US | 3 070 778 000 $ US | 2 155 535 000 $ US |
| 2018 | 11 288 420 000 $ US | 4 223 854 000 $ US | 4 286 739 000 $ US | 3 060 325 000 $ US | 1 600 879 000 $ US |
| 2017 | 9 326 004 000 $ US | 4 338 719 000 $ US | 4 535 038 000 $ US | 2 650 077 000 $ US | 2 081 099 000 $ US |
| 2016 | 9 027 619 000 $ US | 4 425 230 000 $ US | 4 482 604 000 $ US | 2 297 397 000 $ US | 2 208 521 000 $ US |
| 2015 | 10 081 115 000 $ US | 5 174 432 000 $ US | 3 422 832 000 $ US | 2 398 278 000 $ US | 2 003 132 000 $ US |
| 2014 | 13 882 695 000 $ US | 4 459 978 000 $ US | 4 081 824 000 $ US | 2 792 208 000 $ US | 1 810 469 000 $ US |
| 2013 | 15 948 973 000 $ US | 5 511 588 000 $ US | 4 182 358 000 $ US | 3 823 118 000 $ US | 1 089 096 000 $ US |
| 2012 | 16 456 672 000 $ US | 5 068 296 000 $ US | 4 023 111 000 $ US | 5 051 834 000 $ US | 1 186 810 000 $ US |
| 2011 | 17 317 105 000 $ US | 6 033 117 000 $ US | 4 301 136 000 $ US | 4 772 318 000 $ US | 968 773 000 $ US |
| 2010 | 14 432 985 000 $ US | 5 798 858 000 $ US | 3 668 828 000 $ US | 4 493 083 000 $ US | 1 321 491 000 $ US |
| 2009 | 11 379 426 000 $ US | 3 666 461 000 $ US | 3 680 361 000 $ US | 4 386 659 000 $ US | 648 331 000 $ US |
| 2008 | 13 273 283 000 $ US | 6 354 957 000 $ US | 5 401 769 000 $ US | 4 713 567 000 $ US | 829 749 000 $ US |
| 2007 | 10 486 056 000 $ US | 5 166 609 000 $ US | 4 344 407 000 $ US | 4 176 201 000 $ US | 858 817 000 $ US |
| 2006 | 8 140 972 000 $ US | 3 475 853 000 $ US | 4 119 115 000 $ US | 4 404 623 000 $ US | 908 613 000 $ US |
| 2005 | 6 328 294 000 $ US | 3 154 289 000 $ US | 4 570 411 000 $ US | 4 497 161 000 $ US | 723 060 000 $ US |
| 2004 | 5 411 830 000 $ US | 2 630 447 000 $ US | 3 707 822 000 $ US | 3 830 577 000 $ US | 575 407 000 $ US |
| 2003 | 4 663 289 000 $ US | 2 478 423 000 $ US | 3 133 533 000 $ US | 3 536 326 000 $ US | 558 477 000 $ US |
| 2002 | 4 827 791 000 $ US | 1 092 354 000 $ US | 2 957 202 000 $ US | 2 961 084 000 $ US | 442 781 000 $ US |
| 2001 | 6 205 630 000 $ US | 1 122 612 000 $ US | 2 900 129 000 $ US | 2 851 693 000 $ US | 440 437 000 $ US |
En 2025, les exportations de biens s'élevaient à 12,8 milliards de dollars vers le Brésil, 9,71 milliards de dollars vers la Chine, 8,34 milliards de dollars vers les États-Unis, 6,28 milliards de dollars vers le Chili et 5,47 milliards de dollars vers l'Inde. Le premier rang des cinq destinations de l'Argentine est occupé par le Brésil chaque année depuis 2001. Le changement le plus récent dans leur ordre remonte à 2025, quand les exportations de l'Argentine vers la Chine ont dépassé celles vers les États-Unis.
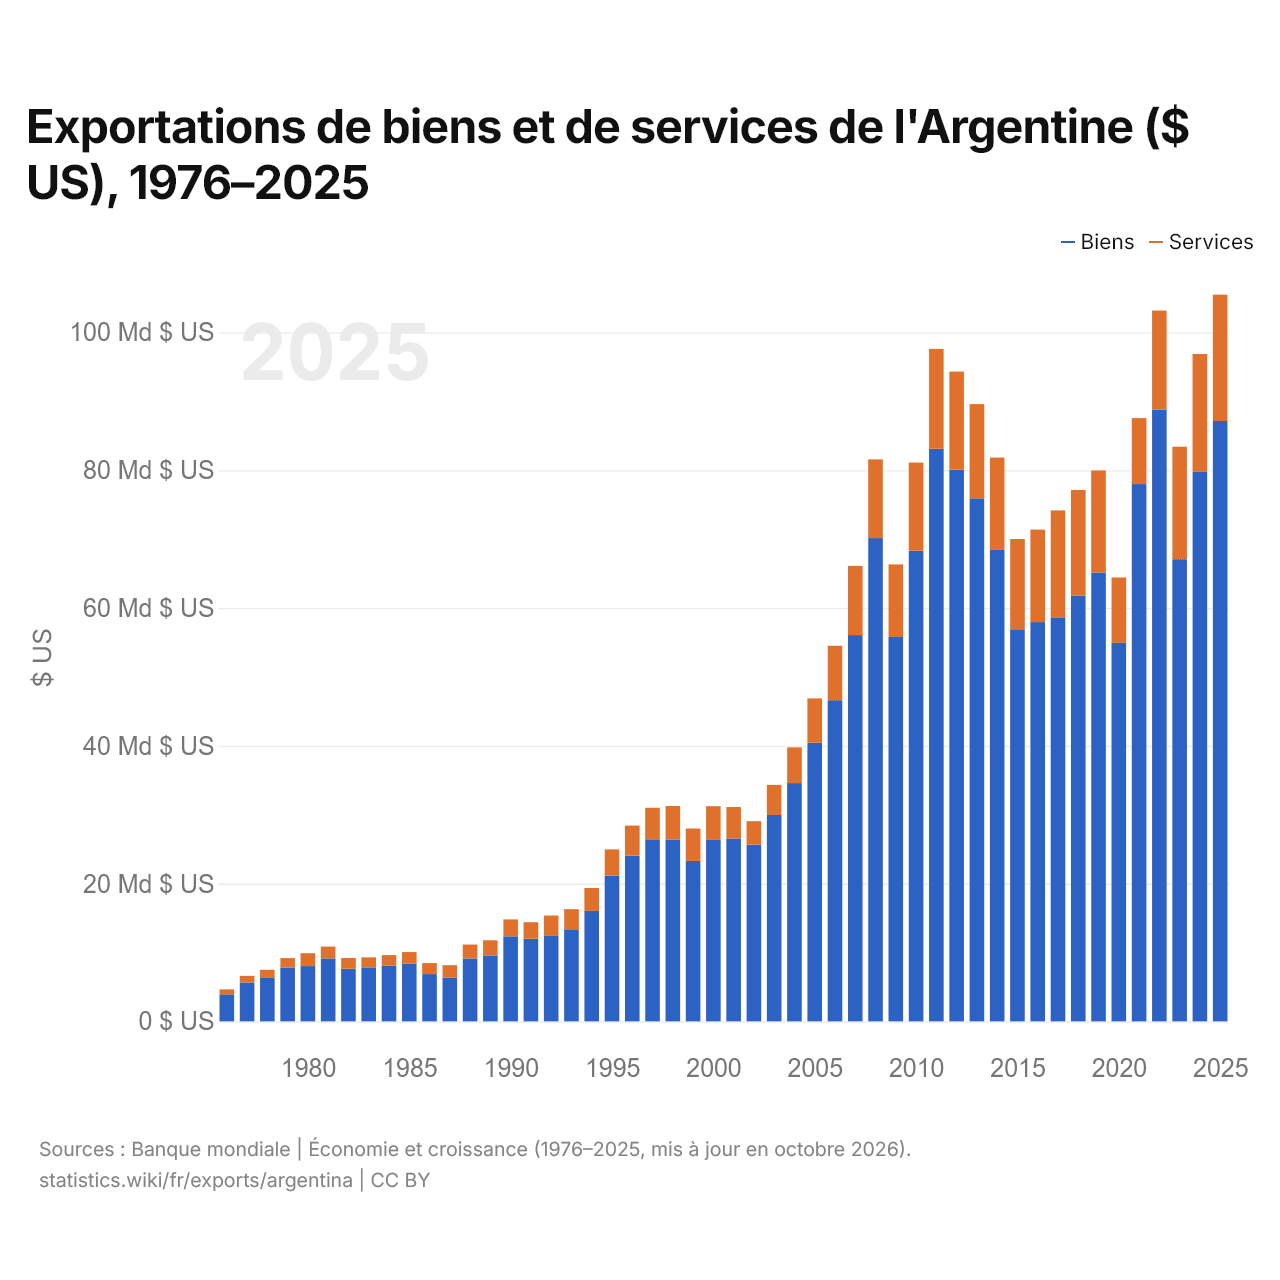
Exportations de biens et de services de l'Argentine ($ US), 1976–2025
| Année | $ US | |
|---|---|---|
| Biens | Services | |
| 2025 | 87 151 683 205 $ US | 18 340 857 334 $ US |
| 2024 | 79 759 551 325 $ US | 17 115 602 905 $ US |
| 2023 | 67 091 630 695 $ US | 16 320 477 467 $ US |
| 2022 | 88 771 178 542 $ US | 14 415 863 622 $ US |
| 2021 | 77 986 576 165 $ US | 9 588 735 678 $ US |
| 2020 | 54 945 509 699 $ US | 9 491 737 607 $ US |
| 2019 | 65 162 061 725 $ US | 14 802 420 805 $ US |
| 2018 | 61 801 002 638 $ US | 15 342 163 178 $ US |
| 2017 | 58 661 873 552 $ US | 15 506 201 962 $ US |
| 2016 | 57 959 933 691 $ US | 13 424 706 884 $ US |
| 2015 | 56 809 053 493 $ US | 13 213 512 350 $ US |
| 2014 | 68 440 435 907 $ US | 13 396 371 828 $ US |
| 2013 | 75 928 228 361 $ US | 13 679 891 768 $ US |
| 2012 | 80 083 655 000 $ US | 14 247 100 730 $ US |
| 2011 | 83 119 709 000 $ US | 14 496 981 275 $ US |
| 2010 | 68 305 873 000 $ US | 12 817 143 361 $ US |
| 2009 | 55 790 984 000 $ US | 10 544 621 324 $ US |
| 2008 | 70 159 472 000 $ US | 11 424 149 072 $ US |
| 2007 | 56 076 562 000 $ US | 10 045 736 496 $ US |
| 2006 | 46 617 500 000 $ US | 7 911 015 093 $ US |
| 2005 | 40 434 150 000 $ US | 6 458 060 000 $ US |
| 2004 | 34 588 800 000 $ US | 5 168 450 000 $ US |
| 2003 | 29 950 400 000 $ US | 4 385 610 000 $ US |
| 2002 | 25 634 300 000 $ US | 3 420 200 000 $ US |
| 2001 | 26 528 000 000 $ US | 4 588 753 077 $ US |
| 2000 | 26 337 200 000 $ US | 4 899 720 315 $ US |
| 1999 | 23 287 800 000 $ US | 4 709 518 725 $ US |
| 1998 | 26 408 700 000 $ US | 4 847 269 563 $ US |
| 1997 | 26 420 900 000 $ US | 4 582 871 471 $ US |
| 1996 | 24 034 600 000 $ US | 4 390 154 642 $ US |
| 1995 | 21 141 832 000 $ US | 3 814 600 000 $ US |
| 1994 | 16 026 700 000 $ US | 3 329 000 000 $ US |
| 1993 | 13 262 600 000 $ US | 3 023 560 000 $ US |
| 1992 | 12 397 400 000 $ US | 2 968 800 000 $ US |
| 1991 | 11 978 000 000 $ US | 2 408 000 000 $ US |
| 1990 | 12 354 000 000 $ US | 2 446 000 000 $ US |
| 1989 | 9 573 000 000 $ US | 2 193 000 000 $ US |
| 1988 | 9 134 000 000 $ US | 2 015 000 000 $ US |
| 1987 | 6 360 000 000 $ US | 1 794 000 000 $ US |
| 1986 | 6 852 000 000 $ US | 1 597 000 000 $ US |
| 1985 | 8 396 000 000 $ US | 1 651 000 000 $ US |
| 1984 | 8 100 000 000 $ US | 1 511 000 000 $ US |
| 1983 | 7 835 000 000 $ US | 1 455 000 000 $ US |
| 1982 | 7 623 000 000 $ US | 1 574 000 000 $ US |
| 1981 | 9 143 000 000 $ US | 1 716 000 000 $ US |
| 1980 | 8 021 000 000 $ US | 1 876 000 000 $ US |
| 1979 | 7 810 000 000 $ US | 1 369 000 000 $ US |
| 1978 | 6 401 000 000 $ US | 1 087 000 000 $ US |
| 1977 | 5 651 000 000 $ US | 951 000 000 $ US |
| 1976 | 3 918 000 000 $ US | 714 000 000 $ US |
En 2025, les exportations de biens de l'Argentine s'élevaient à 87,2 milliards de dollars et celles de services à 18,3 milliards de dollars ; les services représentaient 17,4 % du total, contre 15,4 % en 1976.
L'Argentine dans le classement mondial des exportations, 2025





Exportations de biens et services de l'Argentine, % du PIB, 1960–2025
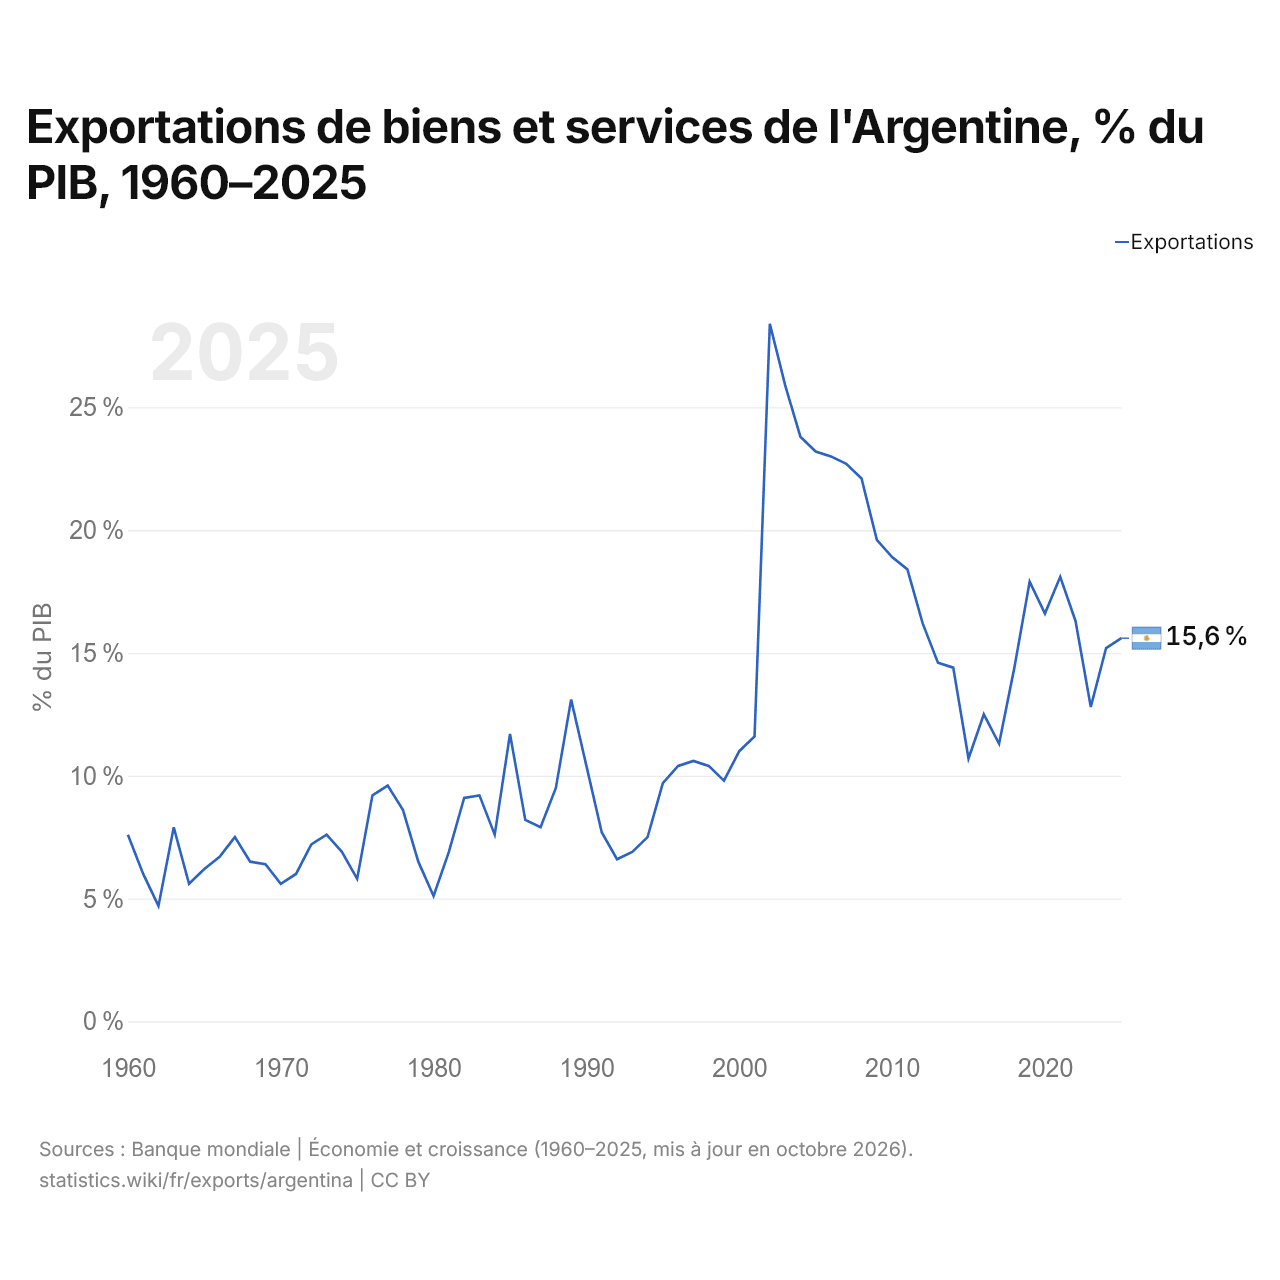
En 2025, les exportations de biens et services de l'Argentine équivalaient à 15,6 % de son PIB, contre 7,6 % en 1960. La part la plus élevée a été de 28,4 %, en 2002.
Comparer les exportations de l'Argentine avec celles d'autres pays
Sources :
- Banque mondiale | Économie et croissance (1960–2025, mis à jour en octobre 2026)
- TradeMap (2001–2025, mis à jour en octobre 2026)
Creative Commons Attribution (CC BY) : vous pouvez copier, partager, adapter et réutiliser ce contenu, y compris à des fins commerciales, à condition de citer statistics.wiki et d’indiquer les modifications apportées. Les sources citées ci-dessus peuvent avoir leurs propres conditions de licence.