
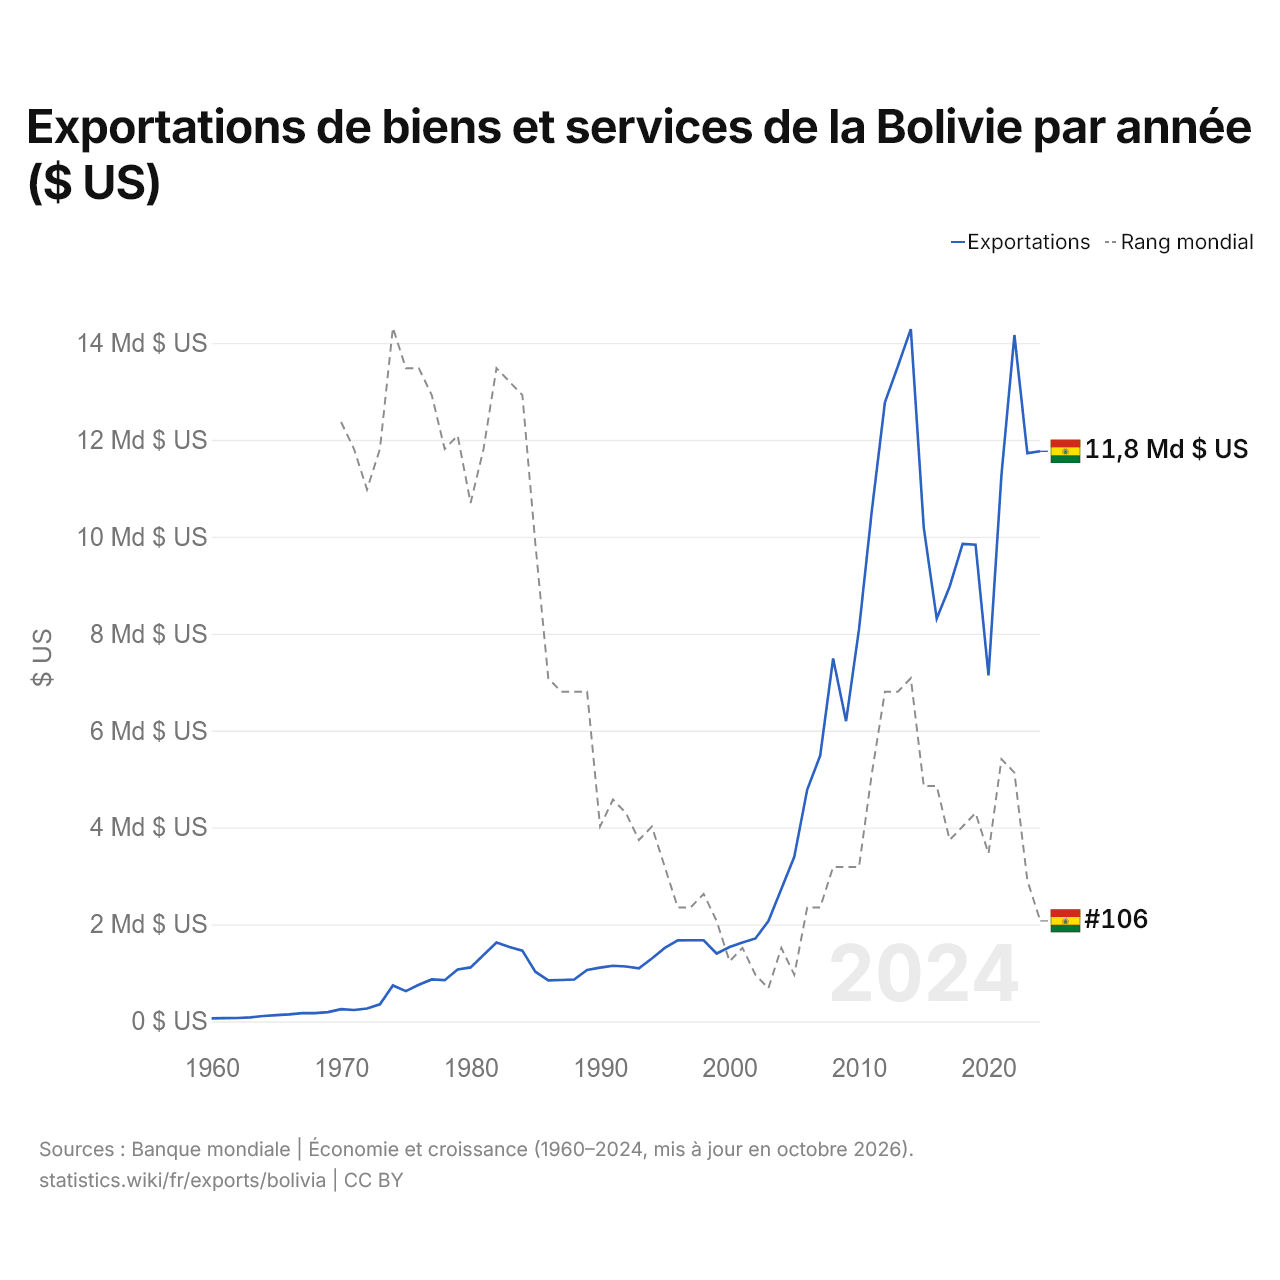
Exportations de biens et services de la Bolivie par année ($ US)
| Année | $ US | Rang mondial |
|---|---|---|
| Exportations | Rang mondial | |
| 2024 | 11 763 846 802 $ US | #106 |
| 2023 | 11 725 676 874 $ US | #103 |
| 2022 | 14 163 562 909 $ US | #95 |
| 2021 | 11 276 448 090 $ US | #94 |
| 2020 | 7 139 077 207 $ US | #101 |
| 2019 | 9 834 601 158 $ US | #98 |
| 2018 | 9 854 706 136 $ US | #99 |
| 2017 | 8 973 701 187 $ US | #100 |
| 2016 | 8 311 504 863 $ US | #96 |
| 2015 | 10 186 598 886 $ US | #96 |
| 2014 | 14 285 068 712 $ US | #88 |
| 2013 | 13 518 462 721 $ US | #89 |
| 2012 | 12 774 727 337 $ US | #89 |
| 2011 | 10 565 767 133 $ US | #95 |
| 2010 | 8 093 221 340 $ US | #102 |
| 2009 | 6 194 300 356 $ US | #102 |
| 2008 | 7 487 843 217 $ US | #102 |
| 2007 | 5 483 635 309 $ US | #105 |
| 2006 | 4 783 631 931 $ US | #105 |
| 2005 | 3 394 535 859 $ US | #110 |
| 2004 | 2 731 911 668 $ US | #108 |
| 2003 | 2 069 153 669 $ US | #111 |
| 2002 | 1 710 308 633 $ US | #110 |
| 2001 | 1 626 035 911 $ US | #108 |
| 2000 | 1 534 686 673 $ US | #109 |
| 1999 | 1 398 593 388 $ US | #106 |
| 1998 | 1 673 894 695 $ US | #104 |
| 1997 | 1 673 170 826 $ US | #105 |
| 1996 | 1 670 369 478 $ US | #105 |
| 1995 | 1 514 364 435 $ US | #102 |
| 1994 | 1 295 730 954 $ US | #99 |
| 1993 | 1 094 224 544 $ US | #100 |
| 1992 | 1 131 356 484 $ US | #98 |
| 1991 | 1 147 697 877 $ US | #97 |
| 1990 | 1 108 688 419 $ US | #99 |
| 1989 | 1 061 009 896 $ US | #89 |
| 1988 | 862 854 458 $ US | #89 |
| 1987 | 853 524 498 $ US | #89 |
| 1986 | 844 299 281 $ US | #88 |
| 1985 | 1 024 367 606 $ US | #78 |
| 1984 | 1 459 382 832 $ US | #67 |
| 1983 | 1 535 522 169 $ US | #66 |
| 1982 | 1 625 898 083 $ US | #65 |
| 1981 | 1 370 758 564 $ US | #71 |
| 1980 | 1 112 928 222 $ US | #75 |
| 1979 | 1 068 844 960 $ US | #70 |
| 1978 | 849 175 412 $ US | #71 |
| 1977 | 864 117 941 $ US | #67 |
| 1976 | 756 121 939 $ US | #65 |
| 1975 | 623 738 131 $ US | #65 |
| 1974 | 741 229 385 $ US | #62 |
| 1973 | 350 024 988 $ US | #71 |
| 1972 | 265 513 351 $ US | #74 |
| 1971 | 234 343 434 $ US | #71 |
| 1970 | 250 168 350 $ US | #69 |
| 1969 | 189 814 815 $ US | - |
| 1968 | 169 696 970 $ US | - |
| 1967 | 170 033 670 $ US | - |
| 1966 | 142 255 892 $ US | - |
| 1965 | 129 713 805 $ US | - |
| 1964 | 110 437 710 $ US | - |
| 1963 | 81 986 532 $ US | - |
| 1962 | 67 929 293 $ US | - |
| 1961 | 67 255 892 $ US | - |
| 1960 | 61 111 111 $ US | - |
Les exportations de biens et services de la Bolivie s'élèvent à 11,8 milliards de dollars (2024), contre 61,1 millions de dollars en 1960. Le maximum a été de 14,3 milliards de dollars, en 2014. Elles se classent au 106e rang mondial, en baisse par rapport au 103e rang l'année précédente. Leur meilleur rang a été le 62e, occupé pour la dernière fois en 1974.
Les exportations de biens et services de la Bolivie sont les 17es plus élevées de 27 pays situés en Amérique latine (à égalité avec le Salvador, dont le chiffre le plus récent date de 2025). Les importations de biens et services de la Bolivie s'élèvent à 14 milliards de dollars (2024), au 108e rang mondial. Les importations de la Bolivie dépassent ses exportations de 2,25 milliards de dollars, soit un déficit commercial (2024).
Exportations de biens de la Bolivie par catégorie, 2025
Exportations de biens, 2025: 9,70 Md $US
En 2025, la première catégorie des exportations de biens de la Bolivie était « pétrole, gaz, minerais et autres matières premières », avec 52,7 %, suivie de « métaux précieux, pierres précieuses, bijoux, montres, instruments de musique et art », avec 17,3 %.
Destinations des exportations de biens de la Bolivie : les 10 premières, 2025
| Rang | Pays | Exportations de biens | Part | |
|---|---|---|---|---|
| 1 |
 Chine |
1,85 Md $US | 19,1 % | |
| 2 |
 Brésil |
1,24 Md $US | 12,8 % | |
| 3 |
 Inde |
823 M $US | 8,49 % | |
| 4 |
 Japon |
740 M $US | 7,63 % | |
| 5 |
 Pérou |
585 M $US | 6,04 % | |
| 6 |
 Colombie |
577 M $US | 5,95 % | |
| 7 |
 États-Unis |
421 M $US | 4,34 % | |
| 8 |
 Corée du Sud |
404 M $US | 4,16 % | |
| 9 |
 Belgique |
399 M $US | 4,12 % | |
| 10 |
 EAU |
352 M $US | 3,63 % | |
| Autres partenaires et non précisés | 2,30 Md $US | 23,7 % |
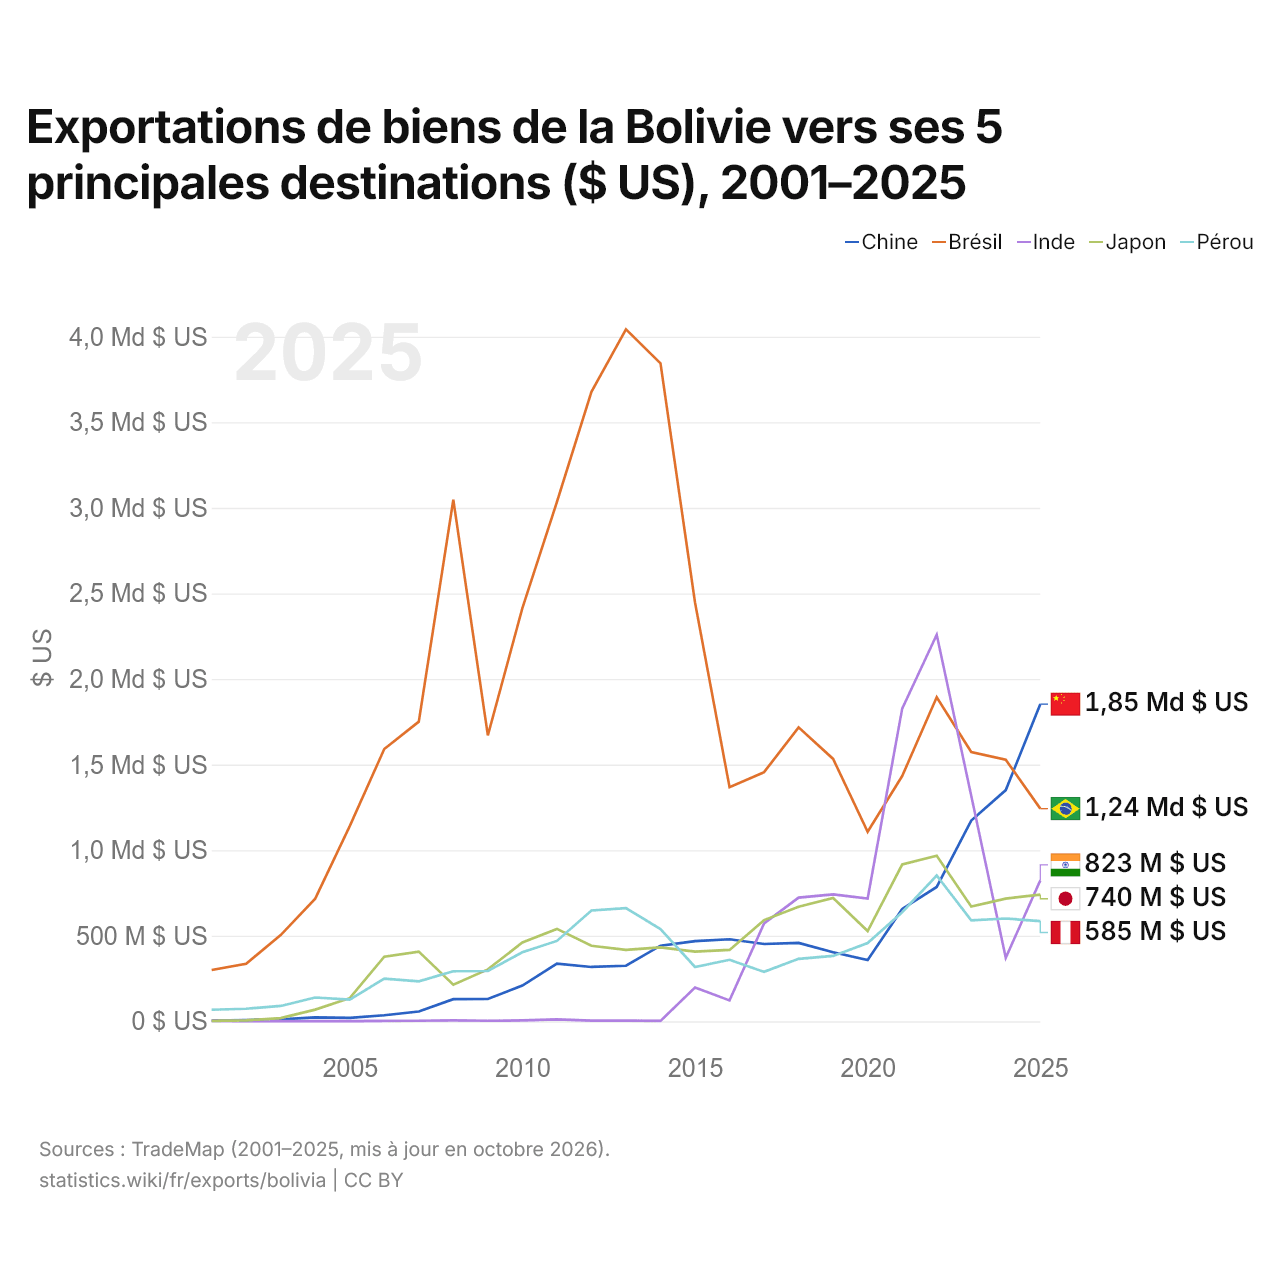
Exportations de biens de la Bolivie vers ses 5 principales destinations ($ US), 2001–2025
| Année | $ US | ||||
|---|---|---|---|---|---|
| Chine | Brésil | Inde | Japon | Pérou | |
| 2025 | 1 853 272 000 $ US | 1 242 629 000 $ US | 823 210 000 $ US | 740 497 000 $ US | 585 472 000 $ US |
| 2024 | 1 350 791 000 $ US | 1 528 032 000 $ US | 370 991 000 $ US | 716 984 000 $ US | 600 610 000 $ US |
| 2023 | 1 173 009 000 $ US | 1 573 434 000 $ US | 1 317 570 000 $ US | 671 264 000 $ US | 589 433 000 $ US |
| 2022 | 785 082 000 $ US | 1 893 716 000 $ US | 2 258 756 000 $ US | 967 003 000 $ US | 852 054 000 $ US |
| 2021 | 657 003 000 $ US | 1 433 199 000 $ US | 1 827 035 000 $ US | 916 097 000 $ US | 637 521 000 $ US |
| 2020 | 358 398 000 $ US | 1 107 610 000 $ US | 717 576 000 $ US | 527 390 000 $ US | 457 054 000 $ US |
| 2019 | 403 561 000 $ US | 1 533 261 000 $ US | 742 029 000 $ US | 720 930 000 $ US | 382 325 000 $ US |
| 2018 | 457 965 000 $ US | 1 717 589 000 $ US | 722 866 000 $ US | 669 557 000 $ US | 365 231 000 $ US |
| 2017 | 451 869 000 $ US | 1 455 672 000 $ US | 571 934 000 $ US | 591 350 000 $ US | 289 091 000 $ US |
| 2016 | 479 705 000 $ US | 1 367 693 000 $ US | 122 244 000 $ US | 417 296 000 $ US | 359 547 000 $ US |
| 2015 | 468 249 000 $ US | 2 447 485 000 $ US | 197 093 000 $ US | 407 223 000 $ US | 317 613 000 $ US |
| 2014 | 441 837 000 $ US | 3 844 108 000 $ US | 2 483 000 $ US | 432 335 000 $ US | 538 465 000 $ US |
| 2013 | 324 730 000 $ US | 4 043 249 000 $ US | 3 930 000 $ US | 417 721 000 $ US | 660 918 000 $ US |
| 2012 | 317 694 000 $ US | 3 678 152 000 $ US | 4 030 000 $ US | 441 840 000 $ US | 647 544 000 $ US |
| 2011 | 336 850 000 $ US | 3 034 053 000 $ US | 11 383 000 $ US | 540 026 000 $ US | 469 911 000 $ US |
| 2010 | 208 742 000 $ US | 2 413 681 000 $ US | 5 367 000 $ US | 460 298 000 $ US | 403 043 000 $ US |
| 2009 | 130 642 000 $ US | 1 670 795 000 $ US | 3 200 000 $ US | 303 543 000 $ US | 294 123 000 $ US |
| 2008 | 129 480 000 $ US | 3 047 525 000 $ US | 5 225 000 $ US | 214 374 000 $ US | 292 646 000 $ US |
| 2007 | 57 649 000 $ US | 1 750 715 000 $ US | 3 231 000 $ US | 407 198 000 $ US | 233 716 000 $ US |
| 2006 | 35 570 000 $ US | 1 590 979 000 $ US | 2 568 000 $ US | 377 962 000 $ US | 249 481 000 $ US |
| 2005 | 20 565 000 $ US | 1 140 274 000 $ US | 1 041 000 $ US | 135 140 000 $ US | 126 977 000 $ US |
| 2004 | 23 499 000 $ US | 716 396 000 $ US | 1 484 000 $ US | 68 404 000 $ US | 139 205 000 $ US |
| 2003 | 11 548 000 $ US | 503 969 000 $ US | 1 556 000 $ US | 18 579 000 $ US | 89 923 000 $ US |
| 2002 | 7 716 000 $ US | 336 568 000 $ US | 1 028 000 $ US | 5 864 000 $ US | 73 752 000 $ US |
| 2001 | 5 070 000 $ US | 299 550 000 $ US | 3 044 000 $ US | 2 812 000 $ US | 67 517 000 $ US |
En 2025, les exportations de biens s'élevaient à 1,85 milliard de dollars vers la Chine, 1,24 milliard de dollars vers le Brésil, 823 millions de dollars vers l'Inde, 740 millions de dollars vers le Japon et 585 millions de dollars vers le Pérou. Le changement le plus récent dans leur ordre remonte à 2025, quand les exportations de la Bolivie vers la Chine ont dépassé celles vers le Brésil.
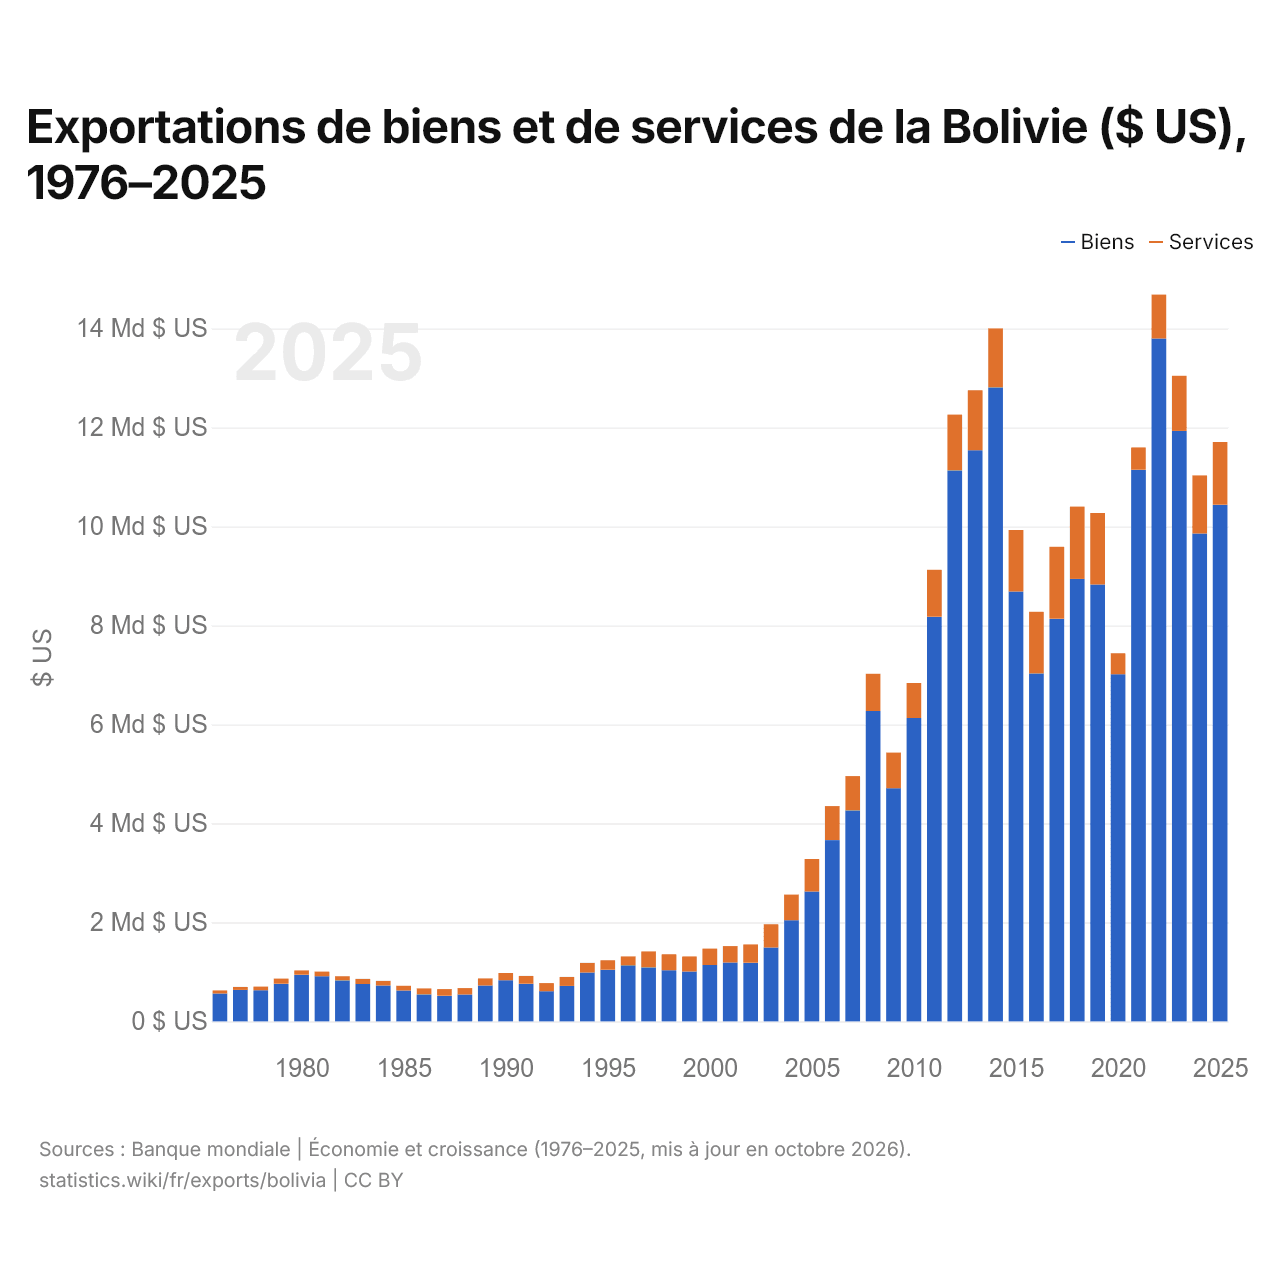
Exportations de biens et de services de la Bolivie ($ US), 1976–2025
| Année | $ US | |
|---|---|---|
| Biens | Services | |
| 2025 | 10 438 673 737 $ US | 1 268 050 451 $ US |
| 2024 | 9 858 576 101 $ US | 1 171 237 764 $ US |
| 2023 | 11 931 941 724 $ US | 1 111 040 406 $ US |
| 2022 | 13 794 787 928 $ US | 888 122 519 $ US |
| 2021 | 11 145 698 861 $ US | 449 143 893 $ US |
| 2020 | 7 013 096 617 $ US | 424 590 270 $ US |
| 2019 | 8 827 819 916 $ US | 1 443 285 123 $ US |
| 2018 | 8 940 200 489 $ US | 1 458 805 538 $ US |
| 2017 | 8 133 837 887 $ US | 1 454 951 846 $ US |
| 2016 | 7 029 946 630 $ US | 1 244 740 246 $ US |
| 2015 | 8 684 018 276 $ US | 1 243 394 801 $ US |
| 2014 | 12 809 705 325 $ US | 1 191 842 305 $ US |
| 2013 | 11 538 700 931 $ US | 1 213 954 466 $ US |
| 2012 | 11 132 827 855 $ US | 1 125 167 106 $ US |
| 2011 | 8 174 835 185 $ US | 948 038 342 $ US |
| 2010 | 6 129 300 487 $ US | 707 694 437 $ US |
| 2009 | 4 709 830 000 $ US | 720 130 000 $ US |
| 2008 | 6 271 446 254 $ US | 751 626 543 $ US |
| 2007 | 4 262 826 734 $ US | 691 908 733 $ US |
| 2006 | 3 661 955 401 $ US | 687 399 686 $ US |
| 2005 | 2 622 226 566 $ US | 657 166 440 $ US |
| 2004 | 2 044 256 551 $ US | 517 758 635 $ US |
| 2003 | 1 492 659 722 $ US | 468 545 314 $ US |
| 2002 | 1 184 341 416 $ US | 370 970 703 $ US |
| 2001 | 1 188 657 426 $ US | 332 040 844 $ US |
| 2000 | 1 139 092 096 $ US | 330 932 000 $ US |
| 1999 | 1 005 500 000 $ US | 305 100 000 $ US |
| 1998 | 1 032 000 000 $ US | 323 200 000 $ US |
| 1997 | 1 090 000 000 $ US | 323 840 000 $ US |
| 1996 | 1 131 990 000 $ US | 180 940 000 $ US |
| 1995 | 1 041 400 000 $ US | 192 400 000 $ US |
| 1994 | 985 100 000 $ US | 196 000 000 $ US |
| 1993 | 715 500 000 $ US | 181 400 000 $ US |
| 1992 | 608 400 000 $ US | 164 600 000 $ US |
| 1991 | 760 300 000 $ US | 157 000 000 $ US |
| 1990 | 830 800 000 $ US | 145 900 000 $ US |
| 1989 | 723 500 000 $ US | 143 300 000 $ US |
| 1988 | 542 500 000 $ US | 128 300 000 $ US |
| 1987 | 518 700 000 $ US | 131 500 000 $ US |
| 1986 | 545 500 000 $ US | 121 100 000 $ US |
| 1985 | 623 400 000 $ US | 96 500 000 $ US |
| 1984 | 724 500 000 $ US | 93 500 000 $ US |
| 1983 | 755 100 000 $ US | 103 000 000 $ US |
| 1982 | 827 700 000 $ US | 82 300 000 $ US |
| 1981 | 912 400 000 $ US | 93 000 000 $ US |
| 1980 | 942 200 000 $ US | 87 900 000 $ US |
| 1979 | 759 800 000 $ US | 105 200 000 $ US |
| 1978 | 627 300 000 $ US | 76 200 000 $ US |
| 1977 | 634 300 000 $ US | 60 800 000 $ US |
| 1976 | 563 000 000 $ US | 60 400 000 $ US |
En 2025, les exportations de biens de la Bolivie s'élevaient à 10,4 milliards de dollars et celles de services à 1,27 milliard de dollars ; les services représentaient 10,8 % du total, contre 9,7 % en 1976.
La Bolivie dans le classement mondial des exportations
| Rang | Pays | Exportations | Part mondiale | |
|---|---|---|---|---|
| 103 |
 Ouganda |
13,3 Md $US (2025) | 0,04 % | |
| 104 |
 Sénégal |
12,0 Md $US (2025) | 0,03 % | |
| 105 |
 Gabon |
11,9 Md $US (2025) | 0,03 % | |
| 106 |
 Bolivie |
11,8 Md $US | 0,04 % | |
| 107 |
 Salvador |
11,8 Md $US (2025) | 0,03 % | |
| 108 |
 Guinée |
11,7 Md $US (2025) | 0,03 % | |
| 109 |
 Macédoine du Nord |
11,4 Md $US (2025) | 0,03 % |
Exportations de biens et services de la Bolivie, % du PIB
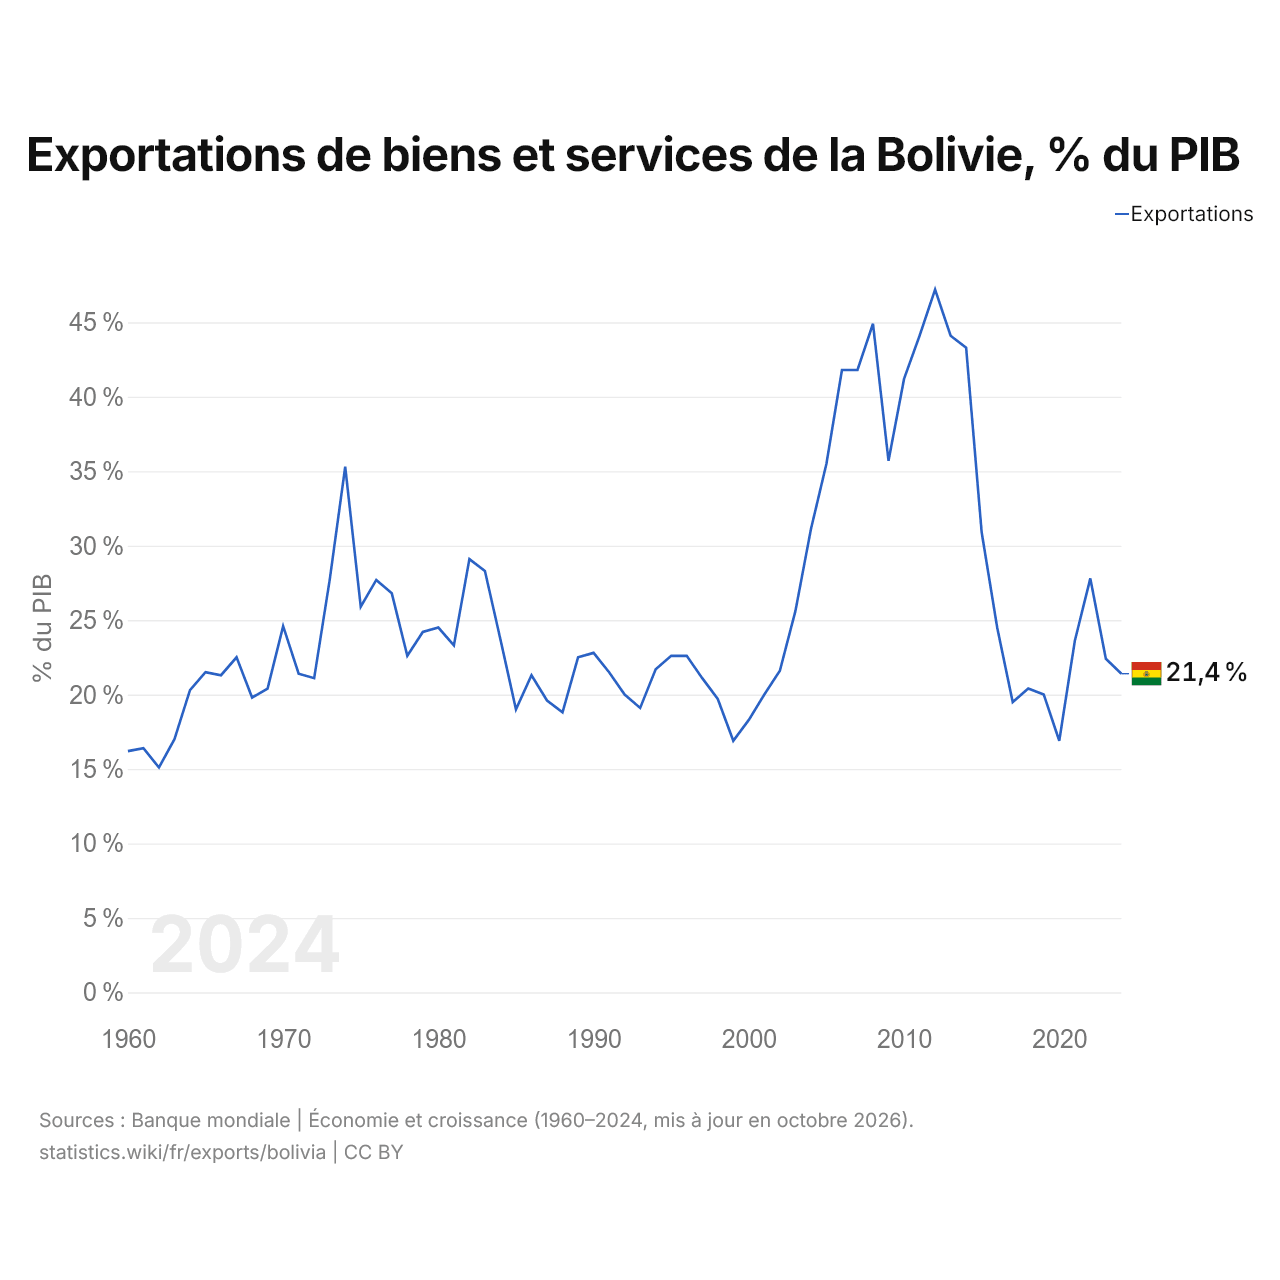
Les exportations de biens et services de la Bolivie équivalent à 21,4 % de son PIB (2024), contre 16,2 % en 1960. La part la plus élevée a été de 47,2 %, en 2012.
Comparer les exportations de la Bolivie avec celles d'autres pays
Sources :
- Banque mondiale | Économie et croissance (1960–2025, mis à jour en octobre 2026)
- TradeMap (2001–2025, mis à jour en octobre 2026)
Creative Commons Attribution (CC BY) : vous pouvez copier, partager, adapter et réutiliser ce contenu, y compris à des fins commerciales, à condition de citer statistics.wiki et d’indiquer les modifications apportées. Les sources citées ci-dessus peuvent avoir leurs propres conditions de licence.