
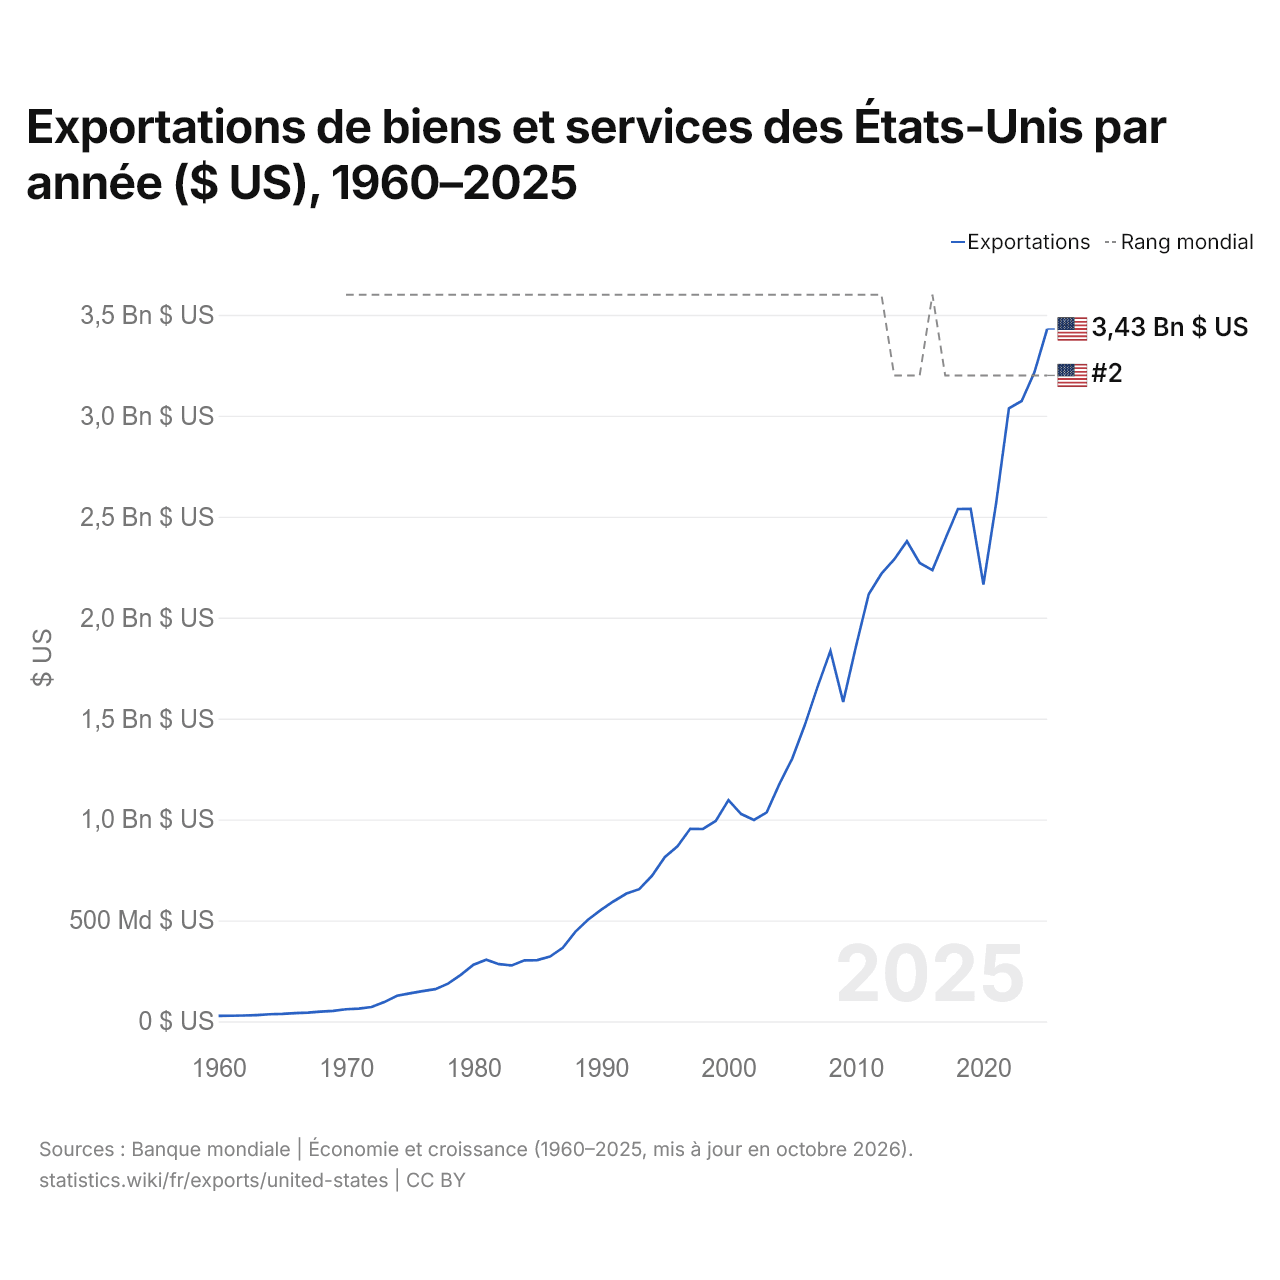
Exportations de biens et services des États-Unis par année ($ US), 1960–2025
| Année | $ US | Rang mondial |
|---|---|---|
| Exportations | Rang mondial | |
| 2025 | 3 429 815 000 000 $ US | #2 |
| 2024 | 3 215 368 000 000 $ US | #2 |
| 2023 | 3 073 360 000 000 $ US | #2 |
| 2022 | 3 036 430 000 000 $ US | #2 |
| 2021 | 2 568 697 000 000 $ US | #2 |
| 2020 | 2 163 837 000 000 $ US | #2 |
| 2019 | 2 539 391 000 000 $ US | #2 |
| 2018 | 2 538 089 000 000 $ US | #2 |
| 2017 | 2 388 260 000 000 $ US | #2 |
| 2016 | 2 235 558 000 000 $ US | #1 |
| 2015 | 2 270 622 000 000 $ US | #2 |
| 2014 | 2 378 545 000 000 $ US | #2 |
| 2013 | 2 287 922 000 000 $ US | #2 |
| 2012 | 2 217 700 000 000 $ US | #1 |
| 2011 | 2 115 864 000 000 $ US | #1 |
| 2010 | 1 857 247 000 000 $ US | #1 |
| 2009 | 1 582 774 000 000 $ US | #1 |
| 2008 | 1 835 280 000 000 $ US | #1 |
| 2007 | 1 659 295 000 000 $ US | #1 |
| 2006 | 1 470 170 000 000 $ US | #1 |
| 2005 | 1 301 580 000 000 $ US | #1 |
| 2004 | 1 176 363 000 000 $ US | #1 |
| 2003 | 1 035 165 000 000 $ US | #1 |
| 2002 | 997 979 000 000 $ US | #1 |
| 2001 | 1 026 812 000 000 $ US | #1 |
| 2000 | 1 096 111 000 000 $ US | #1 |
| 1999 | 992 910 000 000 $ US | #1 |
| 1998 | 952 979 000 000 $ US | #1 |
| 1997 | 953 803 000 000 $ US | #1 |
| 1996 | 867 589 000 000 $ US | #1 |
| 1995 | 812 810 000 000 $ US | #1 |
| 1994 | 720 937 000 000 $ US | #1 |
| 1993 | 654 799 000 000 $ US | #1 |
| 1992 | 633 053 000 000 $ US | #1 |
| 1991 | 594 931 000 000 $ US | #1 |
| 1990 | 551 873 000 000 $ US | #1 |
| 1989 | 504 289 000 000 $ US | #1 |
| 1988 | 444 601 000 000 $ US | #1 |
| 1987 | 363 943 000 000 $ US | #1 |
| 1986 | 320 998 000 000 $ US | #1 |
| 1985 | 303 211 000 000 $ US | #1 |
| 1984 | 302 380 000 000 $ US | #1 |
| 1983 | 276 996 000 000 $ US | #1 |
| 1982 | 283 210 000 000 $ US | #1 |
| 1981 | 305 239 000 000 $ US | #1 |
| 1980 | 280 772 000 000 $ US | #1 |
| 1979 | 230 129 000 000 $ US | #1 |
| 1978 | 186 883 000 000 $ US | #1 |
| 1977 | 159 349 000 000 $ US | #1 |
| 1976 | 149 515 000 000 $ US | #1 |
| 1975 | 138 706 000 000 $ US | #1 |
| 1974 | 126 650 000 000 $ US | #1 |
| 1973 | 95 269 000 000 $ US | #1 |
| 1972 | 70 843 000 000 $ US | #1 |
| 1971 | 62 963 000 000 $ US | #1 |
| 1970 | 59 709 000 000 $ US | #1 |
| 1969 | 51 869 339 287 $ US | - |
| 1968 | 47 834 057 455 $ US | - |
| 1967 | 43 410 585 757 $ US | - |
| 1966 | 40 867 257 476 $ US | - |
| 1965 | 37 066 116 833 $ US | - |
| 1964 | 34 943 052 213 $ US | - |
| 1963 | 31 009 633 840 $ US | - |
| 1962 | 29 013 598 685 $ US | - |
| 1961 | 27 567 636 480 $ US | - |
| 1960 | 27 024 960 774 $ US | - |
En 2025, les exportations de biens et services des États-Unis s'élevaient à 3,43 billions de dollars, contre 27 milliards de dollars en 1960. Elles se classaient au 2e rang mondial, un rang qu'elles occupent depuis 2017. Leur meilleur rang a été le 1er, occupé pour la dernière fois en 2016.
En 2025, les exportations de biens et services des États-Unis étaient les plus élevées en Amérique du Nord. Les importations de biens et services des États-Unis s'élevaient à 4,36 billions de dollars en 2025, les plus élevées du monde. En 2025, les importations des États-Unis dépassaient leurs exportations de 932 milliards de dollars, soit un déficit commercial.
Exportations de biens des États-Unis par catégorie, 2025
Exportations de biens, 2025: 2,18 Bn $US
En 2025, la première catégorie des exportations de biens des États-Unis était « machines, électronique et véhicules », avec 42,1 %, suivie de « pétrole, gaz, minerais et autres matières premières », avec 16,5 %.
Destinations des exportations de biens des États-Unis : les 10 premières, 2025
| Rang | Pays | Exportations de biens | Part | |
|---|---|---|---|---|
| 1 |
 Mexique |
338 Md $US | 15,5 % | vs Mexique |
| 2 |
 Canada |
330 Md $US | 15,1 % | vs Canada |
| 3 |
 Chine |
106 Md $US | 4,88 % | vs Chine |
| 4 |
 Royaume-Uni |
97,0 Md $US | 4,45 % | vs R.-U. |
| 5 |
 Pays-Bas |
95,6 Md $US | 4,39 % | vs Pays-Bas |
| 6 |
 Allemagne |
83,1 Md $US | 3,81 % | vs Allemagne |
| 7 |
 Japon |
82,1 Md $US | 3,77 % | vs Japon |
| 8 |
 Suisse |
71,7 Md $US | 3,29 % | vs Suisse |
| 9 |
 Corée du Sud |
68,8 Md $US | 3,16 % | |
| 10 |
 Brésil |
54,4 Md $US | 2,5 % | vs Brésil |
| Autres partenaires et non précisés | 852 Md $US | 39,1 % |
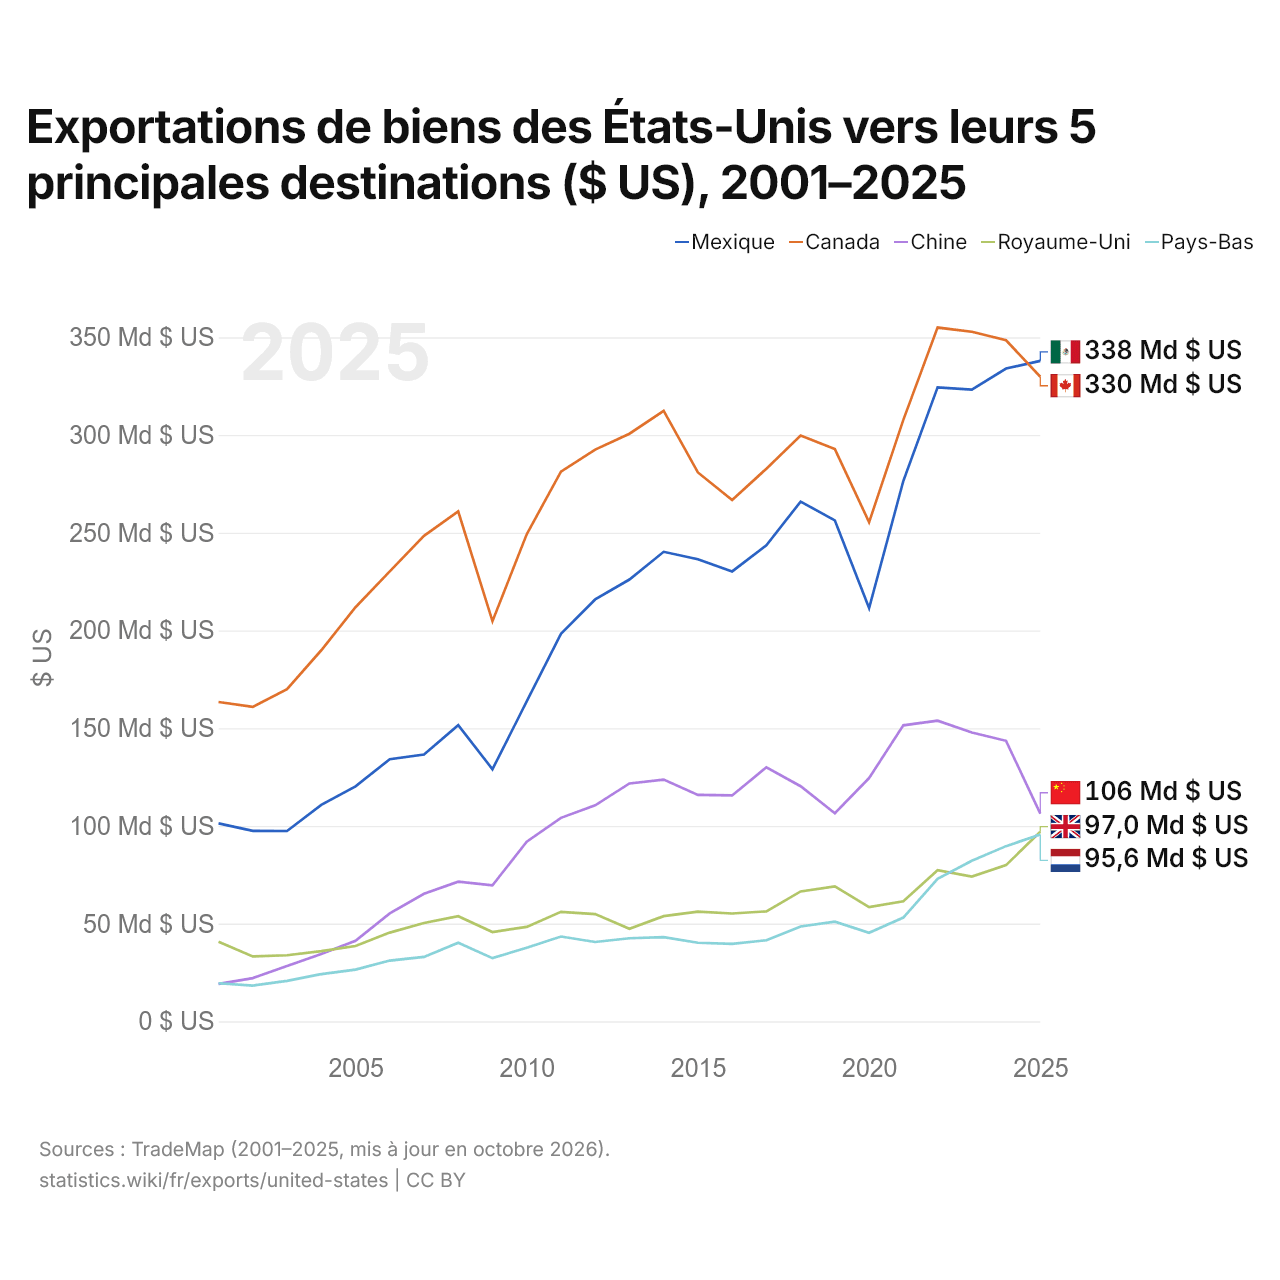
Exportations de biens des États-Unis vers leurs 5 principales destinations ($ US), 2001–2025
| Année | $ US | ||||
|---|---|---|---|---|---|
| Mexique | Canada | Chine | Royaume-Uni | Pays-Bas | |
| 2025 | 337 960 142 000 $ US | 329 801 099 000 $ US | 106 308 398 000 $ US | 97 009 392 000 $ US | 95 642 893 000 $ US |
| 2024 | 334 041 359 000 $ US | 348 503 416 000 $ US | 143 545 740 000 $ US | 79 941 343 000 $ US | 89 648 785 000 $ US |
| 2023 | 323 227 913 000 $ US | 352 842 805 000 $ US | 147 805 636 000 $ US | 74 089 917 000 $ US | 82 188 781 000 $ US |
| 2022 | 324 377 863 000 $ US | 354 993 501 000 $ US | 153 837 091 000 $ US | 77 300 938 000 $ US | 72 889 513 000 $ US |
| 2021 | 276 491 020 000 $ US | 307 758 093 000 $ US | 151 442 173 000 $ US | 61 425 144 000 $ US | 53 080 078 000 $ US |
| 2020 | 211 481 021 000 $ US | 255 392 345 000 $ US | 124 485 431 000 $ US | 58 429 779 000 $ US | 45 304 856 000 $ US |
| 2019 | 256 315 828 000 $ US | 292 820 258 000 $ US | 106 448 372 000 $ US | 69 066 568 000 $ US | 50 999 792 000 $ US |
| 2018 | 265 944 976 000 $ US | 299 731 712 000 $ US | 120 289 288 000 $ US | 66 454 485 000 $ US | 48 560 472 000 $ US |
| 2017 | 243 608 975 000 $ US | 282 773 830 000 $ US | 129 997 227 000 $ US | 56 262 428 000 $ US | 41 499 803 000 $ US |
| 2016 | 230 228 834 000 $ US | 266 734 465 000 $ US | 115 594 784 000 $ US | 55 197 491 000 $ US | 39 645 357 000 $ US |
| 2015 | 236 460 137 000 $ US | 280 855 169 000 $ US | 115 873 365 000 $ US | 56 094 706 000 $ US | 40 211 652 000 $ US |
| 2014 | 240 247 090 000 $ US | 312 371 471 000 $ US | 123 675 623 000 $ US | 53 808 147 000 $ US | 43 067 033 000 $ US |
| 2013 | 226 070 227 000 $ US | 300 685 611 000 $ US | 121 721 076 000 $ US | 47 339 021 000 $ US | 42 505 242 000 $ US |
| 2012 | 215 875 039 000 $ US | 292 567 767 000 $ US | 110 516 536 000 $ US | 54 853 629 000 $ US | 40 617 368 000 $ US |
| 2011 | 198 288 689 000 $ US | 281 237 169 000 $ US | 104 121 383 000 $ US | 56 009 021 000 $ US | 43 412 845 000 $ US |
| 2010 | 163 664 583 000 $ US | 249 248 666 000 $ US | 91 910 977 000 $ US | 48 328 089 000 $ US | 37 681 975 000 $ US |
| 2009 | 128 997 663 000 $ US | 204 720 827 000 $ US | 69 575 613 000 $ US | 45 707 871 000 $ US | 32 346 735 000 $ US |
| 2008 | 151 524 799 000 $ US | 260 890 167 000 $ US | 71 456 412 000 $ US | 53 771 992 000 $ US | 40 220 701 000 $ US |
| 2007 | 136 520 317 000 $ US | 248 408 654 000 $ US | 65 237 883 000 $ US | 50 294 385 000 $ US | 32 985 939 000 $ US |
| 2006 | 134 127 535 000 $ US | 230 244 127 000 $ US | 55 224 097 000 $ US | 45 391 799 000 $ US | 31 101 731 000 $ US |
| 2005 | 120 246 882 000 $ US | 211 895 288 000 $ US | 41 190 675 000 $ US | 38 560 828 000 $ US | 26 467 738 000 $ US |
| 2004 | 110 731 247 000 $ US | 189 878 784 000 $ US | 34 427 687 000 $ US | 35 900 252 000 $ US | 24 139 521 000 $ US |
| 2003 | 97 411 740 000 $ US | 169 920 170 000 $ US | 28 367 721 000 $ US | 33 827 044 000 $ US | 20 694 832 000 $ US |
| 2002 | 97 470 195 000 $ US | 160 918 225 000 $ US | 22 127 509 000 $ US | 33 204 013 000 $ US | 18 310 488 000 $ US |
| 2001 | 101 295 130 000 $ US | 163 421 117 000 $ US | 19 181 936 000 $ US | 40 712 585 000 $ US | 19 484 478 000 $ US |
En 2025, les exportations de biens s'élevaient à 338 milliards de dollars vers le Mexique, 330 milliards de dollars vers le Canada, 106 milliards de dollars vers la Chine, 97 milliards de dollars vers le Royaume-Uni et 95,6 milliards de dollars vers les Pays-Bas. Le changement le plus récent dans leur ordre remonte à 2025, quand les exportations des États-Unis vers le Mexique ont dépassé celles vers le Canada.
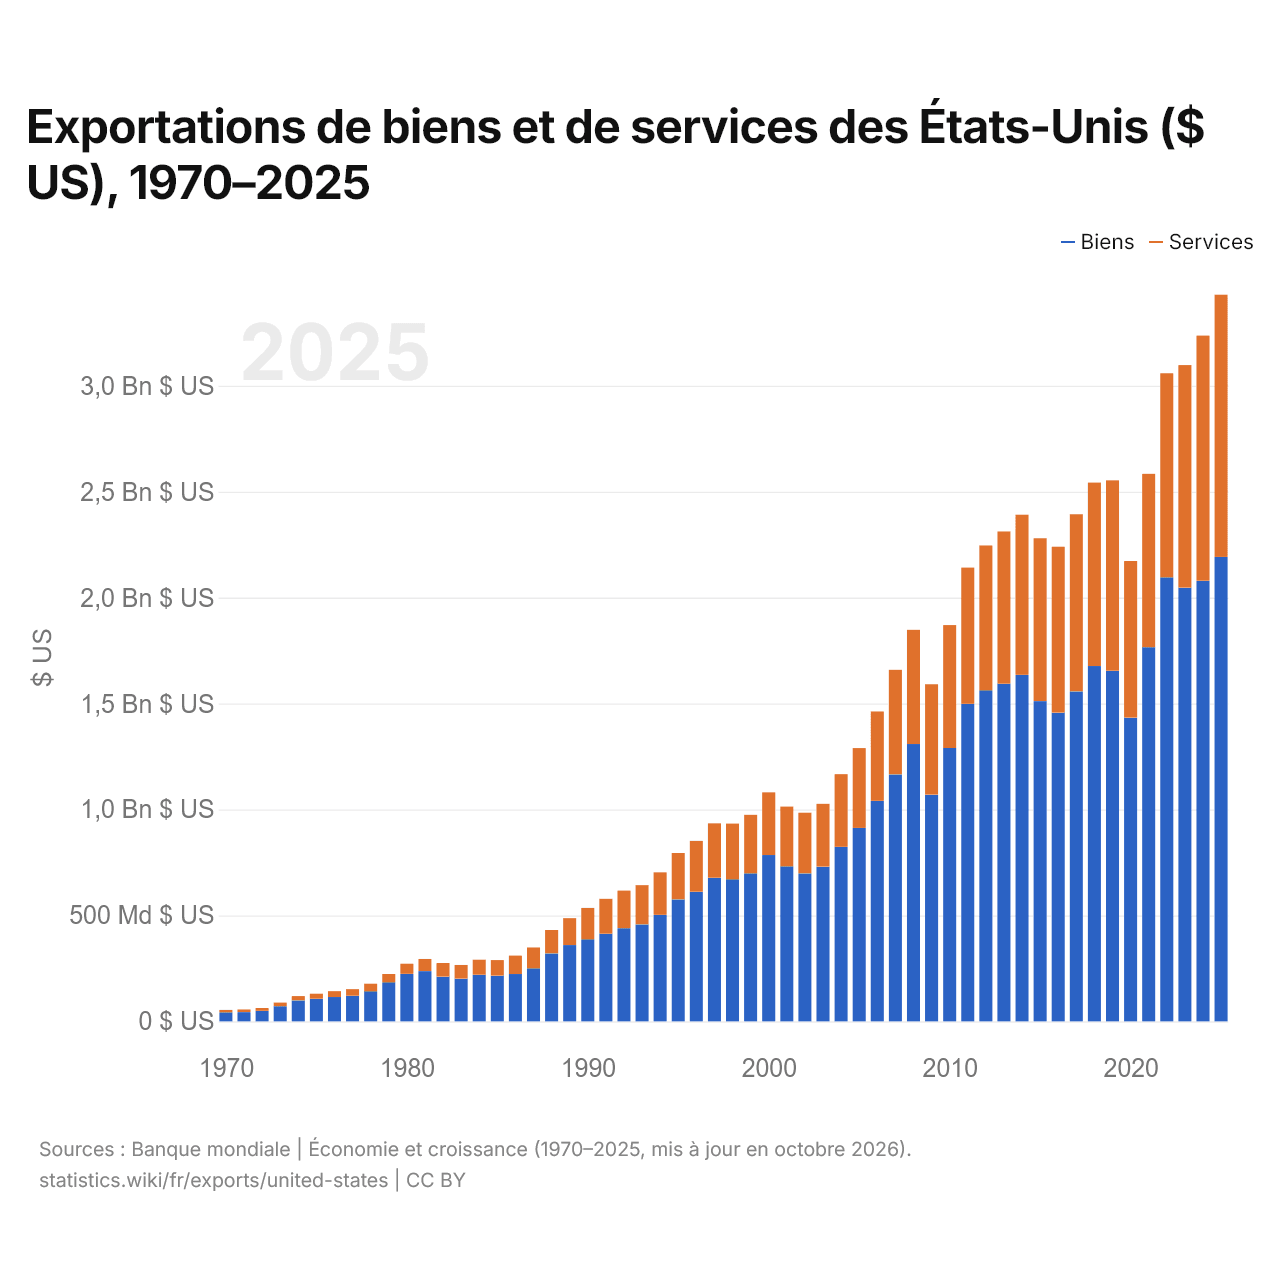
Exportations de biens et de services des États-Unis ($ US), 1970–2025
| Année | $ US | |
|---|---|---|
| Biens | Services | |
| 2025 | 2 191 921 000 000 $ US | 1 237 894 000 000 $ US |
| 2024 | 2 079 729 000 000 $ US | 1 156 672 000 000 $ US |
| 2023 | 2 047 210 000 000 $ US | 1 050 401 000 000 $ US |
| 2022 | 2 095 575 000 000 $ US | 963 089 000 000 $ US |
| 2021 | 1 765 854 000 000 $ US | 818 028 000 000 $ US |
| 2020 | 1 433 850 000 000 $ US | 738 760 000 000 $ US |
| 2019 | 1 655 099 000 000 $ US | 898 362 000 000 $ US |
| 2018 | 1 676 914 000 000 $ US | 866 094 000 000 $ US |
| 2017 | 1 557 004 000 000 $ US | 836 349 000 000 $ US |
| 2016 | 1 457 394 000 000 $ US | 782 564 000 000 $ US |
| 2015 | 1 511 383 000 000 $ US | 768 813 000 000 $ US |
| 2014 | 1 635 563 000 000 $ US | 755 771 000 000 $ US |
| 2013 | 1 593 708 000 000 $ US | 718 363 000 000 $ US |
| 2012 | 1 562 631 000 000 $ US | 683 523 000 000 $ US |
| 2011 | 1 498 887 000 000 $ US | 642 491 000 000 $ US |
| 2010 | 1 290 279 000 000 $ US | 579 901 000 000 $ US |
| 2009 | 1 070 330 000 000 $ US | 520 717 000 000 $ US |
| 2008 | 1 308 794 000 000 $ US | 538 918 000 000 $ US |
| 2007 | 1 165 153 000 000 $ US | 493 913 000 000 $ US |
| 2006 | 1 040 905 000 000 $ US | 421 537 000 000 $ US |
| 2005 | 913 016 000 000 $ US | 376 716 000 000 $ US |
| 2004 | 823 584 000 000 $ US | 342 834 000 000 $ US |
| 2003 | 730 445 000 000 $ US | 296 228 000 000 $ US |
| 2002 | 698 036 000 000 $ US | 286 552 000 000 $ US |
| 2001 | 731 331 000 000 $ US | 282 243 000 000 $ US |
| 2000 | 784 939 000 000 $ US | 295 917 000 000 $ US |
| 1999 | 698 524 000 000 $ US | 275 980 000 000 $ US |
| 1998 | 670 416 000 000 $ US | 262 767 000 000 $ US |
| 1997 | 678 366 000 000 $ US | 256 093 000 000 $ US |
| 1996 | 612 113 000 000 $ US | 239 515 000 000 $ US |
| 1995 | 575 204 000 000 $ US | 219 193 000 000 $ US |
| 1994 | 502 859 000 000 $ US | 200 395 000 000 $ US |
| 1993 | 456 943 000 000 $ US | 185 911 000 000 $ US |
| 1992 | 439 631 000 000 $ US | 177 241 900 000 $ US |
| 1991 | 414 077 000 000 $ US | 164 260 000 000 $ US |
| 1990 | 387 398 000 000 $ US | 147 860 000 000 $ US |
| 1989 | 359 923 000 000 $ US | 127 140 000 000 $ US |
| 1988 | 320 228 000 000 $ US | 110 915 000 000 $ US |
| 1987 | 250 210 000 000 $ US | 98 662 000 000 $ US |
| 1986 | 223 342 000 000 $ US | 86 699 000 000 $ US |
| 1985 | 215 917 000 000 $ US | 73 093 000 000 $ US |
| 1984 | 219 933 000 000 $ US | 71 114 000 000 $ US |
| 1983 | 201 798 000 000 $ US | 64 220 000 000 $ US |
| 1982 | 211 177 000 000 $ US | 63 990 000 000 $ US |
| 1981 | 237 045 000 000 $ US | 57 250 000 000 $ US |
| 1980 | 224 238 000 000 $ US | 47 550 000 000 $ US |
| 1979 | 184 439 000 000 $ US | 38 831 300 000 $ US |
| 1978 | 142 075 000 000 $ US | 35 450 000 000 $ US |
| 1977 | 120 810 000 000 $ US | 31 090 000 000 $ US |
| 1976 | 114 740 000 000 $ US | 27 580 000 000 $ US |
| 1975 | 107 090 000 000 $ US | 23 330 000 000 $ US |
| 1974 | 98 310 000 000 $ US | 20 770 000 000 $ US |
| 1973 | 71 410 000 000 $ US | 17 040 000 000 $ US |
| 1972 | 49 380 000 000 $ US | 13 350 000 000 $ US |
| 1971 | 43 310 000 000 $ US | 12 800 000 000 $ US |
| 1970 | 42 450 000 000 $ US | 11 450 000 000 $ US |
En 2025, les exportations de biens des États-Unis s'élevaient à 2,19 billions de dollars et celles de services à 1,24 billion de dollars ; les services représentaient 36,1 % du total, contre 21,2 % en 1970.
Les États-Unis dans le classement mondial des exportations, 2025
| Rang | Pays | Exportations | Part mondiale | |
|---|---|---|---|---|
| 1 |
Chine
|
4,11 Bn $US | 11,8 % | vs Chine |
| 2 |
 États-Unis |
3,43 Bn $US | 9,83 % | |
| 3 |
Allemagne
|
2,04 Bn $US | 5,85 % | vs Allemagne |
| 4 |
Royaume-Uni
|
1,22 Bn $US | 3,51 % | vs R.-U. |
| 5 |
 France |
1,12 Bn $US | 3,22 % | vs France |
| 6 |
Pays-Bas
|
1,08 Bn $US | 3,08 % | vs Pays-Bas |
| 7 |
 Singapour |
1,07 Bn $US | 3,08 % |
Exportations de biens et services des États-Unis, % du PIB, 1960–2025
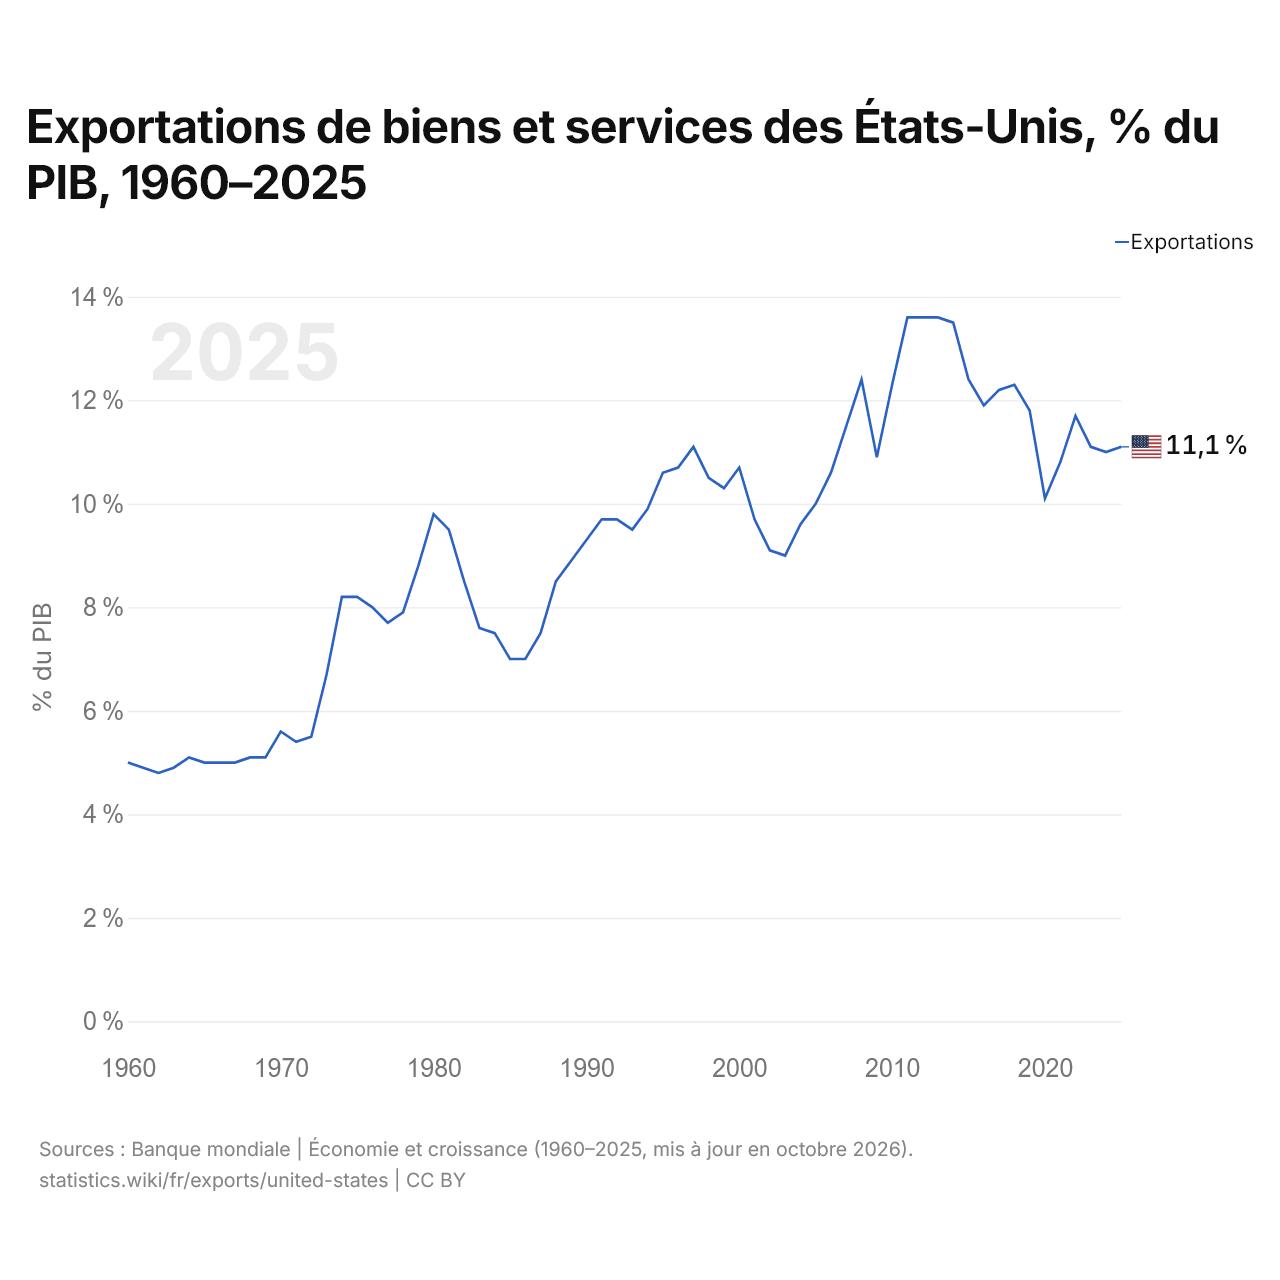
En 2025, les exportations de biens et services des États-Unis équivalaient à 11,1 % de leur PIB, contre 5,0 % en 1960. La part la plus élevée a été de 13,6 %, en 2012.
Comparer les exportations des États-Unis avec celles d'autres pays
Sources :
- TradeMap (2001–2025, mis à jour en octobre 2026)
- Banque mondiale | Économie et croissance (1960–2025, mis à jour en octobre 2026)
Creative Commons Attribution (CC BY) : vous pouvez copier, partager, adapter et réutiliser ce contenu, y compris à des fins commerciales, à condition de citer statistics.wiki et d’indiquer les modifications apportées. Les sources citées ci-dessus peuvent avoir leurs propres conditions de licence.