
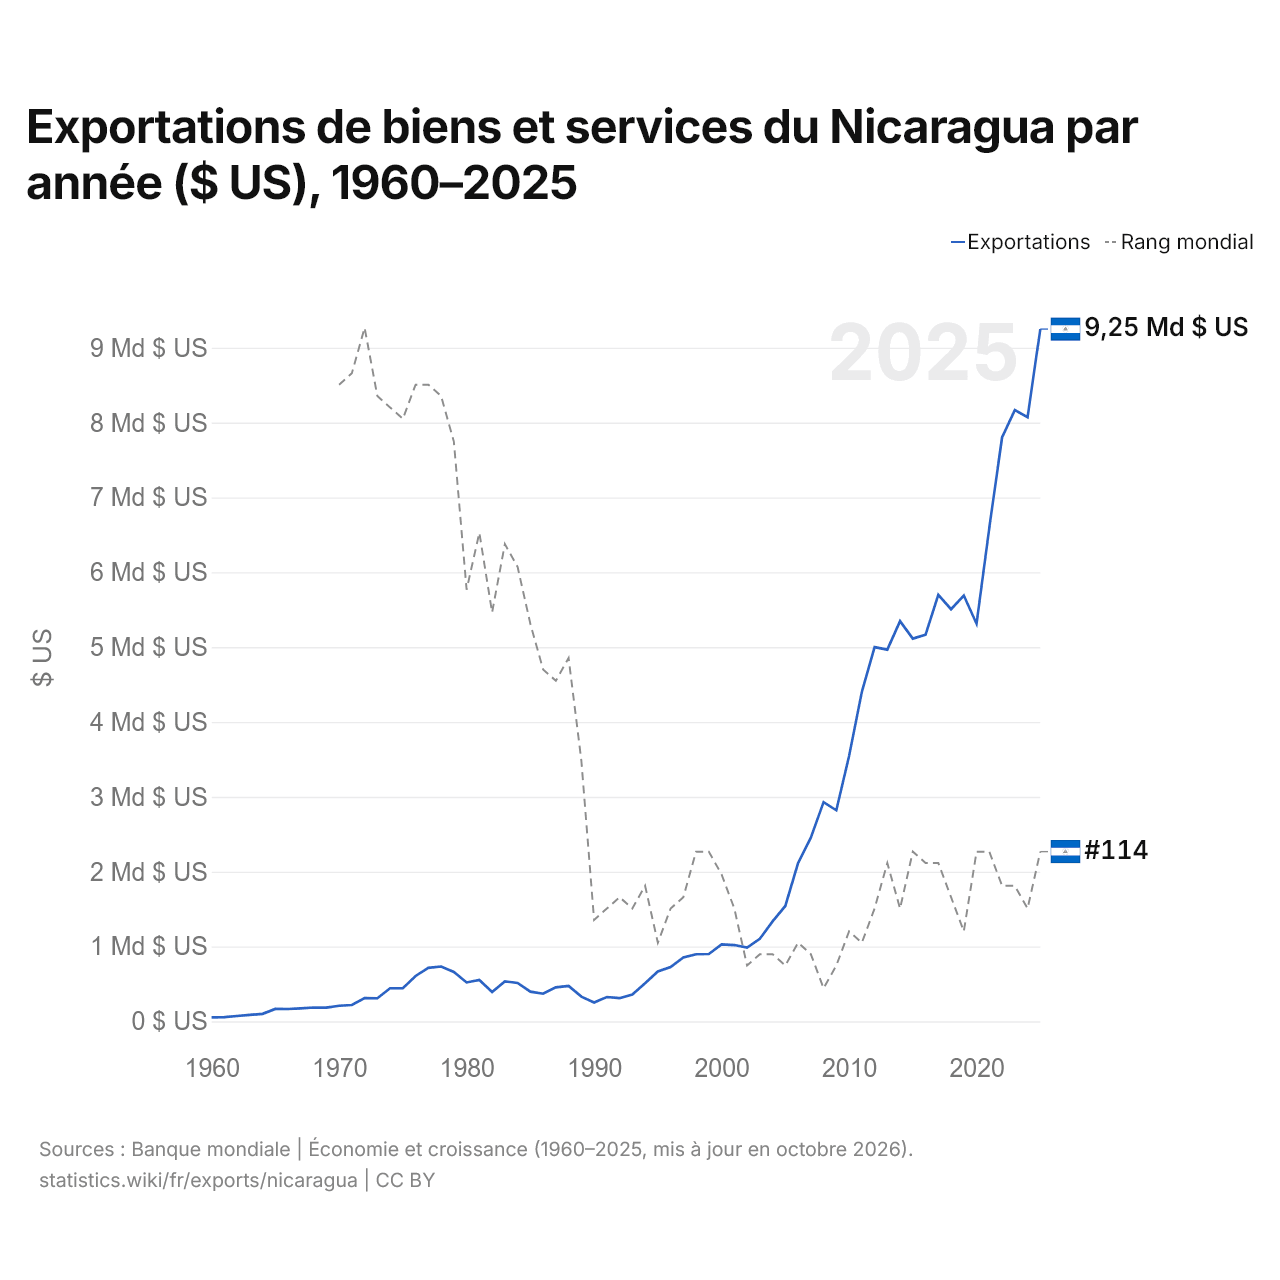
Exportations de biens et services du Nicaragua par année ($ US), 1960–2025
| Année | $ US | Rang mondial |
|---|---|---|
| Exportations | Rang mondial | |
| 2025 | 9 249 209 962 $ US | #114 |
| 2024 | 8 072 799 619 $ US | #119 |
| 2023 | 8 166 793 679 $ US | #117 |
| 2022 | 7 800 991 077 $ US | #117 |
| 2021 | 6 593 588 346 $ US | #114 |
| 2020 | 5 312 785 104 $ US | #114 |
| 2019 | 5 689 725 119 $ US | #121 |
| 2018 | 5 506 692 298 $ US | #118 |
| 2017 | 5 698 946 073 $ US | #115 |
| 2016 | 5 165 902 338 $ US | #115 |
| 2015 | 5 113 365 846 $ US | #114 |
| 2014 | 5 347 156 490 $ US | #119 |
| 2013 | 4 965 877 905 $ US | #115 |
| 2012 | 4 999 461 750 $ US | #119 |
| 2011 | 4 400 107 700 $ US | #122 |
| 2010 | 3 544 353 652 $ US | #121 |
| 2009 | 2 820 023 106 $ US | #124 |
| 2008 | 2 928 943 987 $ US | #126 |
| 2007 | 2 454 433 020 $ US | #123 |
| 2006 | 2 114 772 341 $ US | #122 |
| 2005 | 1 541 273 560 $ US | #124 |
| 2004 | 1 335 841 956 $ US | #123 |
| 2003 | 1 101 967 322 $ US | #123 |
| 2002 | 984 522 983 $ US | #124 |
| 2001 | 1 019 075 853 $ US | #119 |
| 2000 | 1 027 444 240 $ US | #116 |
| 1999 | 899 835 239 $ US | #114 |
| 1998 | 896 218 483 $ US | #114 |
| 1997 | 852 512 885 $ US | #118 |
| 1996 | 725 843 474 $ US | #119 |
| 1995 | 666 412 218 $ US | #122 |
| 1994 | 507 617 768 $ US | #117 |
| 1993 | 358 807 190 $ US | #119 |
| 1992 | 309 280 000 $ US | #118 |
| 1991 | 324 886 598 $ US | #119 |
| 1990 | 251 842 581 $ US | #120 |
| 1989 | 329 660 036 $ US | #106 |
| 1988 | 473 058 950 $ US | #97 |
| 1987 | 453 312 553 $ US | #99 |
| 1986 | 368 698 848 $ US | #98 |
| 1985 | 396 280 490 $ US | #94 |
| 1984 | 512 628 154 $ US | #89 |
| 1983 | 534 109 825 $ US | #87 |
| 1982 | 392 200 153 $ US | #93 |
| 1981 | 552 951 120 $ US | #86 |
| 1980 | 519 538 168 $ US | #91 |
| 1979 | 658 777 312 $ US | #78 |
| 1978 | 732 135 142 $ US | #74 |
| 1977 | 714 673 957 $ US | #73 |
| 1976 | 606 080 025 $ US | #73 |
| 1975 | 443 524 241 $ US | #76 |
| 1974 | 442 345 370 $ US | #75 |
| 1973 | 308 310 585 $ US | #74 |
| 1972 | 310 040 793 $ US | #68 |
| 1971 | 217 911 328 $ US | #72 |
| 1970 | 208 130 437 $ US | #73 |
| 1969 | 182 894 687 $ US | - |
| 1968 | 184 888 776 $ US | - |
| 1967 | 173 891 684 $ US | - |
| 1966 | 164 627 049 $ US | - |
| 1965 | 165 339 903 $ US | - |
| 1964 | 100 227 288 $ US | - |
| 1963 | 85 701 582 $ US | - |
| 1962 | 71 175 904 $ US | - |
| 1961 | 57 134 379 $ US | - |
| 1960 | 53 745 065 $ US | - |
En 2025, les exportations de biens et services du Nicaragua s'élevaient à 9,25 milliards de dollars, contre 53,7 millions de dollars en 1960. Elles se classaient au 114e rang mondial, en hausse par rapport au 119e rang en 2024. Leur meilleur rang a été le 68e, occupé pour la dernière fois en 1972.
En 2025, les exportations de biens et services du Nicaragua étaient les 19es plus élevées de 27 pays situés en Amérique latine. Les importations de biens et services du Nicaragua s'élevaient à 12,2 milliards de dollars en 2025, au 113e rang mondial. En 2025, les importations du Nicaragua dépassaient ses exportations de 2,95 milliards de dollars, soit un déficit commercial.
Exportations de biens du Nicaragua par catégorie, 2025
Exportations de biens, 2025: 8,72 Md $US
En 2025, la première catégorie des exportations de biens du Nicaragua était « métaux précieux, pierres précieuses, bijoux, montres, instruments de musique et art », avec 23,0 %, suivie de « textiles, vêtements, chaussures, meubles et jouets », avec 21,1 %.
Destinations des exportations de biens du Nicaragua : les 10 premières, 2025
| Rang | Pays | Exportations de biens | Part | |
|---|---|---|---|---|
| 1 |
 États-Unis |
4,02 Md $US | 46,1 % | |
| 2 |
 Mexique |
1,06 Md $US | 12,2 % | |
| 3 |
 Canada |
932 M $US | 10,7 % | |
| 4 |
 Salvador |
530 M $US | 6,08 % | |
| 5 |
 Honduras |
470 M $US | 5,39 % | |
| 6 |
 Belgique |
212 M $US | 2,44 % | |
| 7 |
 Costa Rica |
204 M $US | 2,34 % | |
| 8 |
 Guatemala |
152 M $US | 1,75 % | |
| 9 |
 Chine |
102 M $US | 1,17 % | |
| 10 |
 Allemagne |
101 M $US | 1,16 % | |
| Autres partenaires et non précisés | 931 M $US | 10,7 % |
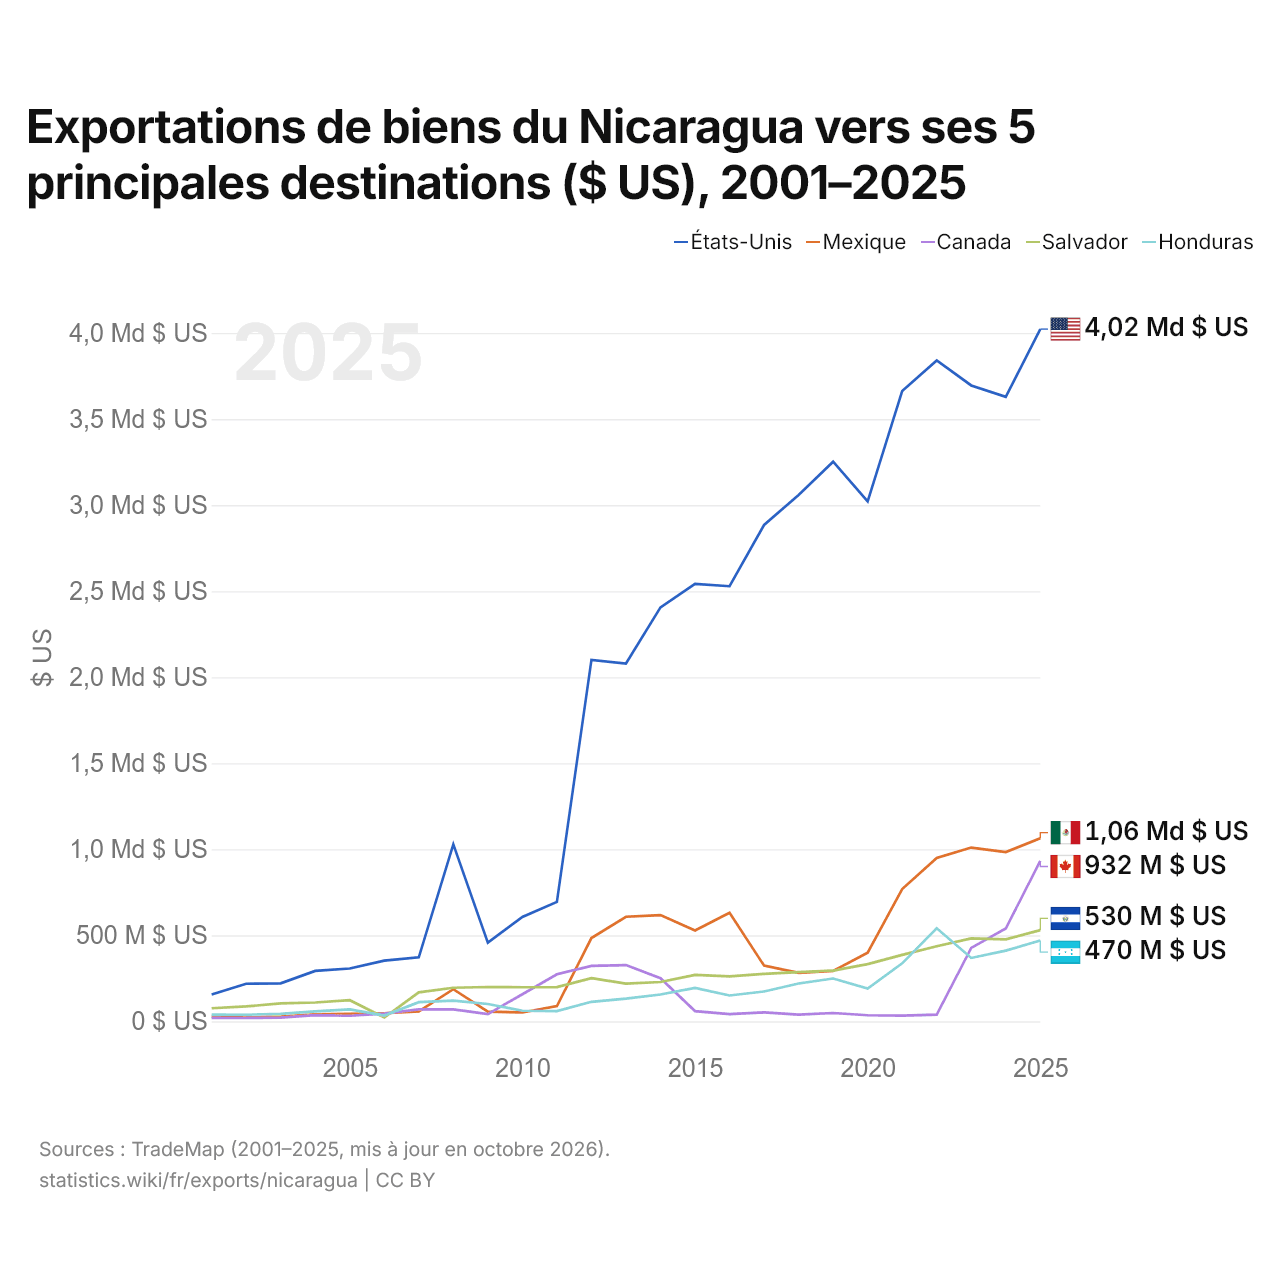
Exportations de biens du Nicaragua vers ses 5 principales destinations ($ US), 2001–2025
| Année | $ US | ||||
|---|---|---|---|---|---|
| États-Unis | Mexique | Canada | Salvador | Honduras | |
| 2025 | 4 022 793 000 $ US | 1 063 880 000 $ US | 932 381 000 $ US | 529 880 000 $ US | 470 088 000 $ US |
| 2024 | 3 629 168 000 $ US | 983 425 000 $ US | 539 246 000 $ US | 476 316 000 $ US | 410 908 000 $ US |
| 2023 | 3 695 300 000 $ US | 1 009 725 000 $ US | 426 734 000 $ US | 482 227 000 $ US | 368 448 000 $ US |
| 2022 | 3 841 095 000 $ US | 948 980 000 $ US | 39 046 000 $ US | 436 636 000 $ US | 540 518 000 $ US |
| 2021 | 3 663 099 000 $ US | 768 630 000 $ US | 33 366 000 $ US | 386 385 000 $ US | 336 997 000 $ US |
| 2020 | 3 022 087 000 $ US | 398 606 000 $ US | 35 369 000 $ US | 332 522 000 $ US | 190 101 000 $ US |
| 2019 | 3 252 275 000 $ US | 293 318 000 $ US | 48 617 000 $ US | 294 649 000 $ US | 248 915 000 $ US |
| 2018 | 3 059 214 000 $ US | 282 034 000 $ US | 38 652 000 $ US | 285 608 000 $ US | 220 042 000 $ US |
| 2017 | 2 884 637 000 $ US | 323 754 000 $ US | 51 780 000 $ US | 276 058 000 $ US | 173 613 000 $ US |
| 2016 | 2 528 651 000 $ US | 631 346 000 $ US | 41 605 000 $ US | 261 678 000 $ US | 150 074 000 $ US |
| 2015 | 2 541 637 000 $ US | 528 042 000 $ US | 59 481 000 $ US | 269 606 000 $ US | 194 262 000 $ US |
| 2014 | 2 405 533 000 $ US | 617 446 000 $ US | 250 317 000 $ US | 228 472 000 $ US | 155 940 000 $ US |
| 2013 | 2 079 255 000 $ US | 607 664 000 $ US | 326 974 000 $ US | 218 856 000 $ US | 132 263 000 $ US |
| 2012 | 2 100 452 000 $ US | 484 204 000 $ US | 321 836 000 $ US | 250 806 000 $ US | 113 358 000 $ US |
| 2011 | 694 153 000 $ US | 88 713 000 $ US | 273 363 000 $ US | 198 877 000 $ US | 59 421 000 $ US |
| 2010 | 606 559 000 $ US | 51 586 000 $ US | 157 390 000 $ US | 198 184 000 $ US | 61 683 000 $ US |
| 2009 | 457 595 000 $ US | 56 759 000 $ US | 42 296 000 $ US | 199 353 000 $ US | 100 581 000 $ US |
| 2008 | 1 028 381 000 $ US | 186 638 000 $ US | 69 439 000 $ US | 194 961 000 $ US | 120 368 000 $ US |
| 2007 | 372 105 000 $ US | 57 961 000 $ US | 69 449 000 $ US | 168 329 000 $ US | 111 399 000 $ US |
| 2006 | 353 021 000 $ US | 46 930 000 $ US | 45 173 000 $ US | 22 354 000 $ US | 33 707 000 $ US |
| 2005 | 306 775 000 $ US | 44 085 000 $ US | 32 471 000 $ US | 122 795 000 $ US | 69 738 000 $ US |
| 2004 | 293 167 000 $ US | 40 708 000 $ US | 35 983 000 $ US | 109 586 000 $ US | 58 031 000 $ US |
| 2003 | 220 909 000 $ US | 27 880 000 $ US | 21 349 000 $ US | 104 289 000 $ US | 43 377 000 $ US |
| 2002 | 218 446 000 $ US | 21 351 000 $ US | 19 413 000 $ US | 86 675 000 $ US | 38 428 000 $ US |
| 2001 | 156 127 000 $ US | 27 053 000 $ US | 19 629 000 $ US | 75 852 000 $ US | 38 615 000 $ US |
En 2025, les exportations de biens s'élevaient à 4,02 milliards de dollars vers les États-Unis, 1,06 milliard de dollars vers le Mexique, 932 millions de dollars vers le Canada, 530 millions de dollars vers le Salvador et 470 millions de dollars vers le Honduras. Le premier rang des cinq destinations du Nicaragua est occupé par les États-Unis chaque année depuis 2001. Le changement le plus récent dans leur ordre remonte à 2024, quand les exportations du Nicaragua vers le Canada ont dépassé celles vers le Salvador.
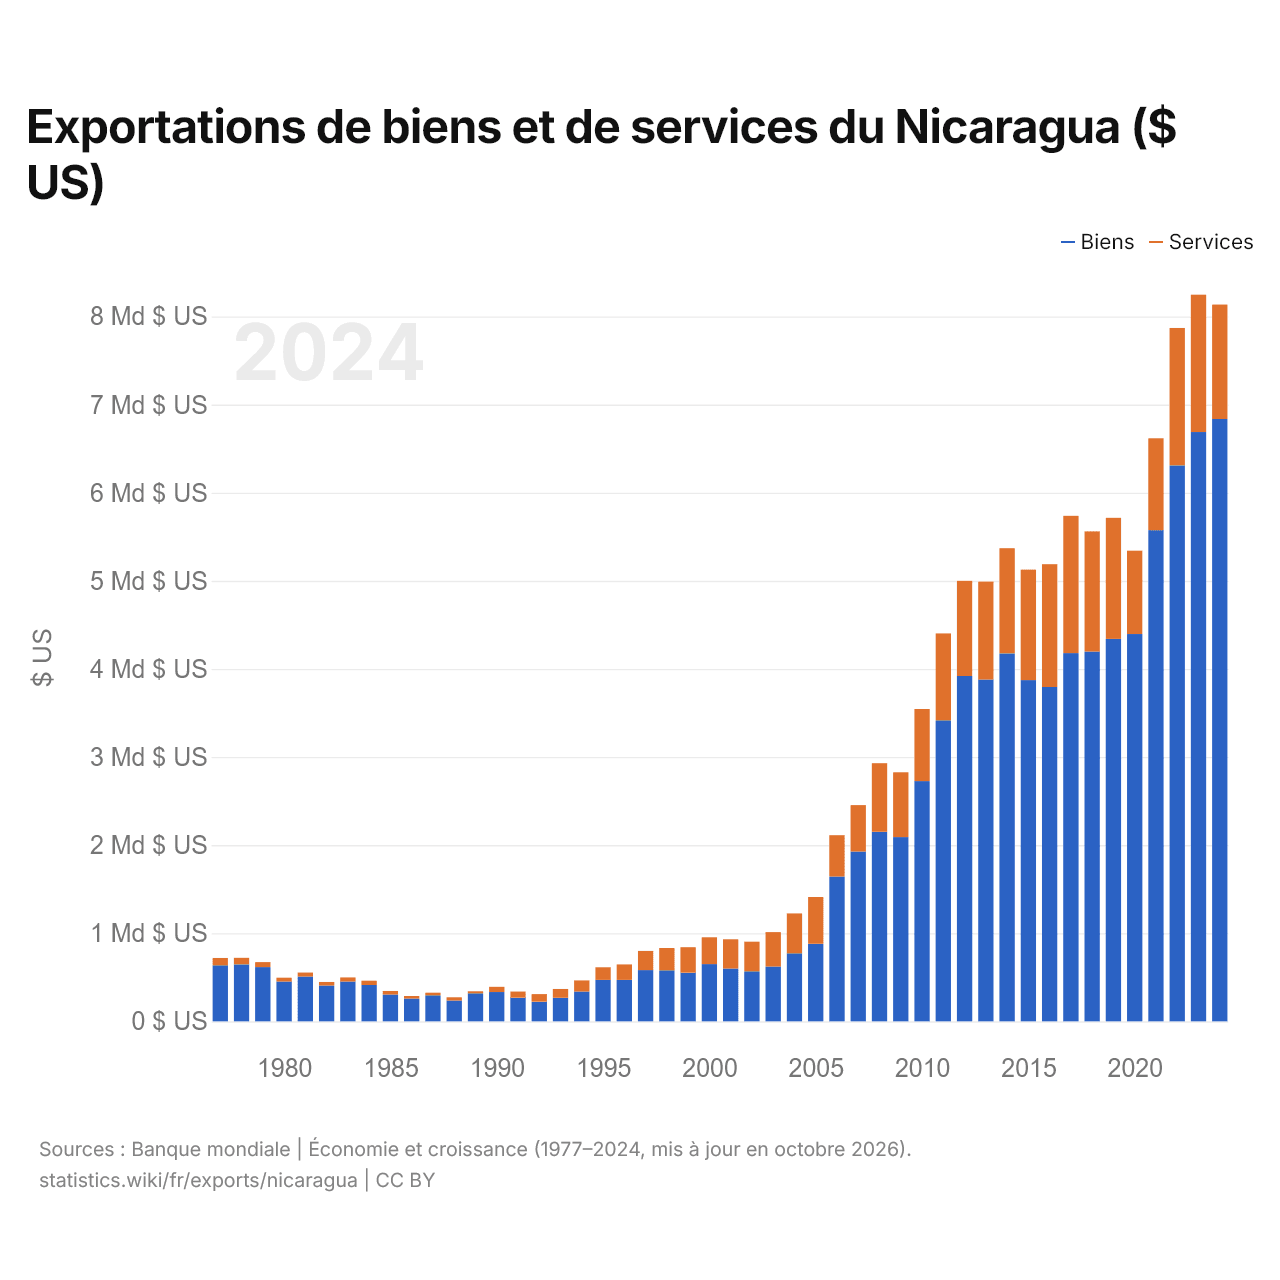
Exportations de biens et de services du Nicaragua ($ US)
| Année | $ US | |
|---|---|---|
| Biens | Services | |
| 2024 | 6 836 600 000 $ US | 1 298 118 290 $ US |
| 2023 | 6 688 300 000 $ US | 1 559 200 000 $ US |
| 2022 | 6 309 700 000 $ US | 1 559 800 000 $ US |
| 2021 | 5 574 100 000 $ US | 1 043 621 142 $ US |
| 2020 | 4 395 800 000 $ US | 946 300 000 $ US |
| 2019 | 4 341 000 000 $ US | 1 373 100 000 $ US |
| 2018 | 4 197 400 000 $ US | 1 363 600 000 $ US |
| 2017 | 4 179 500 000 $ US | 1 557 600 000 $ US |
| 2016 | 3 794 600 000 $ US | 1 394 100 000 $ US |
| 2015 | 3 873 400 000 $ US | 1 253 400 000 $ US |
| 2014 | 4 175 800 000 $ US | 1 193 900 000 $ US |
| 2013 | 3 879 000 000 $ US | 1 111 900 000 $ US |
| 2012 | 3 919 400 000 $ US | 1 080 400 000 $ US |
| 2011 | 3 416 100 000 $ US | 986 500 000 $ US |
| 2010 | 2 726 100 000 $ US | 818 900 000 $ US |
| 2009 | 2 091 400 000 $ US | 735 700 000 $ US |
| 2008 | 2 151 300 000 $ US | 778 800 000 $ US |
| 2007 | 1 927 200 000 $ US | 526 400 000 $ US |
| 2006 | 1 644 000 000 $ US | 468 700 000 $ US |
| 2005 | 880 430 000 $ US | 530 700 000 $ US |
| 2004 | 772 300 000 $ US | 452 800 000 $ US |
| 2003 | 622 300 000 $ US | 390 400 000 $ US |
| 2002 | 567 400 000 $ US | 337 000 000 $ US |
| 2001 | 599 000 000 $ US | 331 600 000 $ US |
| 2000 | 649 900 000 $ US | 303 700 000 $ US |
| 1999 | 552 300 000 $ US | 288 822 000 $ US |
| 1998 | 579 400 000 $ US | 252 664 000 $ US |
| 1997 | 581 700 000 $ US | 217 434 000 $ US |
| 1996 | 470 900 000 $ US | 174 828 000 $ US |
| 1995 | 469 800 000 $ US | 143 720 506 $ US |
| 1994 | 338 600 000 $ US | 126 092 000 $ US |
| 1993 | 267 000 000 $ US | 100 200 000 $ US |
| 1992 | 223 100 000 $ US | 86 200 000 $ US |
| 1991 | 268 100 000 $ US | 70 200 000 $ US |
| 1990 | 332 400 000 $ US | 59 800 000 $ US |
| 1989 | 318 700 000 $ US | 22 000 000 $ US |
| 1988 | 235 700 000 $ US | 37 400 000 $ US |
| 1987 | 295 100 000 $ US | 29 500 000 $ US |
| 1986 | 257 800 000 $ US | 29 500 000 $ US |
| 1985 | 305 100 000 $ US | 39 300 000 $ US |
| 1984 | 412 400 000 $ US | 48 400 000 $ US |
| 1983 | 451 900 000 $ US | 46 100 000 $ US |
| 1982 | 406 000 000 $ US | 40 800 000 $ US |
| 1981 | 508 200 000 $ US | 45 100 000 $ US |
| 1980 | 450 400 000 $ US | 44 400 000 $ US |
| 1979 | 615 900 000 $ US | 56 300 000 $ US |
| 1978 | 646 000 000 $ US | 74 200 000 $ US |
| 1977 | 636 200 000 $ US | 83 100 000 $ US |
Les exportations de biens du Nicaragua s'élèvent à 6,84 milliards de dollars (2024) et celles de services à 1,3 milliard de dollars ; les services représentent 16,0 % du total, contre 11,6 % en 1977.
Le Nicaragua dans le classement mondial des exportations, 2025
| Rang | Pays | Exportations | Part mondiale | |
|---|---|---|---|---|
| 111 |
 Brunei |
10,8 Md $US | 0,03 % | |
| 112 |
 Maurice |
10,5 Md $US | 0,03 % | |
| 113 |
 Burkina Faso |
9,67 Md $US | 0,03 % | |
| 114 |
 Nicaragua |
9,25 Md $US | 0,03 % | |
| 115 |
 Mozambique |
9,24 Md $US | 0,03 % | |
| 116 |
 Zambie |
8,85 Md $US (2024) | 0,03 % | |
| 117 |
 Cuba |
8,77 Md $US (2020) | 0,04 % | vs Cuba |
Exportations de biens et services du Nicaragua, % du PIB, 1960–2025
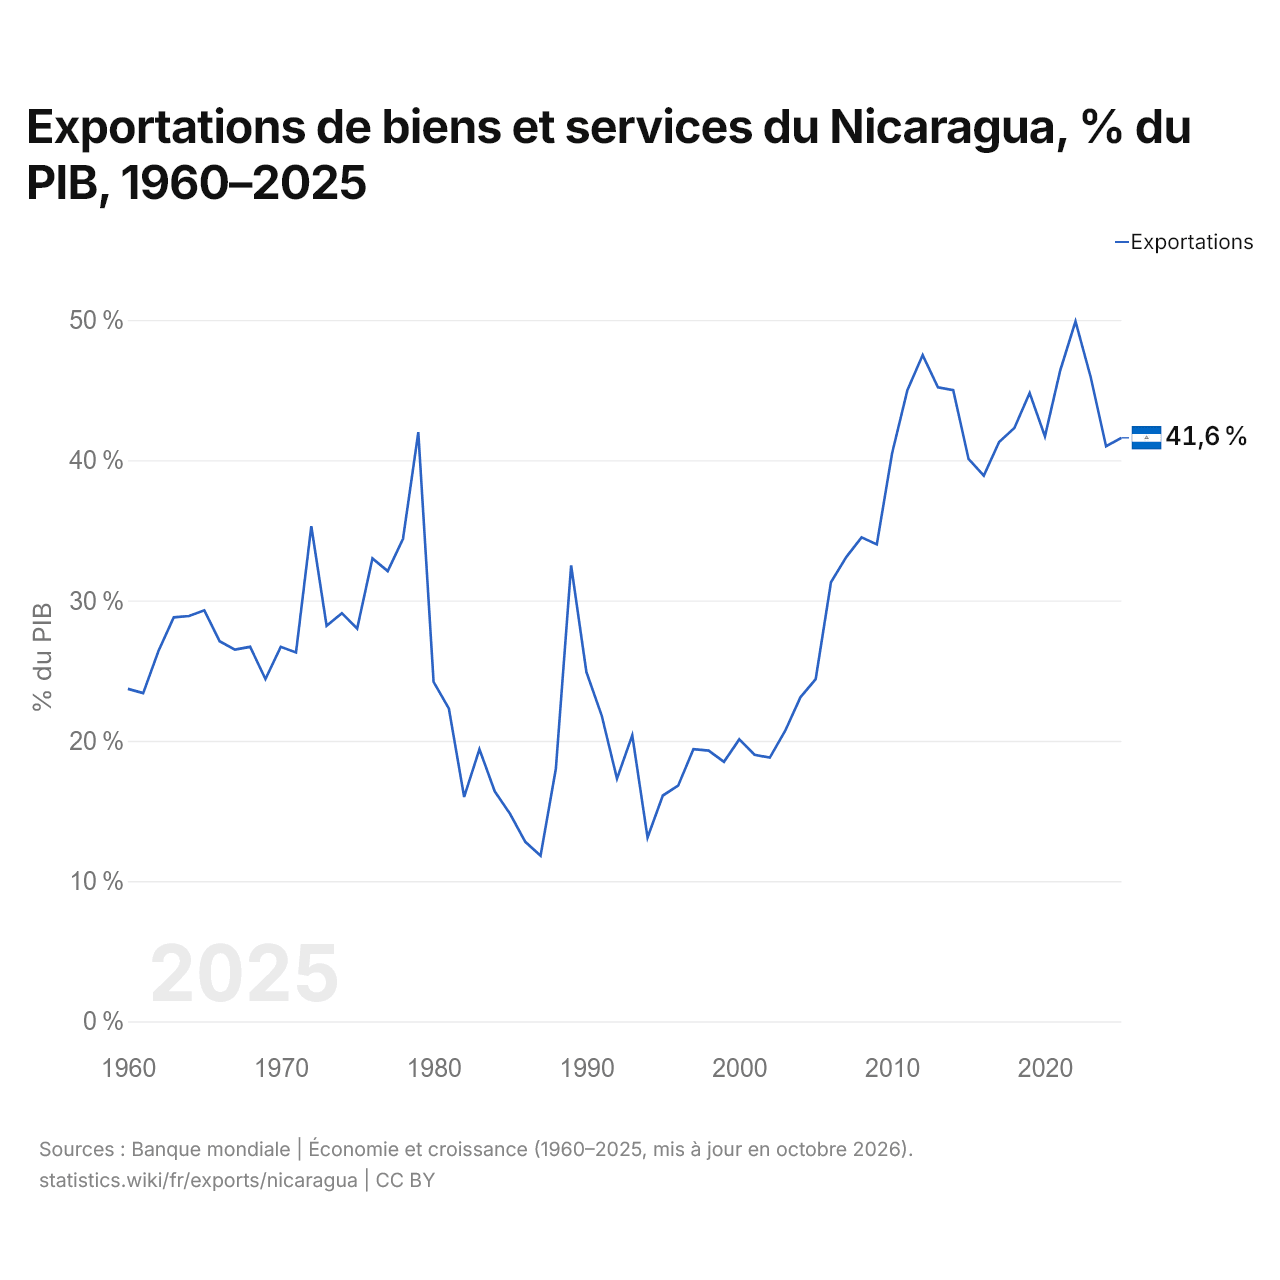
En 2025, les exportations de biens et services du Nicaragua équivalaient à 41,6 % de son PIB, contre 23,7 % en 1960. La part la plus élevée a été de 49,9 %, en 2022.
Comparer les exportations du Nicaragua avec celles d'autres pays
Sources :
- Banque mondiale | Économie et croissance (1960–2025, mis à jour en octobre 2026)
- TradeMap (2001–2025, mis à jour en octobre 2026)
Creative Commons Attribution (CC BY) : vous pouvez copier, partager, adapter et réutiliser ce contenu, y compris à des fins commerciales, à condition de citer statistics.wiki et d’indiquer les modifications apportées. Les sources citées ci-dessus peuvent avoir leurs propres conditions de licence.