
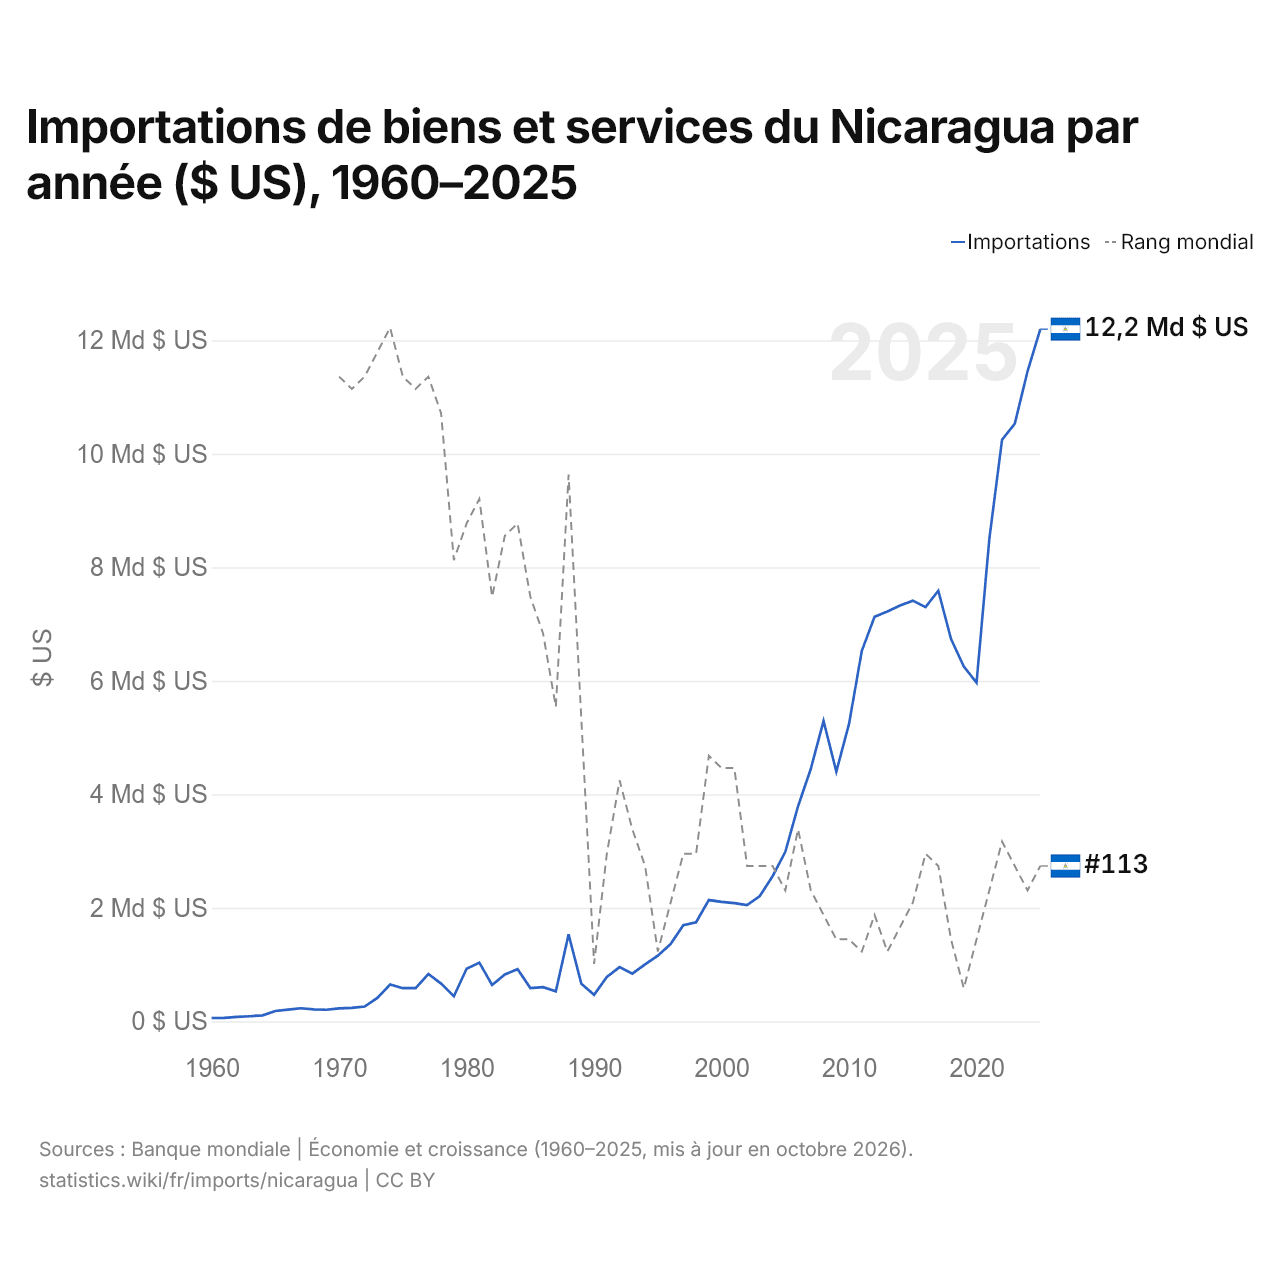
Importations de biens et services du Nicaragua par année ($ US), 1960–2025
| Année | $ US | Rang mondial |
|---|---|---|
| Importations | Rang mondial | |
| 2025 | 12 198 469 836 $ US | #113 |
| 2024 | 11 455 318 548 $ US | #115 |
| 2023 | 10 532 819 128 $ US | #113 |
| 2022 | 10 249 854 374 $ US | #111 |
| 2021 | 8 497 441 442 $ US | #115 |
| 2020 | 5 967 676 881 $ US | #119 |
| 2019 | 6 252 718 089 $ US | #123 |
| 2018 | 6 735 028 773 $ US | #119 |
| 2017 | 7 587 978 453 $ US | #113 |
| 2016 | 7 298 277 151 $ US | #112 |
| 2015 | 7 412 965 477 $ US | #116 |
| 2014 | 7 329 057 911 $ US | #118 |
| 2013 | 7 223 504 605 $ US | #120 |
| 2012 | 7 131 030 120 $ US | #117 |
| 2011 | 6 530 275 932 $ US | #120 |
| 2010 | 5 246 135 011 $ US | #119 |
| 2009 | 4 399 317 810 $ US | #119 |
| 2008 | 5 295 609 531 $ US | #117 |
| 2007 | 4 451 215 795 $ US | #115 |
| 2006 | 3 790 567 751 $ US | #110 |
| 2005 | 2 987 684 968 $ US | #115 |
| 2004 | 2 556 737 616 $ US | #113 |
| 2003 | 2 207 131 661 $ US | #113 |
| 2002 | 2 050 007 301 $ US | #113 |
| 2001 | 2 083 877 017 $ US | #105 |
| 2000 | 2 104 655 848 $ US | #105 |
| 1999 | 2 137 009 200 $ US | #104 |
| 1998 | 1 746 565 268 $ US | #112 |
| 1997 | 1 693 914 533 $ US | #112 |
| 1996 | 1 362 967 813 $ US | #116 |
| 1995 | 1 157 042 258 $ US | #120 |
| 1994 | 1 002 161 964 $ US | #113 |
| 1993 | 840 604 575 $ US | #110 |
| 1992 | 954 960 000 $ US | #106 |
| 1991 | 781 711 340 $ US | #112 |
| 1990 | 467 806 452 $ US | #121 |
| 1989 | 660 512 092 $ US | #101 |
| 1988 | 1 533 030 883 $ US | #81 |
| 1987 | 529 939 250 $ US | #100 |
| 1986 | 601 158 384 $ US | #94 |
| 1985 | 585 751 366 $ US | #91 |
| 1984 | 918 158 455 $ US | #85 |
| 1983 | 825 726 780 $ US | #86 |
| 1982 | 639 525 499 $ US | #91 |
| 1981 | 1 033 954 423 $ US | #83 |
| 1980 | 927 803 482 $ US | #85 |
| 1979 | 441 002 913 $ US | #88 |
| 1978 | 664 891 168 $ US | #76 |
| 1977 | 833 487 995 $ US | #73 |
| 1976 | 584 906 472 $ US | #74 |
| 1975 | 584 238 746 $ US | #73 |
| 1974 | 648 227 312 $ US | #69 |
| 1973 | 413 146 202 $ US | #71 |
| 1972 | 260 426 280 $ US | #73 |
| 1971 | 236 470 381 $ US | #74 |
| 1970 | 227 279 250 $ US | #73 |
| 1969 | 203 851 355 $ US | - |
| 1968 | 210 576 069 $ US | - |
| 1967 | 230 288 988 $ US | - |
| 1966 | 207 159 869 $ US | - |
| 1965 | 182 869 912 $ US | - |
| 1964 | 105 871 526 $ US | - |
| 1963 | 89 918 284 $ US | - |
| 1962 | 77 832 506 $ US | - |
| 1961 | 59 945 532 $ US | - |
| 1960 | 59 462 106 $ US | - |
En 2025, les importations de biens et services du Nicaragua s'élevaient à 12,2 milliards de dollars, contre 59,5 millions de dollars en 1960. Elles se classaient au 113e rang mondial, en hausse par rapport au 115e rang en 2024. Leur meilleur rang a été le 69e, occupé pour la dernière fois en 1974.
En 2025, les importations de biens et services du Nicaragua étaient les 17es plus élevées de 26 pays situés en Amérique latine. En 2025, les importations du Nicaragua dépassaient ses exportations de 2,95 milliards de dollars, soit un déficit commercial. Le commerce du Nicaragua, exportations et importations réunies, équivalait à 96,4 % de son PIB en 2025, au 64e rang mondial.
Importations de biens du Nicaragua par catégorie, 2025
Importations de biens, 2025: 12,4 Md $US
En 2025, la première catégorie des importations de biens du Nicaragua était « machines, électronique et véhicules », avec 24,5 %, suivie de « textiles, vêtements, chaussures, meubles et jouets », avec 18,0 %.
Origines des importations de biens du Nicaragua : les 10 premières, 2025
| Rang | Pays | Importations de biens | Part | |
|---|---|---|---|---|
| 1 |
 États-Unis |
2,65 Md $US | 21,4 % | |
| 2 |
 Chine |
2,08 Md $US | 16,8 % | |
| 3 |
 Honduras |
1,15 Md $US | 9,32 % | |
| 4 |
 Mexique |
1,01 Md $US | 8,14 % | |
| 5 |
 Guatemala |
923 M $US | 7,46 % | |
| 6 |
 Costa Rica |
772 M $US | 6,24 % | |
| 7 |
 Salvador |
477 M $US | 3,85 % | |
| 8 |
 Inde |
398 M $US | 3,22 % | |
| 9 |
 Japon |
294 M $US | 2,38 % | |
| 10 |
 Brésil |
221 M $US | 1,79 % | |
| Autres partenaires et non précisés | 2,40 Md $US | 19,4 % |
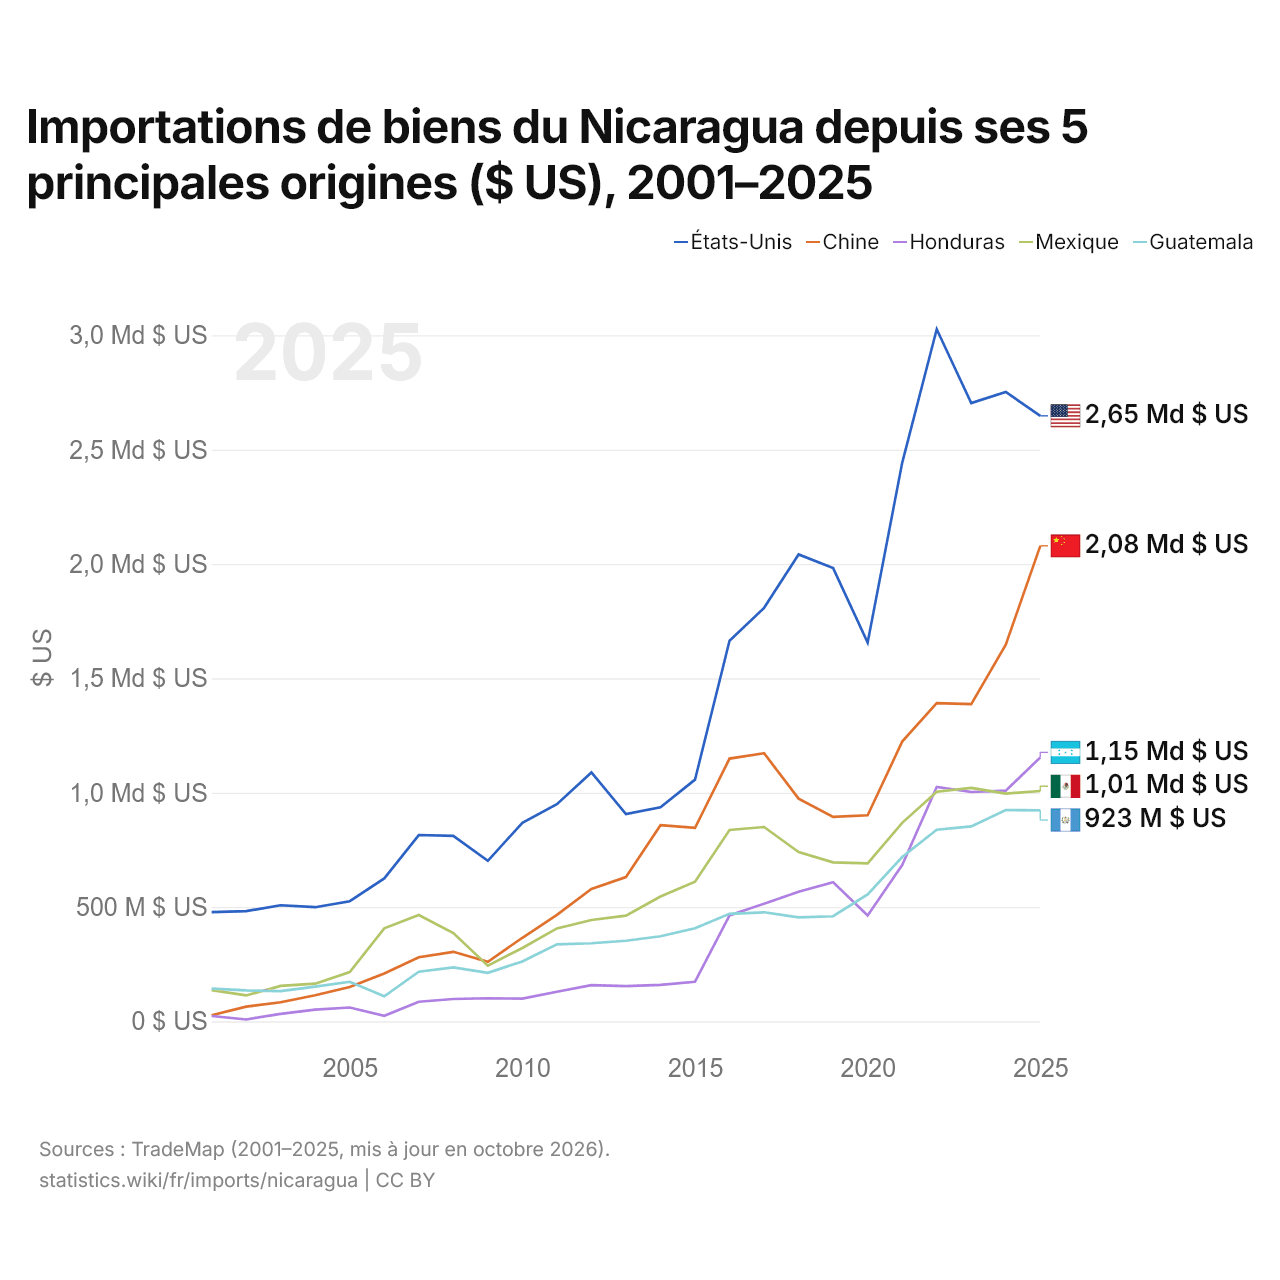
Importations de biens du Nicaragua depuis ses 5 principales origines ($ US), 2001–2025
| Année | $ US | ||||
|---|---|---|---|---|---|
| États-Unis | Chine | Honduras | Mexique | Guatemala | |
| 2025 | 2 647 653 000 $ US | 2 079 184 000 $ US | 1 154 143 000 $ US | 1 007 323 000 $ US | 922 814 000 $ US |
| 2024 | 2 752 194 000 $ US | 1 647 457 000 $ US | 1 008 668 000 $ US | 995 835 000 $ US | 923 760 000 $ US |
| 2023 | 2 703 379 000 $ US | 1 386 926 000 $ US | 1 002 684 000 $ US | 1 020 778 000 $ US | 852 226 000 $ US |
| 2022 | 3 026 689 000 $ US | 1 391 665 000 $ US | 1 024 638 000 $ US | 1 004 163 000 $ US | 837 667 000 $ US |
| 2021 | 2 442 406 000 $ US | 1 223 170 000 $ US | 683 160 000 $ US | 867 960 000 $ US | 718 435 000 $ US |
| 2020 | 1 656 488 000 $ US | 900 891 000 $ US | 462 927 000 $ US | 690 900 000 $ US | 554 605 000 $ US |
| 2019 | 1 981 937 000 $ US | 893 851 000 $ US | 607 907 000 $ US | 695 324 000 $ US | 459 467 000 $ US |
| 2018 | 2 041 603 000 $ US | 973 553 000 $ US | 566 907 000 $ US | 740 407 000 $ US | 454 779 000 $ US |
| 2017 | 1 808 025 000 $ US | 1 172 354 000 $ US | 514 593 000 $ US | 849 814 000 $ US | 476 831 000 $ US |
| 2016 | 1 664 327 000 $ US | 1 149 017 000 $ US | 462 980 000 $ US | 836 554 000 $ US | 470 051 000 $ US |
| 2015 | 1 056 805 000 $ US | 846 151 000 $ US | 173 092 000 $ US | 610 294 000 $ US | 406 853 000 $ US |
| 2014 | 935 713 000 $ US | 857 868 000 $ US | 159 440 000 $ US | 545 839 000 $ US | 372 068 000 $ US |
| 2013 | 905 967 000 $ US | 630 844 000 $ US | 153 844 000 $ US | 461 982 000 $ US | 352 524 000 $ US |
| 2012 | 1 088 343 000 $ US | 578 585 000 $ US | 158 430 000 $ US | 443 335 000 $ US | 341 380 000 $ US |
| 2011 | 949 295 000 $ US | 465 356 000 $ US | 129 610 000 $ US | 406 335 000 $ US | 336 695 000 $ US |
| 2010 | 868 550 000 $ US | 365 453 000 $ US | 99 128 000 $ US | 320 906 000 $ US | 261 835 000 $ US |
| 2009 | 701 676 000 $ US | 260 457 000 $ US | 100 771 000 $ US | 243 619 000 $ US | 212 328 000 $ US |
| 2008 | 810 865 000 $ US | 303 995 000 $ US | 97 576 000 $ US | 386 018 000 $ US | 235 648 000 $ US |
| 2007 | 814 661 000 $ US | 280 315 000 $ US | 85 667 000 $ US | 464 679 000 $ US | 216 818 000 $ US |
| 2006 | 624 744 000 $ US | 208 959 000 $ US | 24 248 000 $ US | 406 878 000 $ US | 109 451 000 $ US |
| 2005 | 525 364 000 $ US | 149 890 000 $ US | 60 412 000 $ US | 215 742 000 $ US | 173 046 000 $ US |
| 2004 | 499 130 000 $ US | 114 060 000 $ US | 51 468 000 $ US | 164 558 000 $ US | 152 001 000 $ US |
| 2003 | 507 437 000 $ US | 83 336 000 $ US | 32 763 000 $ US | 154 979 000 $ US | 132 160 000 $ US |
| 2002 | 482 002 000 $ US | 64 274 000 $ US | 8 210 000 $ US | 113 320 000 $ US | 135 292 000 $ US |
| 2001 | 477 494 000 $ US | 26 521 000 $ US | 23 363 000 $ US | 136 694 000 $ US | 142 897 000 $ US |
En 2025, les importations de biens s'élevaient à 2,65 milliards de dollars en provenance des États-Unis, 2,08 milliards de dollars en provenance de la Chine, 1,15 milliard de dollars en provenance du Honduras, 1,01 milliard de dollars en provenance du Mexique et 923 millions de dollars en provenance du Guatemala. Le premier rang des cinq fournisseurs du Nicaragua est occupé par les États-Unis chaque année depuis 2001. Le changement le plus récent dans leur ordre remonte à 2024, quand les importations du Nicaragua en provenance du Honduras ont dépassé celles en provenance du Mexique.
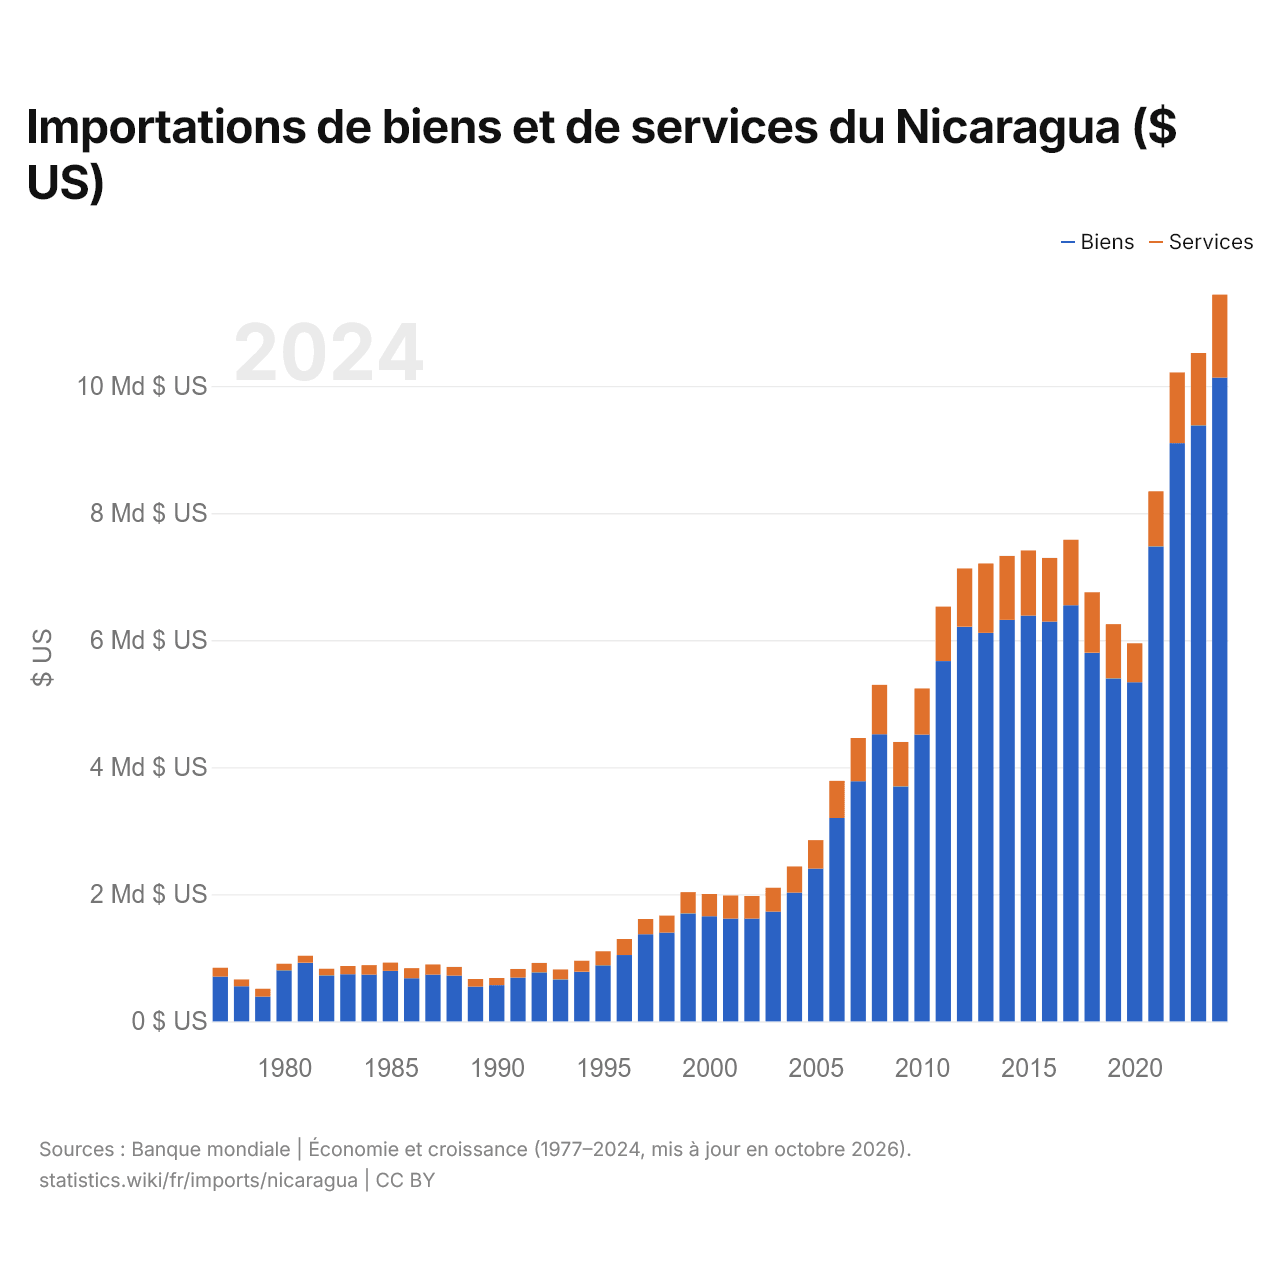
Importations de biens et de services du Nicaragua ($ US)
| Année | $ US | |
|---|---|---|
| Biens | Services | |
| 2024 | 10 131 300 000 $ US | 1 306 000 000 $ US |
| 2023 | 9 380 200 000 $ US | 1 138 600 000 $ US |
| 2022 | 9 100 500 000 $ US | 1 112 500 000 $ US |
| 2021 | 7 474 700 000 $ US | 867 100 000 $ US |
| 2020 | 5 338 500 000 $ US | 613 000 000 $ US |
| 2019 | 5 396 900 000 $ US | 854 600 000 $ US |
| 2018 | 5 801 500 000 $ US | 952 700 000 $ US |
| 2017 | 6 549 100 000 $ US | 1 030 500 000 $ US |
| 2016 | 6 291 600 000 $ US | 1 002 100 000 $ US |
| 2015 | 6 387 600 000 $ US | 1 024 200 000 $ US |
| 2014 | 6 318 700 000 $ US | 1 006 800 000 $ US |
| 2013 | 6 113 900 000 $ US | 1 092 200 000 $ US |
| 2012 | 6 209 800 000 $ US | 918 800 000 $ US |
| 2011 | 5 669 600 000 $ US | 857 800 000 $ US |
| 2010 | 4 512 900 000 $ US | 725 800 000 $ US |
| 2009 | 3 697 300 000 $ US | 699 800 000 $ US |
| 2008 | 4 518 300 000 $ US | 778 100 000 $ US |
| 2007 | 3 778 100 000 $ US | 681 600 000 $ US |
| 2006 | 3 200 600 000 $ US | 584 500 000 $ US |
| 2005 | 2 404 600 000 $ US | 448 200 000 $ US |
| 2004 | 2 027 700 000 $ US | 409 000 000 $ US |
| 2003 | 1 726 100 000 $ US | 376 800 000 $ US |
| 2002 | 1 617 500 000 $ US | 355 400 000 $ US |
| 2001 | 1 617 300 000 $ US | 363 700 000 $ US |
| 2000 | 1 653 200 000 $ US | 350 700 000 $ US |
| 1999 | 1 698 100 000 $ US | 334 700 000 $ US |
| 1998 | 1 397 000 000 $ US | 267 800 000 $ US |
| 1997 | 1 370 600 000 $ US | 239 400 000 $ US |
| 1996 | 1 043 400 000 $ US | 252 800 000 $ US |
| 1995 | 881 400 000 $ US | 220 500 000 $ US |
| 1994 | 780 500 000 $ US | 172 900 000 $ US |
| 1993 | 659 400 000 $ US | 156 600 000 $ US |
| 1992 | 770 800 000 $ US | 148 300 000 $ US |
| 1991 | 688 000 000 $ US | 136 200 000 $ US |
| 1990 | 569 700 000 $ US | 112 300 000 $ US |
| 1989 | 547 300 000 $ US | 119 200 000 $ US |
| 1988 | 718 300 000 $ US | 138 100 000 $ US |
| 1987 | 734 400 000 $ US | 160 500 000 $ US |
| 1986 | 677 400 000 $ US | 159 100 000 $ US |
| 1985 | 794 100 000 $ US | 129 600 000 $ US |
| 1984 | 735 300 000 $ US | 149 000 000 $ US |
| 1983 | 742 300 000 $ US | 128 200 000 $ US |
| 1982 | 723 500 000 $ US | 103 500 000 $ US |
| 1981 | 922 400 000 $ US | 110 200 000 $ US |
| 1980 | 802 900 000 $ US | 103 700 000 $ US |
| 1979 | 388 900 000 $ US | 123 600 000 $ US |
| 1978 | 553 300 000 $ US | 106 600 000 $ US |
| 1977 | 704 200 000 $ US | 139 200 000 $ US |
Les importations de biens du Nicaragua s'élèvent à 10,1 milliards de dollars (2024) et celles de services à 1,31 milliard de dollars ; les services représentent 11,4 % du total, contre 16,5 % en 1977.
Le Nicaragua dans le classement mondial des importations, 2025
| Rang | Pays | Importations | Part mondiale | |
|---|---|---|---|---|
| 110 |
 Somalie |
12,8 Md $US | 0,04 % | |
| 111 |
 Mozambique |
12,4 Md $US | 0,04 % | |
| 112 |
 Moldavie |
12,4 Md $US | 0,04 % | |
| 113 |
 Nicaragua |
12,2 Md $US | 0,04 % | |
| 114 |
 Maurice |
12,1 Md $US | 0,04 % | |
| 115 |
 Afghanistan |
12,1 Md $US (2024) | 0,04 % | |
| 116 |
 Cameroun |
12,0 Md $US | 0,04 % |
Importations de biens et services du Nicaragua, % du PIB, 1960–2025
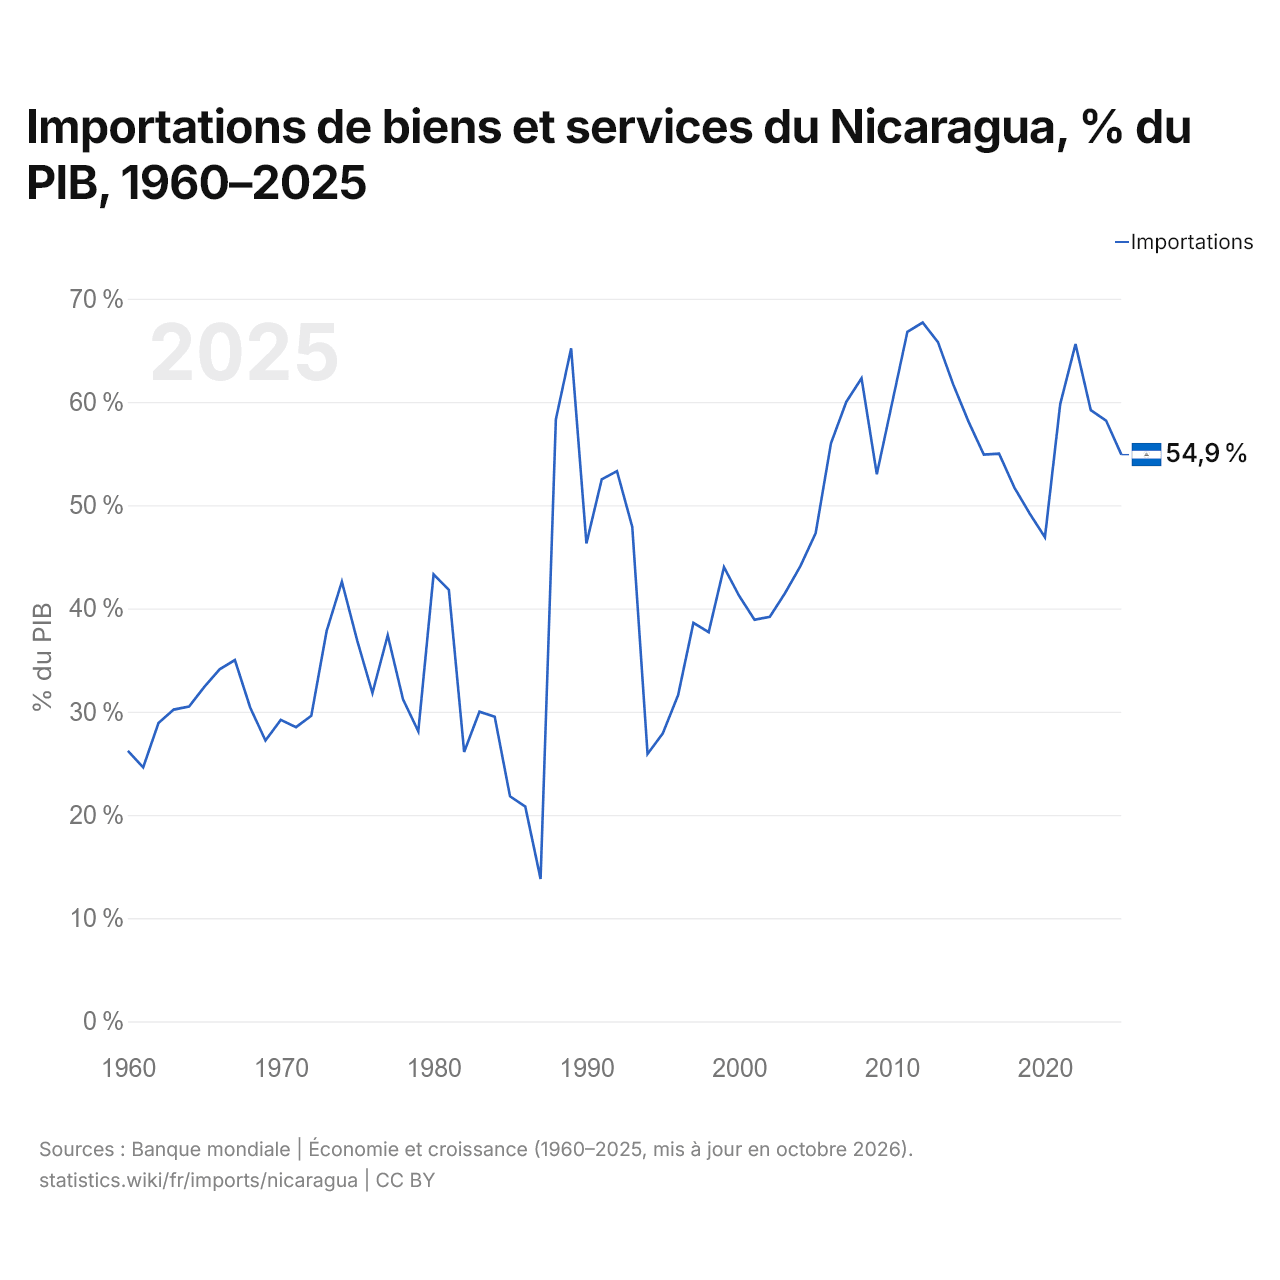
En 2025, les importations de biens et services du Nicaragua équivalaient à 54,9 % de son PIB, contre 26,2 % en 1960. La part la plus élevée a été de 67,7 %, en 2012.
Comparer les importations du Nicaragua avec celles d'autres pays
Sources :
- Banque mondiale | Économie et croissance (1960–2025, mis à jour en octobre 2026)
- TradeMap (2001–2025, mis à jour en octobre 2026)
Creative Commons Attribution (CC BY) : vous pouvez copier, partager, adapter et réutiliser ce contenu, y compris à des fins commerciales, à condition de citer statistics.wiki et d’indiquer les modifications apportées. Les sources citées ci-dessus peuvent avoir leurs propres conditions de licence.