
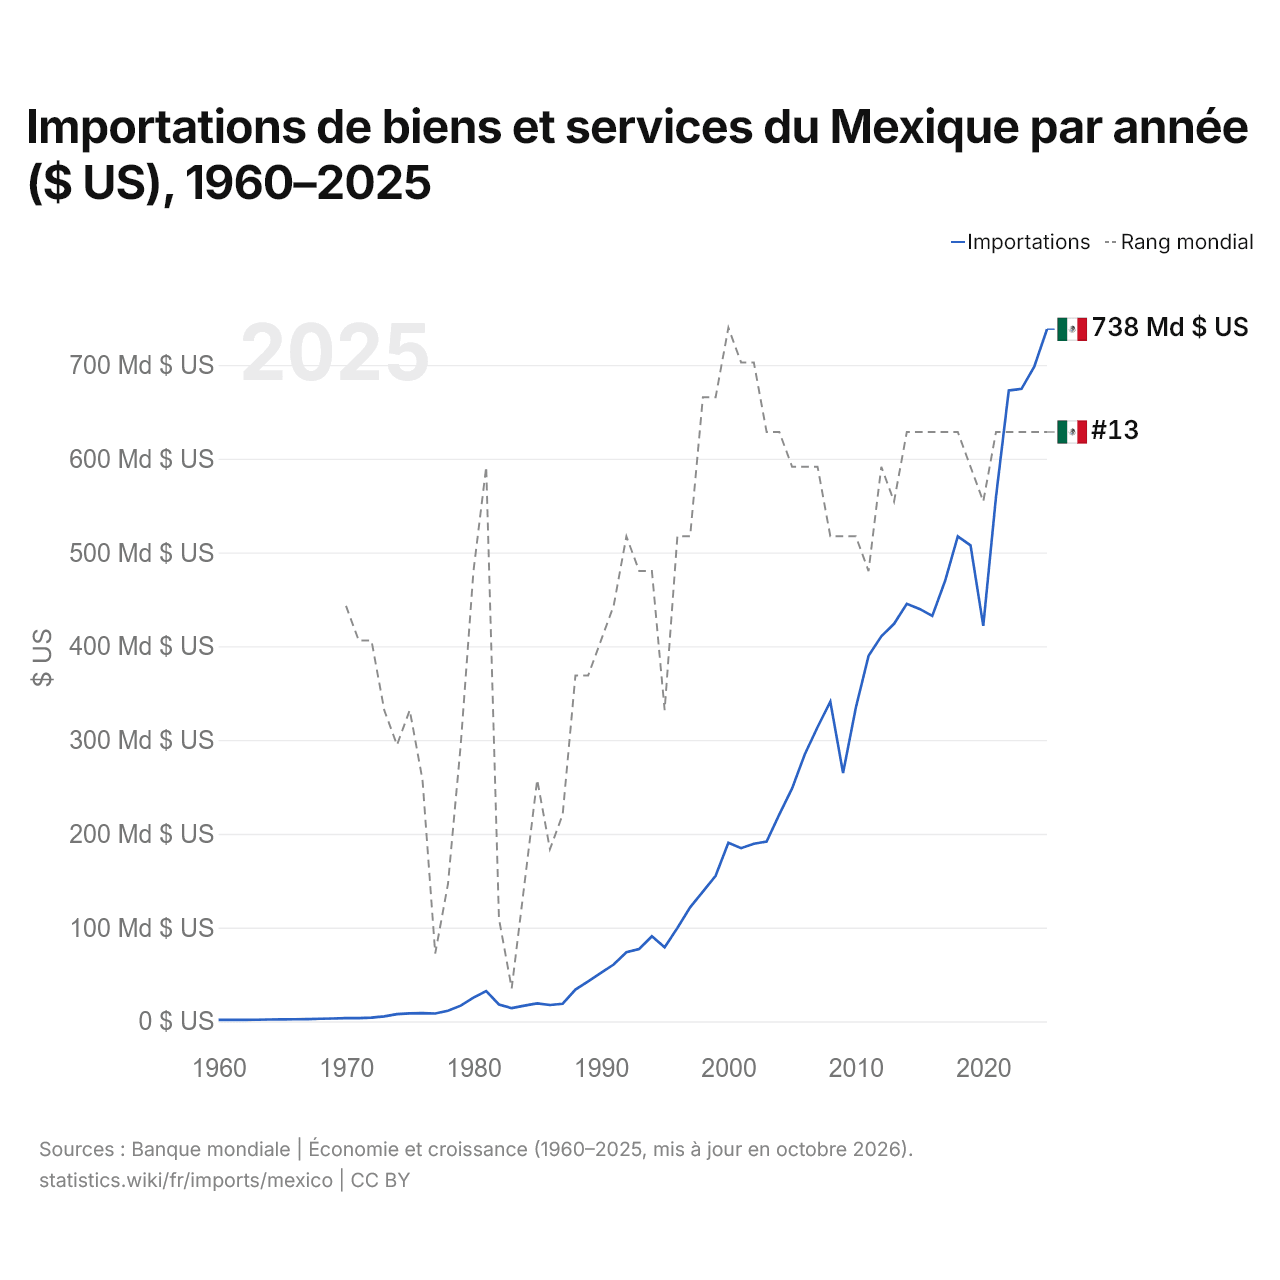
Importations de biens et services du Mexique par année ($ US), 1960–2025
| Année | $ US | Rang mondial |
|---|---|---|
| Importations | Rang mondial | |
| 2025 | 738 162 519 127 $ US | #13 |
| 2024 | 698 190 455 616 $ US | #13 |
| 2023 | 674 539 332 149 $ US | #13 |
| 2022 | 672 827 146 644 $ US | #13 |
| 2021 | 559 543 398 298 $ US | #13 |
| 2020 | 421 735 413 259 $ US | #15 |
| 2019 | 507 718 819 550 $ US | #14 |
| 2018 | 517 202 845 543 $ US | #13 |
| 2017 | 469 597 181 246 $ US | #13 |
| 2016 | 432 376 614 132 $ US | #13 |
| 2015 | 439 821 695 268 $ US | #13 |
| 2014 | 445 312 781 391 $ US | #13 |
| 2013 | 423 928 383 607 $ US | #15 |
| 2012 | 410 653 072 131 $ US | #14 |
| 2011 | 389 836 031 336 $ US | #17 |
| 2010 | 334 456 322 123 $ US | #16 |
| 2009 | 264 902 814 265 $ US | #16 |
| 2008 | 340 860 425 741 $ US | #16 |
| 2007 | 313 922 896 029 $ US | #14 |
| 2006 | 284 933 176 454 $ US | #14 |
| 2005 | 248 437 817 057 $ US | #14 |
| 2004 | 220 739 895 660 $ US | #13 |
| 2003 | 191 730 637 234 $ US | #13 |
| 2002 | 189 355 937 339 $ US | #11 |
| 2001 | 184 678 218 802 $ US | #11 |
| 2000 | 190 555 678 047 $ US | #10 |
| 1999 | 155 258 243 956 $ US | #12 |
| 1998 | 138 306 850 713 $ US | #12 |
| 1997 | 121 630 321 174 $ US | #16 |
| 1996 | 99 589 465 577 $ US | #16 |
| 1995 | 79 072 391 842 $ US | #21 |
| 1994 | 90 814 853 233 $ US | #17 |
| 1993 | 77 229 254 751 $ US | #17 |
| 1992 | 73 709 242 760 $ US | #16 |
| 1991 | 60 602 372 094 $ US | #18 |
| 1990 | 51 768 004 611 $ US | #19 |
| 1989 | 42 503 750 803 $ US | #20 |
| 1988 | 33 950 898 441 $ US | #20 |
| 1987 | 18 775 902 765 $ US | #24 |
| 1986 | 17 390 079 327 $ US | #25 |
| 1985 | 19 065 246 504 $ US | #23 |
| 1984 | 16 774 715 780 $ US | #26 |
| 1983 | 14 025 463 387 $ US | #29 |
| 1982 | 17 919 648 239 $ US | #27 |
| 1981 | 32 330 287 579 $ US | #14 |
| 1980 | 25 269 530 739 $ US | #17 |
| 1979 | 16 750 506 468 $ US | #22 |
| 1978 | 11 332 164 976 $ US | #26 |
| 1977 | 8 373 206 929 $ US | #28 |
| 1976 | 8 769 603 267 $ US | #23 |
| 1975 | 8 465 680 000 $ US | #21 |
| 1974 | 7 612 160 000 $ US | #22 |
| 1973 | 5 232 144 000 $ US | #21 |
| 1972 | 3 991 120 000 $ US | #19 |
| 1971 | 3 417 960 000 $ US | #19 |
| 1970 | 3 430 408 000 $ US | #18 |
| 1969 | 3 011 216 000 $ US | - |
| 1968 | 2 746 232 000 $ US | - |
| 1967 | 2 392 912 000 $ US | - |
| 1966 | 2 192 168 000 $ US | - |
| 1965 | 2 079 752 000 $ US | - |
| 1964 | 1 978 568 000 $ US | - |
| 1963 | 1 688 128 000 $ US | - |
| 1962 | 1 536 528 000 $ US | - |
| 1961 | 1 503 120 000 $ US | - |
| 1960 | 1 520 944 000 $ US | - |
En 2025, les importations de biens et services du Mexique s'élevaient à 738 milliards de dollars, contre 1,52 milliard de dollars en 1960. Le minimum a été de 1,5 milliard de dollars, en 1961. Elles se classaient au 13e rang mondial, un rang qu'elles occupent depuis 2021. Leur meilleur rang a été le 10e, occupé pour la dernière fois en 2000.
En 2025, les importations de biens et services du Mexique étaient les plus élevées de 26 pays situés en Amérique latine. En 2025, les importations du Mexique dépassaient ses exportations de 11,6 milliards de dollars, soit un déficit commercial. Le commerce du Mexique, exportations et importations réunies, équivalait à 79,9 % de son PIB en 2025, au 87e rang mondial.
Importations de biens du Mexique par catégorie, 2025
Importations de biens, 2025: 664 Md $US
En 2025, la première catégorie des importations de biens du Mexique était « machines, électronique et véhicules », avec 55,3 %, suivie de « produits chimiques, pharmaceutiques et plastiques », avec 10,5 %.
Origines des importations de biens du Mexique : les 10 premières, 2025
| Rang | Pays | Importations de biens | Part | |
|---|---|---|---|---|
| 1 |
 États-Unis |
250 Md $US | 37,7 % | vs USA |
| 2 |
 Chine |
133 Md $US | 20,1 % | vs Chine |
| 3 |
 Corée du Sud |
23,1 Md $US | 3,47 % | vs Corée du Sud |
| 4 |
 Vietnam |
22,4 Md $US | 3,37 % | |
| 5 |
 Allemagne |
19,6 Md $US | 2,95 % | |
| 6 |
 Japon |
18,6 Md $US | 2,8 % | vs Japon |
| 7 |
 Malaisie |
15,6 Md $US | 2,35 % | |
| 8 |
 Thaïlande |
13,1 Md $US | 1,98 % | vs Thaïlande |
| 9 |
 Canada |
12,5 Md $US | 1,89 % | vs Canada |
| 10 |
 Brésil |
11,2 Md $US | 1,69 % | vs Brésil |
| Autres partenaires et non précisés | 144 Md $US | 21,8 % |
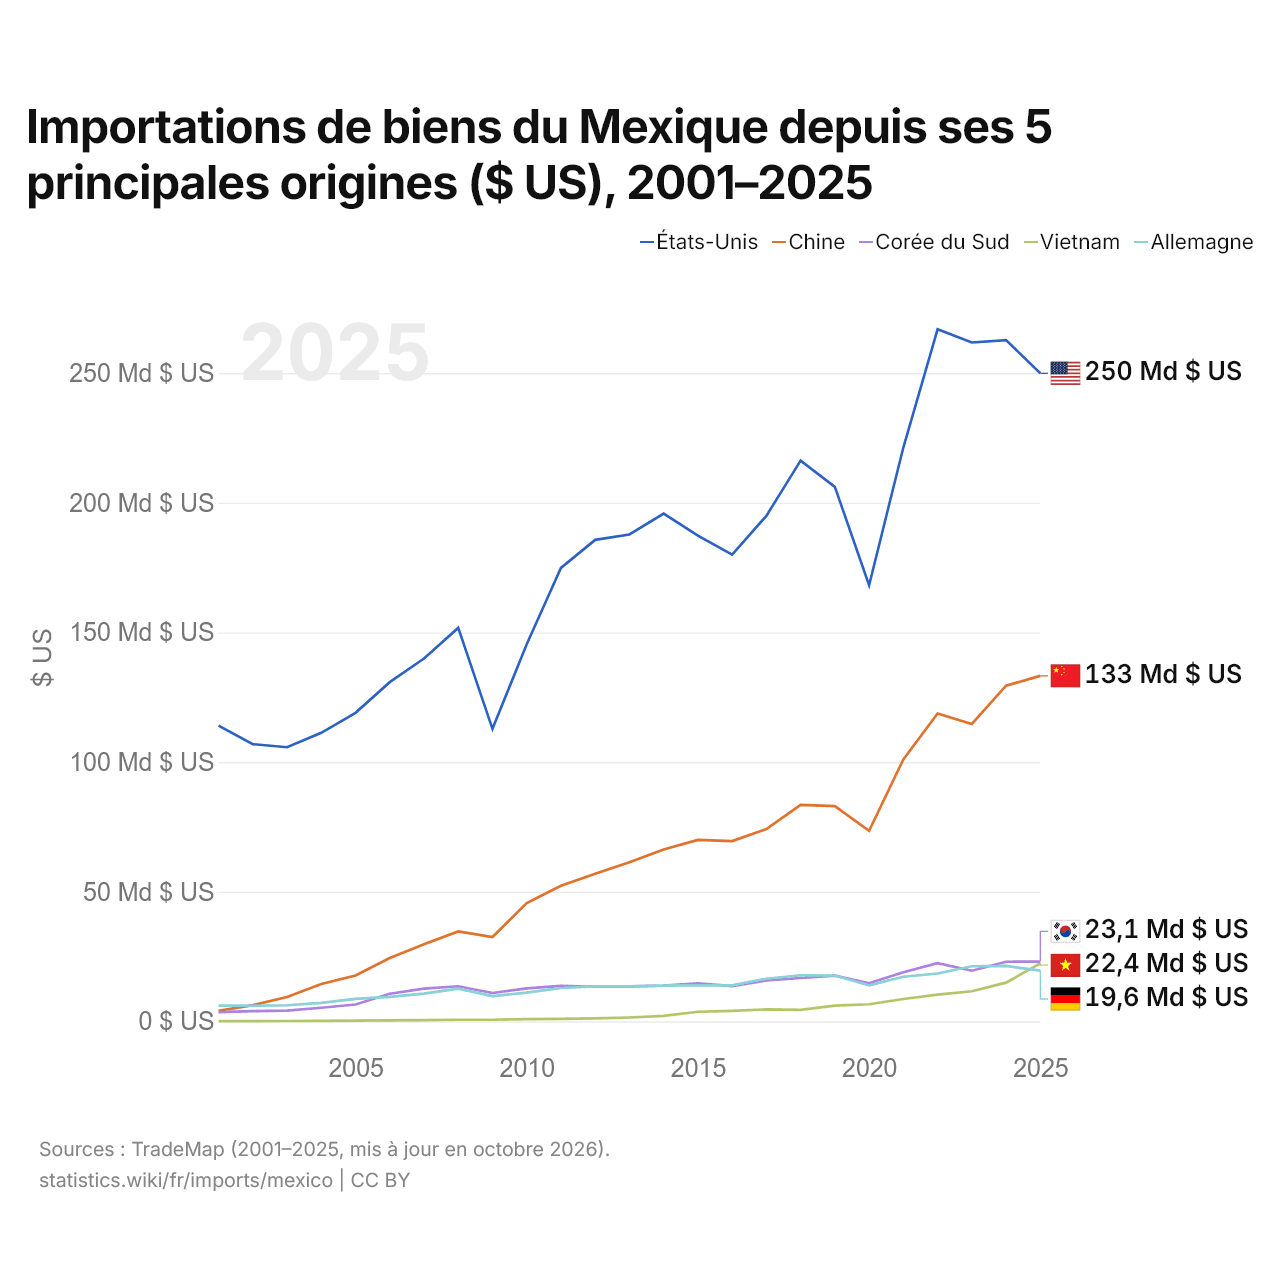
Importations de biens du Mexique depuis ses 5 principales origines ($ US), 2001–2025
| Année | $ US | ||||
|---|---|---|---|---|---|
| États-Unis | Chine | Corée du Sud | Vietnam | Allemagne | |
| 2025 | 249 921 371 000 $ US | 133 243 185 000 $ US | 23 050 564 000 $ US | 22 358 098 000 $ US | 19 560 513 000 $ US |
| 2024 | 262 729 906 000 $ US | 129 454 752 000 $ US | 22 981 977 000 $ US | 14 916 599 000 $ US | 21 356 564 000 $ US |
| 2023 | 261 798 984 000 $ US | 114 677 689 000 $ US | 19 532 225 000 $ US | 11 582 347 000 $ US | 21 232 292 000 $ US |
| 2022 | 266 911 189 000 $ US | 118 727 731 000 $ US | 22 456 244 000 $ US | 10 321 740 000 $ US | 18 447 349 000 $ US |
| 2021 | 221 311 737 000 $ US | 101 020 781 000 $ US | 18 963 157 000 $ US | 8 608 257 000 $ US | 17 214 366 000 $ US |
| 2020 | 168 197 311 000 $ US | 73 505 513 000 $ US | 14 706 375 000 $ US | 6 604 433 000 $ US | 13 871 163 000 $ US |
| 2019 | 206 134 038 000 $ US | 83 030 832 000 $ US | 17 644 003 000 $ US | 6 079 021 000 $ US | 17 679 852 000 $ US |
| 2018 | 216 254 331 000 $ US | 83 504 748 000 $ US | 16 726 998 000 $ US | 4 410 437 000 $ US | 17 761 011 000 $ US |
| 2017 | 194 959 416 000 $ US | 74 145 291 000 $ US | 15 756 395 000 $ US | 4 615 833 000 $ US | 16 420 972 000 $ US |
| 2016 | 179 984 302 000 $ US | 69 520 669 000 $ US | 13 612 211 000 $ US | 4 013 064 000 $ US | 13 877 976 000 $ US |
| 2015 | 187 300 380 000 $ US | 69 987 822 000 $ US | 14 618 851 000 $ US | 3 691 606 000 $ US | 13 974 717 000 $ US |
| 2014 | 195 856 156 000 $ US | 66 257 293 000 $ US | 13 771 102 000 $ US | 2 090 831 000 $ US | 13 762 476 000 $ US |
| 2013 | 187 758 444 000 $ US | 61 321 380 000 $ US | 13 492 971 000 $ US | 1 486 021 000 $ US | 13 460 987 000 $ US |
| 2012 | 185 683 875 000 $ US | 56 936 125 000 $ US | 13 340 966 000 $ US | 1 153 987 000 $ US | 13 507 763 000 $ US |
| 2011 | 174 878 466 000 $ US | 52 247 992 000 $ US | 13 663 756 000 $ US | 973 263 000 $ US | 12 862 639 000 $ US |
| 2010 | 145 450 398 000 $ US | 45 607 548 000 $ US | 12 730 677 000 $ US | 835 805 000 $ US | 11 076 773 000 $ US |
| 2009 | 112 788 740 000 $ US | 32 528 972 000 $ US | 10 946 194 000 $ US | 613 523 000 $ US | 9 727 217 000 $ US |
| 2008 | 151 746 430 000 $ US | 34 690 315 000 $ US | 13 527 288 000 $ US | 614 162 000 $ US | 12 605 734 000 $ US |
| 2007 | 139 930 555 000 $ US | 29 743 657 000 $ US | 12 613 700 000 $ US | 473 284 000 $ US | 10 687 745 000 $ US |
| 2006 | 130 809 817 000 $ US | 24 438 280 000 $ US | 10 621 409 000 $ US | 376 885 000 $ US | 9 437 038 000 $ US |
| 2005 | 118 973 102 000 $ US | 17 696 345 000 $ US | 6 495 910 000 $ US | 274 400 000 $ US | 8 670 434 000 $ US |
| 2004 | 111 262 254 000 $ US | 14 373 446 000 $ US | 5 227 476 000 $ US | 177 533 000 $ US | 7 143 228 000 $ US |
| 2003 | 105 723 447 000 $ US | 9 400 181 000 $ US | 4 112 549 000 $ US | 118 223 000 $ US | 6 217 823 000 $ US |
| 2002 | 106 899 862 000 $ US | 6 273 593 000 $ US | 3 909 340 000 $ US | 108 500 000 $ US | 6 065 064 000 $ US |
| 2001 | 114 059 682 000 $ US | 4 026 826 000 $ US | 3 531 353 000 $ US | 60 960 000 $ US | 6 079 199 000 $ US |
En 2025, les importations de biens s'élevaient à 250 milliards de dollars en provenance des États-Unis, 133 milliards de dollars en provenance de la Chine, 23,1 milliards de dollars en provenance de la Corée du Sud, 22,4 milliards de dollars en provenance du Vietnam et 19,6 milliards de dollars en provenance de l'Allemagne. Le premier rang des cinq fournisseurs du Mexique est occupé par les États-Unis chaque année depuis 2001. Le changement le plus récent dans leur ordre remonte à 2025, quand les importations du Mexique en provenance du Vietnam ont dépassé celles en provenance de l'Allemagne.
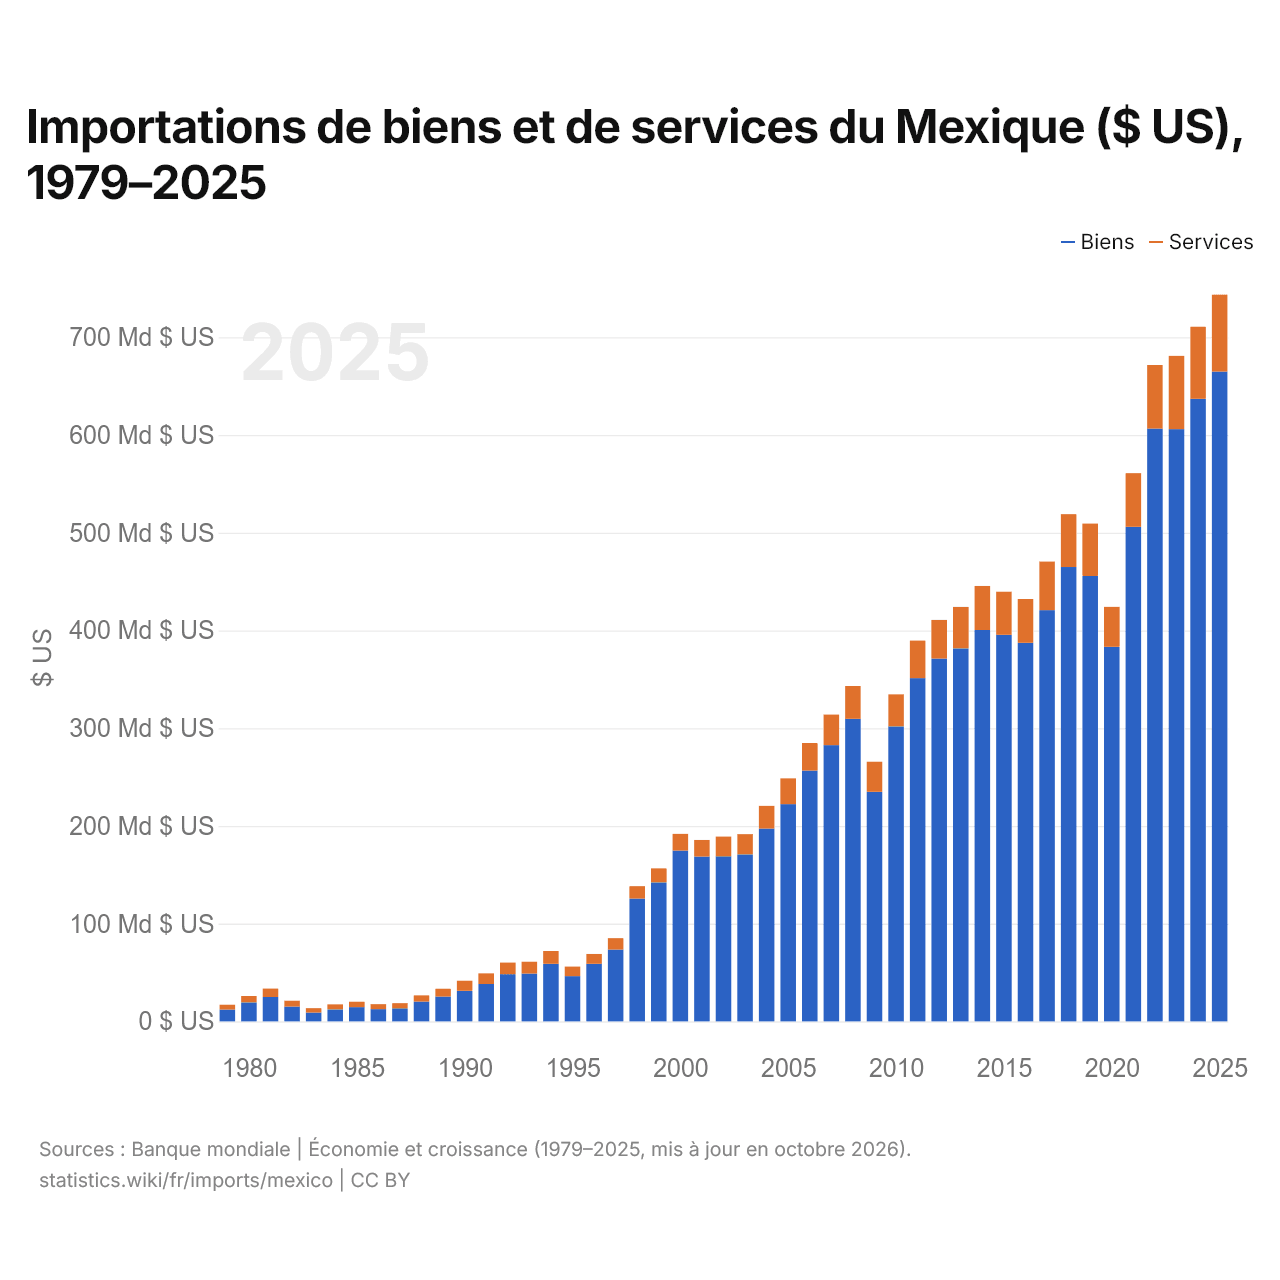
Importations de biens et de services du Mexique ($ US), 1979–2025
| Année | $ US | |
|---|---|---|
| Biens | Services | |
| 2025 | 664 794 063 383 $ US | 78 768 838 260 $ US |
| 2024 | 636 916 176 423 $ US | 73 778 332 547 $ US |
| 2023 | 605 926 876 537 $ US | 74 997 034 082 $ US |
| 2022 | 606 492 491 197 $ US | 65 069 723 034 $ US |
| 2021 | 506 004 611 375 $ US | 54 837 496 584 $ US |
| 2020 | 383 172 226 938 $ US | 40 975 323 282 $ US |
| 2019 | 455 772 065 253 $ US | 53 595 763 683 $ US |
| 2018 | 464 849 865 242 $ US | 54 064 113 903 $ US |
| 2017 | 420 789 004 013 $ US | 49 730 302 304 $ US |
| 2016 | 387 392 025 651 $ US | 44 696 142 717 $ US |
| 2015 | 395 594 899 336 $ US | 44 021 442 229 $ US |
| 2014 | 400 446 681 937 $ US | 45 024 626 831 $ US |
| 2013 | 381 638 213 924 $ US | 42 400 096 240 $ US |
| 2012 | 371 150 584 184 $ US | 39 587 946 932 $ US |
| 2011 | 351 209 140 133 $ US | 38 365 782 030 $ US |
| 2010 | 301 802 682 721 $ US | 32 800 901 865 $ US |
| 2009 | 234 900 589 592 $ US | 30 737 973 714 $ US |
| 2008 | 309 501 288 484 $ US | 33 605 851 291 $ US |
| 2007 | 282 604 374 128 $ US | 31 372 226 732 $ US |
| 2006 | 256 631 277 000 $ US | 28 099 981 443 $ US |
| 2005 | 222 295 367 588 $ US | 26 353 182 391 $ US |
| 2004 | 197 137 414 753 $ US | 23 380 493 712 $ US |
| 2003 | 170 777 886 002 $ US | 20 820 164 426 $ US |
| 2002 | 168 912 830 349 $ US | 20 130 535 013 $ US |
| 2001 | 168 661 014 000 $ US | 16 929 175 335 $ US |
| 2000 | 174 761 226 010 $ US | 17 056 655 990 $ US |
| 1999 | 142 151 199 234 $ US | 14 294 937 766 $ US |
| 1998 | 125 538 311 762 $ US | 12 842 726 238 $ US |
| 1997 | 73 475 800 000 $ US | 11 650 614 000 $ US |
| 1996 | 58 964 000 000 $ US | 9 970 993 000 $ US |
| 1995 | 46 274 200 000 $ US | 9 715 380 000 $ US |
| 1994 | 58 879 800 000 $ US | 13 042 610 000 $ US |
| 1993 | 48 924 000 000 $ US | 12 046 000 000 $ US |
| 1992 | 48 193 000 000 $ US | 11 959 000 000 $ US |
| 1991 | 38 184 000 000 $ US | 10 959 000 000 $ US |
| 1990 | 31 271 000 000 $ US | 10 323 000 000 $ US |
| 1989 | 25 438 000 000 $ US | 7 880 000 000 $ US |
| 1988 | 20 273 000 000 $ US | 6 281 000 000 $ US |
| 1987 | 13 306 000 000 $ US | 5 310 000 000 $ US |
| 1986 | 12 433 000 000 $ US | 5 194 000 000 $ US |
| 1985 | 14 534 000 000 $ US | 5 524 000 000 $ US |
| 1984 | 12 167 000 000 $ US | 5 235 000 000 $ US |
| 1983 | 9 025 000 000 $ US | 4 477 000 000 $ US |
| 1982 | 15 035 000 000 $ US | 6 066 000 000 $ US |
| 1981 | 24 955 000 000 $ US | 8 489 000 000 $ US |
| 1980 | 19 340 000 000 $ US | 6 514 000 000 $ US |
| 1979 | 12 131 000 000 $ US | 4 901 000 000 $ US |
En 2025, les importations de biens du Mexique s'élevaient à 665 milliards de dollars et celles de services à 78,8 milliards de dollars ; les services représentaient 10,6 % du total, contre 28,8 % en 1979.
Le Mexique dans le classement mondial des importations, 2025
| Rang | Pays | Importations | Part mondiale | |
|---|---|---|---|---|
| 10 |
 Italie |
773 Md $US | 2,29 % | vs Italie |
| 11 |
Corée du Sud
|
760 Md $US | 2,25 % | vs Corée du Sud |
| 12 |
Canada
|
747 Md $US | 2,21 % | vs Canada |
| 13 |
 Mexique |
738 Md $US | 2,19 % | |
| 14 |
 Suisse |
721 Md $US | 2,14 % | vs Suisse |
| 15 |
 Irlande |
721 Md $US | 2,14 % | |
| 16 |
 Espagne |
626 Md $US | 1,85 % | vs Espagne |
Importations de biens et services du Mexique, % du PIB, 1960–2025
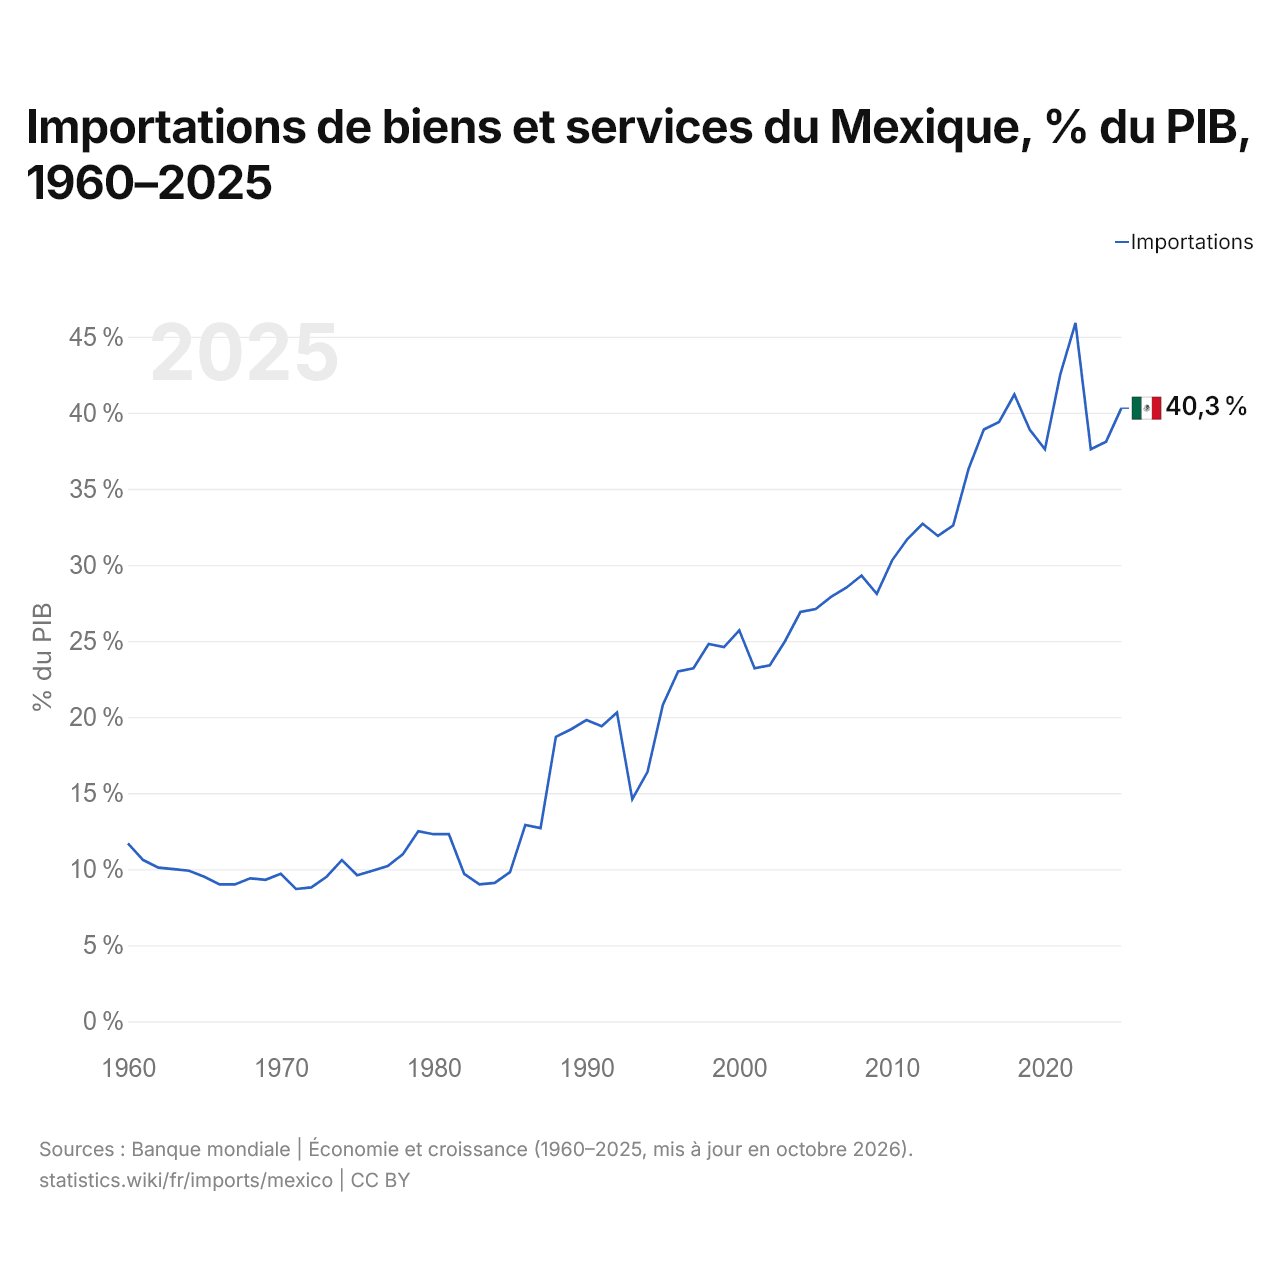
En 2025, les importations de biens et services du Mexique équivalaient à 40,3 % de son PIB, contre 11,7 % en 1960. La part la plus élevée a été de 45,9 %, en 2022.
Comparer les importations du Mexique avec celles d'autres pays
Sources :
- TradeMap (2001–2025, mis à jour en octobre 2026)
- Banque mondiale | Économie et croissance (1960–2025, mis à jour en octobre 2026)
Creative Commons Attribution (CC BY) : vous pouvez copier, partager, adapter et réutiliser ce contenu, y compris à des fins commerciales, à condition de citer statistics.wiki et d’indiquer les modifications apportées. Les sources citées ci-dessus peuvent avoir leurs propres conditions de licence.