
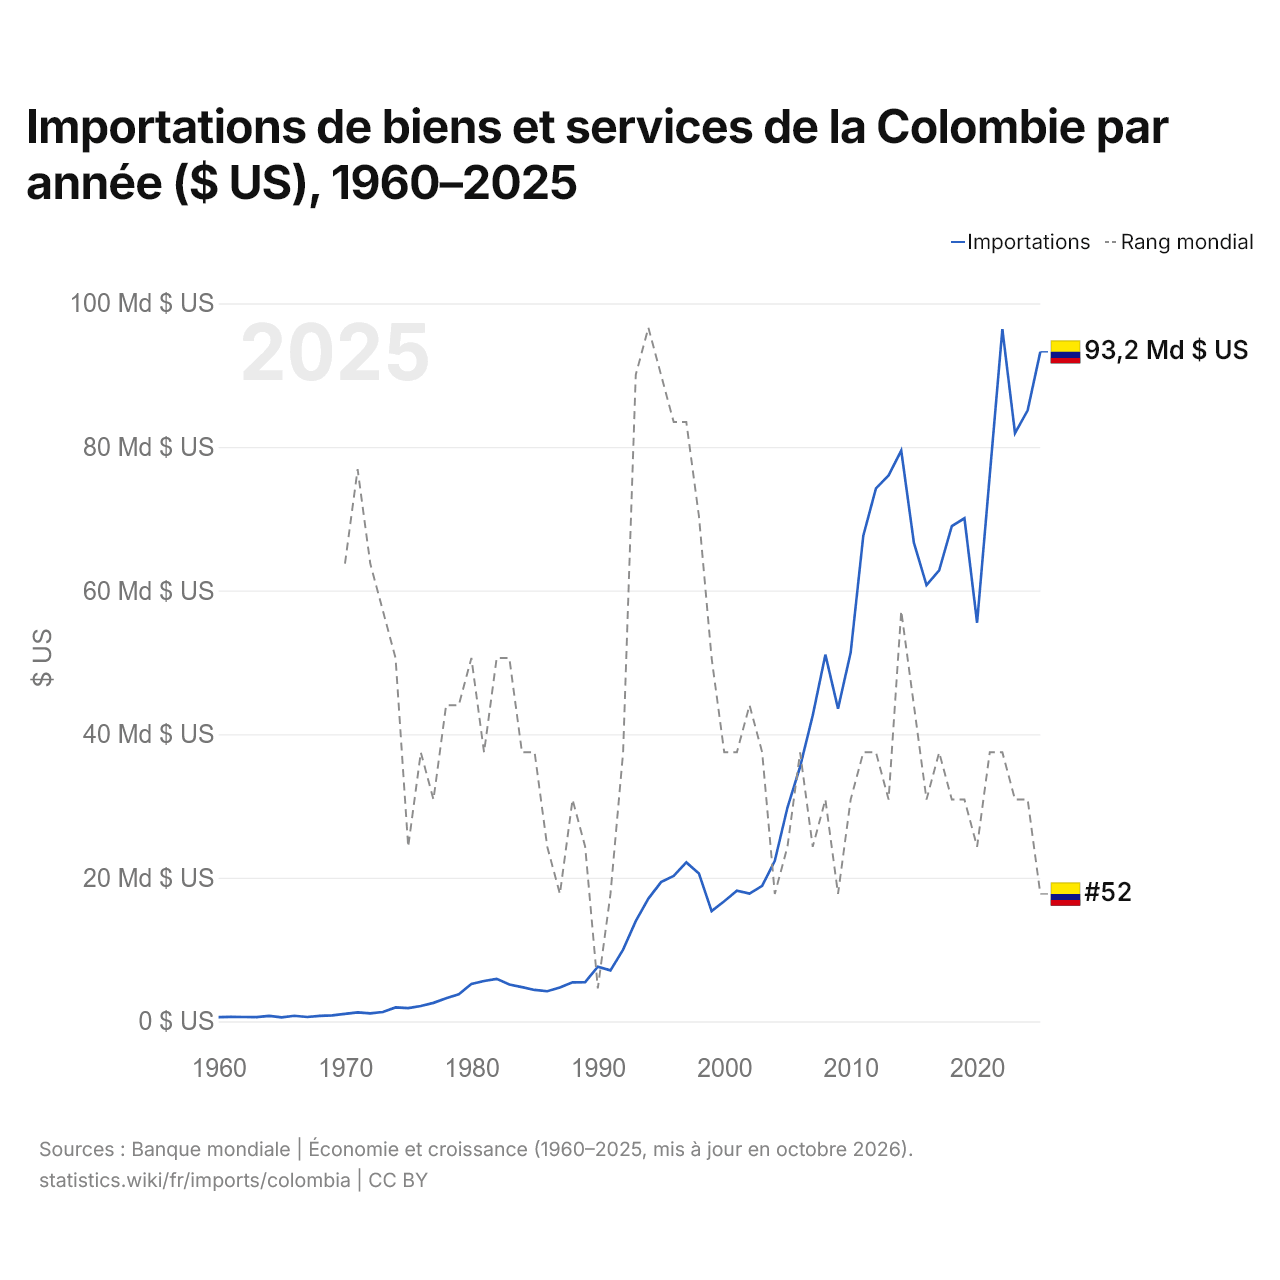
Importations de biens et services de la Colombie par année ($ US), 1960–2025
| Année | $ US | Rang mondial |
|---|---|---|
| Importations | Rang mondial | |
| 2025 | 93 242 618 943 $ US | #52 |
| 2024 | 85 099 669 252 $ US | #50 |
| 2023 | 81 912 779 953 $ US | #50 |
| 2022 | 96 411 719 931 $ US | #49 |
| 2021 | 76 006 795 312 $ US | #49 |
| 2020 | 55 511 423 807 $ US | #51 |
| 2019 | 70 067 176 051 $ US | #50 |
| 2018 | 68 961 912 989 $ US | #50 |
| 2017 | 62 802 582 424 $ US | #49 |
| 2016 | 60 743 865 897 $ US | #50 |
| 2015 | 66 653 739 136 $ US | #48 |
| 2014 | 79 499 076 760 $ US | #46 |
| 2013 | 76 037 444 586 $ US | #50 |
| 2012 | 74 226 993 322 $ US | #49 |
| 2011 | 67 642 788 202 $ US | #49 |
| 2010 | 51 351 305 097 $ US | #50 |
| 2009 | 43 545 176 395 $ US | #52 |
| 2008 | 51 066 655 641 $ US | #50 |
| 2007 | 42 618 891 608 $ US | #51 |
| 2006 | 35 453 316 065 $ US | #49 |
| 2005 | 29 777 716 182 $ US | #51 |
| 2004 | 22 356 075 160 $ US | #52 |
| 2003 | 18 873 043 327 $ US | #49 |
| 2002 | 17 793 883 920 $ US | #48 |
| 2001 | 18 180 843 172 $ US | #49 |
| 2000 | 16 731 018 377 $ US | #49 |
| 1999 | 15 343 463 758 $ US | #47 |
| 1998 | 20 576 289 396 $ US | #44 |
| 1997 | 22 137 740 206 $ US | #42 |
| 1996 | 20 252 680 332 $ US | #42 |
| 1995 | 19 392 751 884 $ US | #41 |
| 1994 | 17 091 698 826 $ US | #40 |
| 1993 | 13 949 161 891 $ US | #41 |
| 1992 | 9 985 578 591 $ US | #49 |
| 1991 | 7 098 679 409 $ US | #52 |
| 1990 | 7 614 454 665 $ US | #54 |
| 1989 | 5 464 066 789 $ US | #51 |
| 1988 | 5 433 539 691 $ US | #50 |
| 1987 | 4 697 932 910 $ US | #52 |
| 1986 | 4 190 788 878 $ US | #51 |
| 1985 | 4 370 638 535 $ US | #49 |
| 1984 | 4 767 852 803 $ US | #49 |
| 1983 | 5 127 945 979 $ US | #47 |
| 1982 | 5 919 610 897 $ US | #47 |
| 1981 | 5 610 414 541 $ US | #49 |
| 1980 | 5 209 514 725 $ US | #47 |
| 1979 | 3 756 624 824 $ US | #48 |
| 1978 | 3 210 026 858 $ US | #48 |
| 1977 | 2 569 926 742 $ US | #50 |
| 1976 | 2 131 690 445 $ US | #49 |
| 1975 | 1 835 324 549 $ US | #51 |
| 1974 | 1 933 488 606 $ US | #47 |
| 1973 | 1 306 397 078 $ US | #46 |
| 1972 | 1 109 769 650 $ US | #45 |
| 1971 | 1 252 577 345 $ US | #43 |
| 1970 | 1 047 700 632 $ US | #45 |
| 1969 | 839 120 872 $ US | - |
| 1968 | 763 579 000 $ US | - |
| 1967 | 602 411 300 $ US | - |
| 1966 | 778 814 815 $ US | - |
| 1965 | 559 333 333 $ US | - |
| 1964 | 755 727 700 $ US | - |
| 1963 | 597 285 656 $ US | - |
| 1962 | 605 929 809 $ US | - |
| 1961 | 627 934 716 $ US | - |
| 1960 | 594 894 695 $ US | - |
En 2025, les importations de biens et services de la Colombie s'élevaient à 93,2 milliards de dollars, contre 595 millions de dollars en 1960. Le maximum a été de 96,4 milliards de dollars, en 2022. Elles se classaient au 52e rang mondial, en baisse par rapport au 50e rang en 2024. Leur meilleur rang a été le 40e, occupé pour la dernière fois en 1994.
En 2025, les importations de biens et services de la Colombie étaient les 5es plus élevées de 26 pays situés en Amérique latine. En 2025, les importations de la Colombie dépassaient ses exportations de 24,7 milliards de dollars, soit un déficit commercial. Le commerce de la Colombie, exportations et importations réunies, équivalait à 35,4 % de son PIB en 2025, au 159e rang mondial.
Importations de biens de la Colombie par catégorie, 2025
Importations de biens, 2025: 70,5 Md $US
En 2025, la première catégorie des importations de biens de la Colombie était « machines, électronique et véhicules », avec 34,0 %, suivie de « produits chimiques, pharmaceutiques et plastiques », avec 19,5 %.
Origines des importations de biens de la Colombie : les 10 premières, 2025
| Rang | Pays | Importations de biens | Part | |
|---|---|---|---|---|
| 1 |
 Chine |
19,4 Md $US | 27,5 % | |
| 2 |
 États-Unis |
16,4 Md $US | 23,2 % | vs USA |
| 3 |
 Mexique |
3,54 Md $US | 5,01 % | vs Mexique |
| 4 |
 Brésil |
3,52 Md $US | 4,99 % | vs Brésil |
| 5 |
 Allemagne |
2,32 Md $US | 3,29 % | |
| 6 |
 Inde |
1,75 Md $US | 2,48 % | |
| 7 |
 Japon |
1,68 Md $US | 2,39 % | vs Japon |
| 8 |
 Corée du Sud |
1,39 Md $US | 1,98 % | |
| 9 |
 Espagne |
1,27 Md $US | 1,8 % | vs Espagne |
| 10 |
 Vietnam |
1,24 Md $US | 1,76 % | vs Vietnam |
| Autres partenaires et non précisés | 18,1 Md $US | 25,6 % |
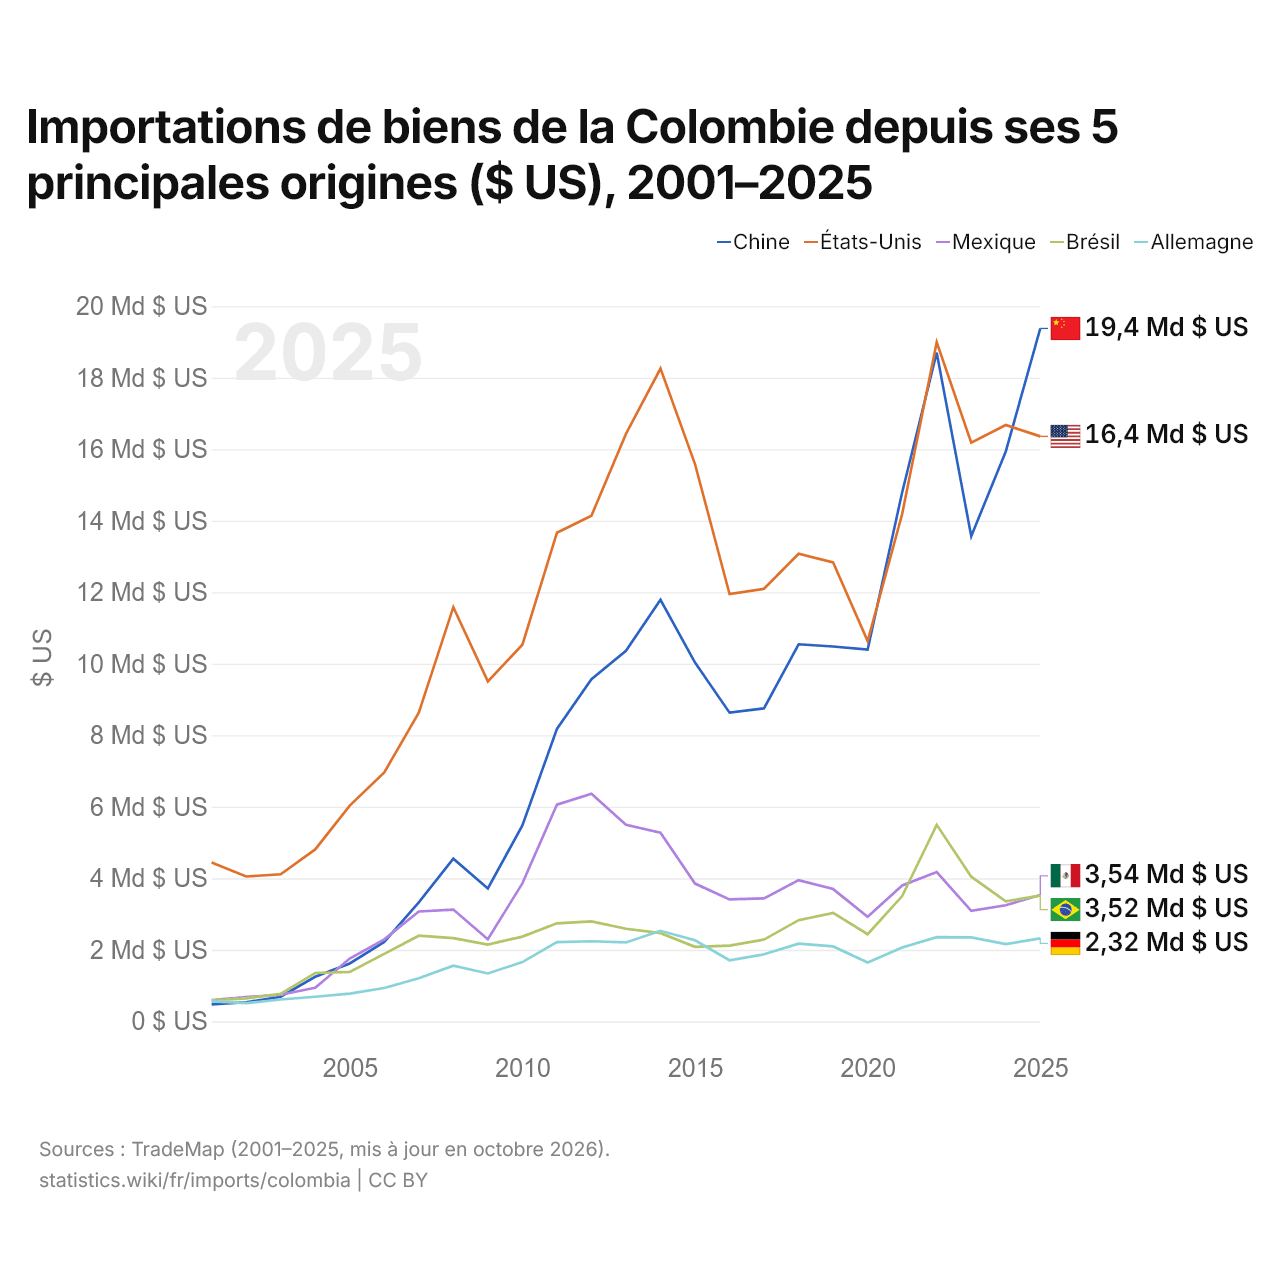
Importations de biens de la Colombie depuis ses 5 principales origines ($ US), 2001–2025
| Année | $ US | ||||
|---|---|---|---|---|---|
| Chine | États-Unis | Mexique | Brésil | Allemagne | |
| 2025 | 19 375 906 000 $ US | 16 357 898 000 $ US | 3 535 327 000 $ US | 3 515 636 000 $ US | 2 320 906 000 $ US |
| 2024 | 15 936 097 000 $ US | 16 677 817 000 $ US | 3 245 099 000 $ US | 3 358 750 000 $ US | 2 159 758 000 $ US |
| 2023 | 13 566 855 000 $ US | 16 181 668 000 $ US | 3 090 355 000 $ US | 4 044 885 000 $ US | 2 347 035 000 $ US |
| 2022 | 18 698 741 000 $ US | 18 990 693 000 $ US | 4 174 746 000 $ US | 5 495 150 000 $ US | 2 352 918 000 $ US |
| 2021 | 14 795 946 000 $ US | 14 191 638 000 $ US | 3 800 480 000 $ US | 3 502 317 000 $ US | 2 065 176 000 $ US |
| 2020 | 10 398 882 000 $ US | 10 634 174 000 $ US | 2 925 827 000 $ US | 2 435 489 000 $ US | 1 643 891 000 $ US |
| 2019 | 10 483 257 000 $ US | 12 832 603 000 $ US | 3 698 549 000 $ US | 3 033 232 000 $ US | 2 094 922 000 $ US |
| 2018 | 10 544 729 000 $ US | 13 075 918 000 $ US | 3 947 394 000 $ US | 2 828 205 000 $ US | 2 173 253 000 $ US |
| 2017 | 8 754 463 000 $ US | 12 096 143 000 $ US | 3 436 895 000 $ US | 2 286 013 000 $ US | 1 873 998 000 $ US |
| 2016 | 8 631 421 000 $ US | 11 946 833 000 $ US | 3 410 737 000 $ US | 2 117 351 000 $ US | 1 707 682 000 $ US |
| 2015 | 10 032 489 000 $ US | 15 583 375 000 $ US | 3 852 940 000 $ US | 2 084 310 000 $ US | 2 267 454 000 $ US |
| 2014 | 11 790 385 000 $ US | 18 256 281 000 $ US | 5 272 632 000 $ US | 2 465 559 000 $ US | 2 530 978 000 $ US |
| 2013 | 10 362 788 000 $ US | 16 428 423 000 $ US | 5 495 958 000 $ US | 2 590 480 000 $ US | 2 206 909 000 $ US |
| 2012 | 9 564 690 000 $ US | 14 140 116 000 $ US | 6 362 176 000 $ US | 2 795 908 000 $ US | 2 239 577 000 $ US |
| 2011 | 8 176 440 000 $ US | 13 663 338 000 $ US | 6 059 027 000 $ US | 2 740 248 000 $ US | 2 215 150 000 $ US |
| 2010 | 5 477 428 000 $ US | 10 531 813 000 $ US | 3 856 674 000 $ US | 2 369 637 000 $ US | 1 657 634 000 $ US |
| 2009 | 3 715 170 000 $ US | 9 505 791 000 $ US | 2 297 888 000 $ US | 2 146 578 000 $ US | 1 338 394 000 $ US |
| 2008 | 4 548 798 000 $ US | 11 583 019 000 $ US | 3 125 980 000 $ US | 2 328 416 000 $ US | 1 557 401 000 $ US |
| 2007 | 3 326 574 000 $ US | 8 631 115 000 $ US | 3 072 565 000 $ US | 2 393 940 000 $ US | 1 204 874 000 $ US |
| 2006 | 2 219 273 000 $ US | 6 960 605 000 $ US | 2 290 571 000 $ US | 1 884 885 000 $ US | 933 215 000 $ US |
| 2005 | 1 616 821 000 $ US | 6 033 241 000 $ US | 1 757 068 000 $ US | 1 383 387 000 $ US | 773 661 000 $ US |
| 2004 | 1 244 730 000 $ US | 4 806 760 000 $ US | 935 642 000 $ US | 1 352 172 000 $ US | 686 601 000 $ US |
| 2003 | 688 673 000 $ US | 4 112 710 000 $ US | 744 375 000 $ US | 769 003 000 $ US | 611 672 000 $ US |
| 2002 | 532 847 000 $ US | 4 051 198 000 $ US | 677 990 000 $ US | 642 840 000 $ US | 508 304 000 $ US |
| 2001 | 475 405 000 $ US | 4 442 775 000 $ US | 596 168 000 $ US | 582 060 000 $ US | 560 090 000 $ US |
En 2025, les importations de biens s'élevaient à 19,4 milliards de dollars en provenance de la Chine, 16,4 milliards de dollars en provenance des États-Unis, 3,54 milliards de dollars en provenance du Mexique, 3,52 milliards de dollars en provenance du Brésil et 2,32 milliards de dollars en provenance de l'Allemagne. Le changement le plus récent dans leur ordre remonte à 2025, quand les importations de la Colombie en provenance de la Chine ont dépassé celles en provenance des États-Unis.
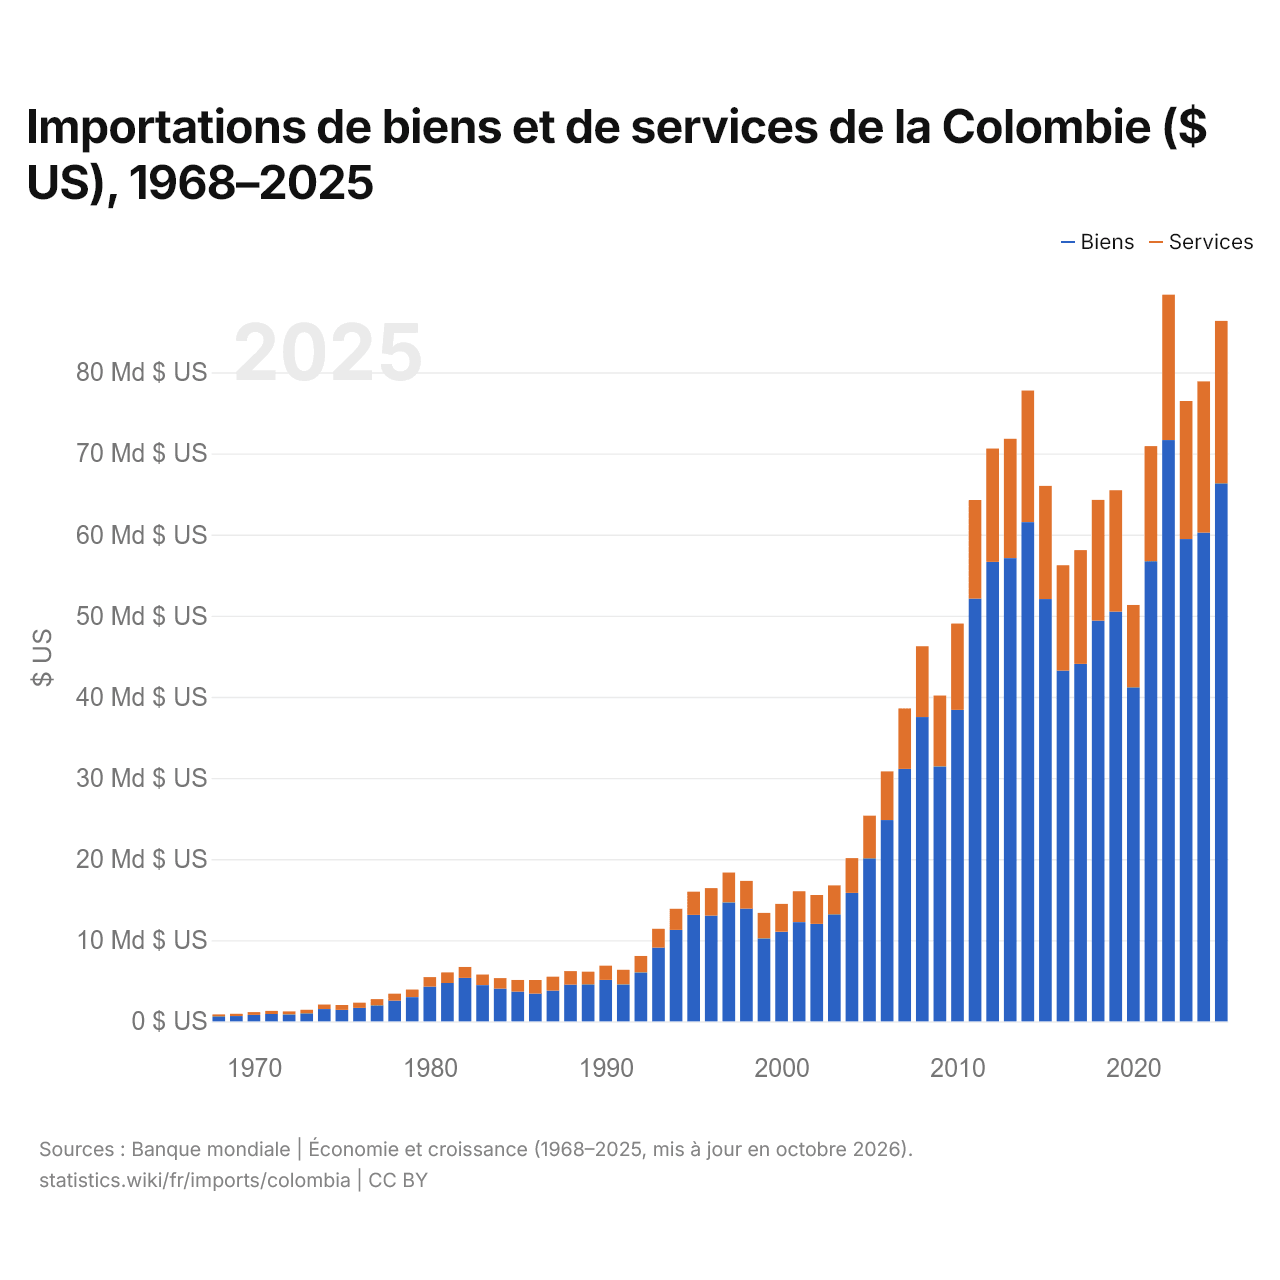
Importations de biens et de services de la Colombie ($ US), 1968–2025
| Année | $ US | |
|---|---|---|
| Biens | Services | |
| 2025 | 66 328 766 502 $ US | 20 013 563 139 $ US |
| 2024 | 60 246 456 266 $ US | 18 649 901 204 $ US |
| 2023 | 59 449 499 191 $ US | 17 016 822 159 $ US |
| 2022 | 71 651 700 641 $ US | 17 926 837 165 $ US |
| 2021 | 56 719 215 736 $ US | 14 194 903 777 $ US |
| 2020 | 41 178 755 257 $ US | 10 149 628 354 $ US |
| 2019 | 50 518 369 961 $ US | 14 953 812 503 $ US |
| 2018 | 49 387 004 272 $ US | 14 893 206 512 $ US |
| 2017 | 44 070 175 427 $ US | 14 012 970 922 $ US |
| 2016 | 43 238 949 428 $ US | 12 981 015 919 $ US |
| 2015 | 52 050 752 073 $ US | 13 960 164 698 $ US |
| 2014 | 61 539 344 538 $ US | 16 219 413 726 $ US |
| 2013 | 57 103 075 809 $ US | 14 714 215 521 $ US |
| 2012 | 56 648 290 244 $ US | 13 968 400 601 $ US |
| 2011 | 52 125 545 572 $ US | 12 134 769 955 $ US |
| 2010 | 38 405 832 816 $ US | 10 625 769 186 $ US |
| 2009 | 31 428 087 783 $ US | 8 727 171 202 $ US |
| 2008 | 37 511 441 261 $ US | 8 732 021 628 $ US |
| 2007 | 31 116 286 688 $ US | 7 452 916 476 $ US |
| 2006 | 24 810 016 105 $ US | 6 003 257 895 $ US |
| 2005 | 20 094 366 338 $ US | 5 261 068 436 $ US |
| 2004 | 15 838 465 835 $ US | 4 276 873 207 $ US |
| 2003 | 13 195 427 392 $ US | 3 565 191 808 $ US |
| 2002 | 12 024 451 426 $ US | 3 546 487 228 $ US |
| 2001 | 12 229 687 350 $ US | 3 803 932 940 $ US |
| 2000 | 11 042 499 113 $ US | 3 435 499 035 $ US |
| 1999 | 10 226 847 963 $ US | 3 141 980 237 $ US |
| 1998 | 13 897 196 770 $ US | 3 414 323 653 $ US |
| 1997 | 14 662 365 510 $ US | 3 686 748 613 $ US |
| 1996 | 13 040 610 502 $ US | 3 384 740 009 $ US |
| 1995 | 13 128 212 189 $ US | 2 859 921 835 $ US |
| 1994 | 11 272 968 517 $ US | 2 605 441 185 $ US |
| 1993 | 9 085 700 000 $ US | 2 320 700 000 $ US |
| 1992 | 6 029 100 000 $ US | 2 028 300 000 $ US |
| 1991 | 4 548 000 000 $ US | 1 812 000 000 $ US |
| 1990 | 5 108 000 000 $ US | 1 750 000 000 $ US |
| 1989 | 4 557 000 000 $ US | 1 565 000 000 $ US |
| 1988 | 4 516 000 000 $ US | 1 670 000 000 $ US |
| 1987 | 3 793 000 000 $ US | 1 709 000 000 $ US |
| 1986 | 3 409 000 000 $ US | 1 684 000 000 $ US |
| 1985 | 3 673 000 000 $ US | 1 427 000 000 $ US |
| 1984 | 4 027 000 000 $ US | 1 298 000 000 $ US |
| 1983 | 4 464 000 000 $ US | 1 302 000 000 $ US |
| 1982 | 5 357 557 650 $ US | 1 346 072 680 $ US |
| 1981 | 4 730 093 040 $ US | 1 295 062 720 $ US |
| 1980 | 4 283 407 770 $ US | 1 170 477 910 $ US |
| 1979 | 2 977 784 000 $ US | 940 932 000 $ US |
| 1978 | 2 552 152 000 $ US | 856 912 000 $ US |
| 1977 | 1 969 694 240 $ US | 773 239 200 $ US |
| 1976 | 1 654 029 080 $ US | 647 323 760 $ US |
| 1975 | 1 414 944 450 $ US | 597 258 300 $ US |
| 1974 | 1 511 357 440 $ US | 565 972 160 $ US |
| 1973 | 982 708 620 $ US | 439 708 460 $ US |
| 1972 | 849 568 300 $ US | 383 170 070 $ US |
| 1971 | 902 512 140 $ US | 382 025 120 $ US |
| 1970 | 802 000 000 $ US | 334 000 000 $ US |
| 1969 | 648 000 000 $ US | 283 000 000 $ US |
| 1968 | 615 000 000 $ US | 243 000 000 $ US |
En 2025, les importations de biens de la Colombie s'élevaient à 66,3 milliards de dollars et celles de services à 20 milliards de dollars ; les services représentaient 23,2 % du total, contre 28,3 % en 1968.
La Colombie dans le classement mondial des importations, 2025
| Rang | Pays | Importations | Part mondiale | |
|---|---|---|---|---|
| 49 |
 Argentine |
101 Md $US | 0,3 % | vs Argentine |
| 50 |
 Irak |
98,3 Md $US | 0,29 % | |
| 51 |
 Maroc |
93,3 Md $US | 0,28 % | vs Maroc |
| 52 |
 Colombie |
93,2 Md $US | 0,28 % | |
| 53 |
 Kazakhstan |
80,3 Md $US | 0,24 % | |
| 54 |
 Bangladesh |
76,8 Md $US | 0,23 % | |
| 55 |
 Pérou |
73,2 Md $US | 0,22 % | vs Pérou |
Importations de biens et services de la Colombie, % du PIB, 1960–2025
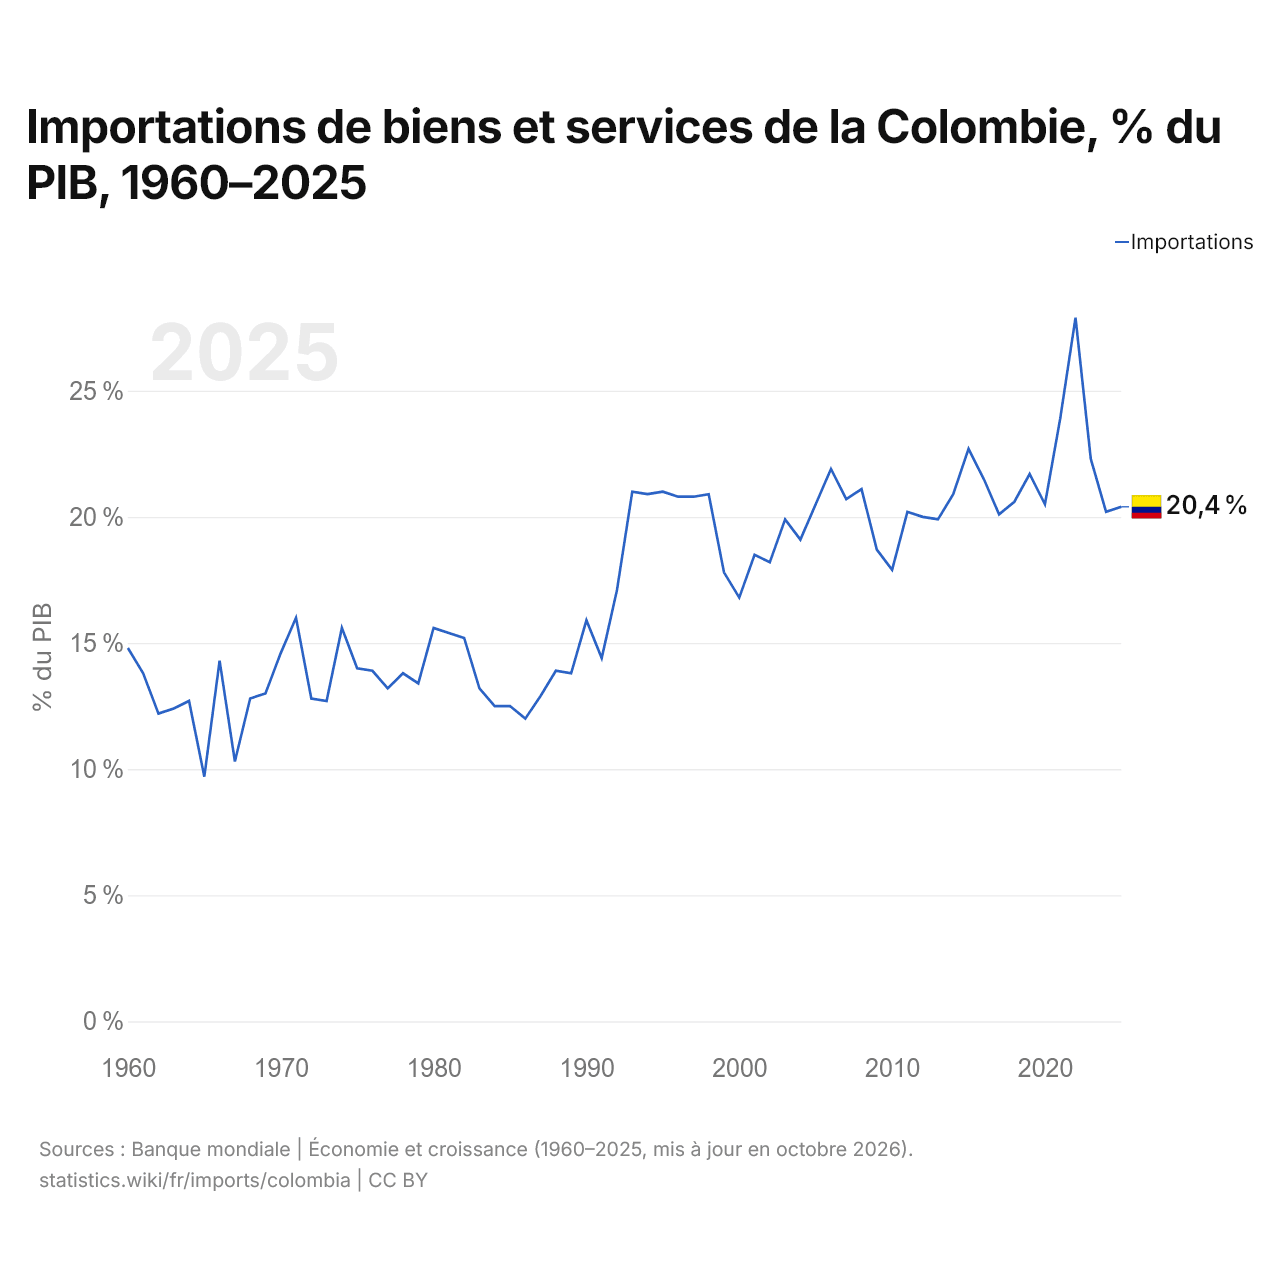
En 2025, les importations de biens et services de la Colombie équivalaient à 20,4 % de son PIB, contre 14,8 % en 1960. La part la plus élevée a été de 27,9 %, en 2022.
Comparer les importations de la Colombie avec celles d'autres pays
Sources :
- Banque mondiale | Économie et croissance (1960–2025, mis à jour en octobre 2026)
- TradeMap (2001–2025, mis à jour en octobre 2026)
Creative Commons Attribution (CC BY) : vous pouvez copier, partager, adapter et réutiliser ce contenu, y compris à des fins commerciales, à condition de citer statistics.wiki et d’indiquer les modifications apportées. Les sources citées ci-dessus peuvent avoir leurs propres conditions de licence.