
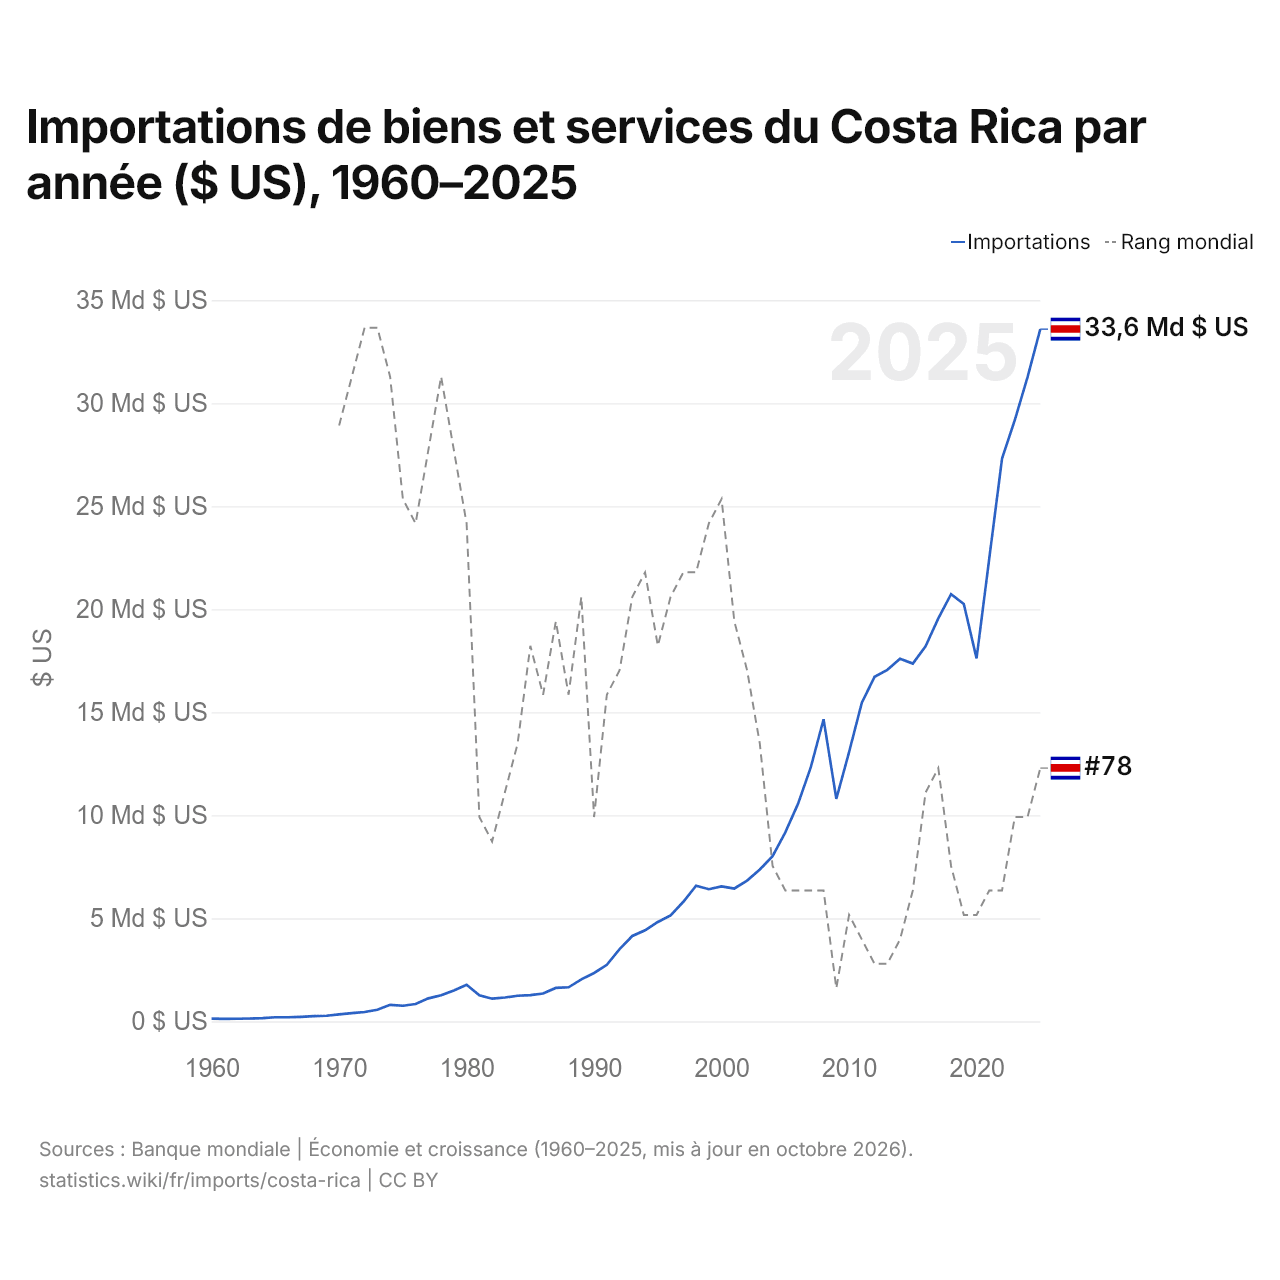
Importations de biens et services du Costa Rica par année ($ US), 1960–2025
| Année | $ US | Rang mondial |
|---|---|---|
| Importations | Rang mondial | |
| 2025 | 33 590 223 066 $ US | #78 |
| 2024 | 31 261 918 867 $ US | #80 |
| 2023 | 29 178 710 518 $ US | #80 |
| 2022 | 27 309 613 389 $ US | #83 |
| 2021 | 22 479 844 381 $ US | #83 |
| 2020 | 17 616 395 175 $ US | #84 |
| 2019 | 20 249 829 099 $ US | #84 |
| 2018 | 20 727 758 739 $ US | #82 |
| 2017 | 19 552 292 618 $ US | #78 |
| 2016 | 18 194 546 421 $ US | #79 |
| 2015 | 17 360 351 936 $ US | #83 |
| 2014 | 17 596 280 747 $ US | #85 |
| 2013 | 17 055 280 057 $ US | #86 |
| 2012 | 16 718 693 890 $ US | #86 |
| 2011 | 15 465 815 617 $ US | #85 |
| 2010 | 13 061 016 911 $ US | #84 |
| 2009 | 10 800 050 872 $ US | #87 |
| 2008 | 14 660 107 004 $ US | #83 |
| 2007 | 12 333 210 843 $ US | #83 |
| 2006 | 10 562 844 205 $ US | #83 |
| 2005 | 9 170 225 580 $ US | #83 |
| 2004 | 8 011 642 043 $ US | #82 |
| 2003 | 7 367 441 178 $ US | #77 |
| 2002 | 6 828 718 248 $ US | #74 |
| 2001 | 6 445 457 476 $ US | #72 |
| 2000 | 6 545 131 899 $ US | #67 |
| 1999 | 6 411 945 533 $ US | #68 |
| 1998 | 6 578 730 511 $ US | #70 |
| 1997 | 5 803 237 747 $ US | #70 |
| 1996 | 5 143 781 715 $ US | #71 |
| 1995 | 4 821 923 955 $ US | #73 |
| 1994 | 4 417 576 105 $ US | #70 |
| 1993 | 4 143 011 092 $ US | #71 |
| 1992 | 3 501 782 363 $ US | #74 |
| 1991 | 2 744 397 215 $ US | #75 |
| 1990 | 2 347 212 148 $ US | #80 |
| 1989 | 2 033 817 039 $ US | #71 |
| 1988 | 1 652 553 107 $ US | #75 |
| 1987 | 1 621 277 680 $ US | #72 |
| 1986 | 1 347 578 853 $ US | #75 |
| 1985 | 1 272 805 941 $ US | #73 |
| 1984 | 1 243 520 405 $ US | #77 |
| 1983 | 1 157 473 274 $ US | #79 |
| 1982 | 1 099 079 477 $ US | #81 |
| 1981 | 1 264 048 112 $ US | #80 |
| 1980 | 1 778 891 482 $ US | #68 |
| 1979 | 1 500 945 158 $ US | #65 |
| 1978 | 1 269 463 244 $ US | #62 |
| 1977 | 1 116 359 393 $ US | #65 |
| 1976 | 842 240 373 $ US | #68 |
| 1975 | 755 869 312 $ US | #67 |
| 1974 | 801 954 603 $ US | #62 |
| 1973 | 563 763 567 $ US | #60 |
| 1972 | 453 262 999 $ US | #60 |
| 1971 | 399 678 048 $ US | #62 |
| 1970 | 340 543 396 $ US | #64 |
| 1969 | 272 754 717 $ US | - |
| 1968 | 251 154 717 $ US | - |
| 1967 | 218 369 811 $ US | - |
| 1966 | 199 200 000 $ US | - |
| 1965 | 196 800 000 $ US | - |
| 1964 | 155 005 188 $ US | - |
| 1963 | 138 870 092 $ US | - |
| 1962 | 124 825 191 $ US | - |
| 1961 | 122 861 638 $ US | - |
| 1960 | 132 338 591 $ US | - |
En 2025, les importations de biens et services du Costa Rica s'élevaient à 33,6 milliards de dollars, contre 132 millions de dollars en 1960. Le minimum a été de 123 millions de dollars, en 1961. Elles se classaient au 78e rang mondial, en hausse par rapport au 80e rang en 2024. Leur meilleur rang a été le 60e, occupé pour la dernière fois en 1973.
En 2025, les importations de biens et services du Costa Rica étaient les 11es plus élevées de 26 pays situés en Amérique latine. En 2025, les exportations du Costa Rica dépassaient ses importations de 6,39 milliards de dollars, soit un excédent commercial. Le commerce du Costa Rica, exportations et importations réunies, équivalait à 71,5 % de son PIB en 2025, au 102e rang mondial.
Importations de biens du Costa Rica par catégorie, 2025
Importations de biens, 2025: 25,1 Md $US
En 2025, la première catégorie des importations de biens du Costa Rica était « machines, électronique et véhicules », avec 33,4 %, suivie de « produits chimiques, pharmaceutiques et plastiques », avec 19,2 %.
Origines des importations de biens du Costa Rica : les 10 premières, 2025
| Rang | Pays | Importations de biens | Part | |
|---|---|---|---|---|
| 1 |
 États-Unis |
9,24 Md $US | 36,8 % | |
| 2 |
 Chine |
4,63 Md $US | 18,4 % | |
| 3 |
 Mexique |
1,52 Md $US | 6,05 % | |
| 4 |
 Allemagne |
695 M $US | 2,77 % | |
| 5 |
 Guatemala |
622 M $US | 2,48 % | |
| 6 |
 Japon |
534 M $US | 2,13 % | |
| 7 |
 Brésil |
500 M $US | 1,99 % | |
| 8 |
 Espagne |
471 M $US | 1,88 % | |
| 9 |
 Colombie |
470 M $US | 1,87 % | |
| 10 |
 Chili |
409 M $US | 1,63 % | |
| Autres partenaires et non précisés | 6,03 Md $US | 24 % |
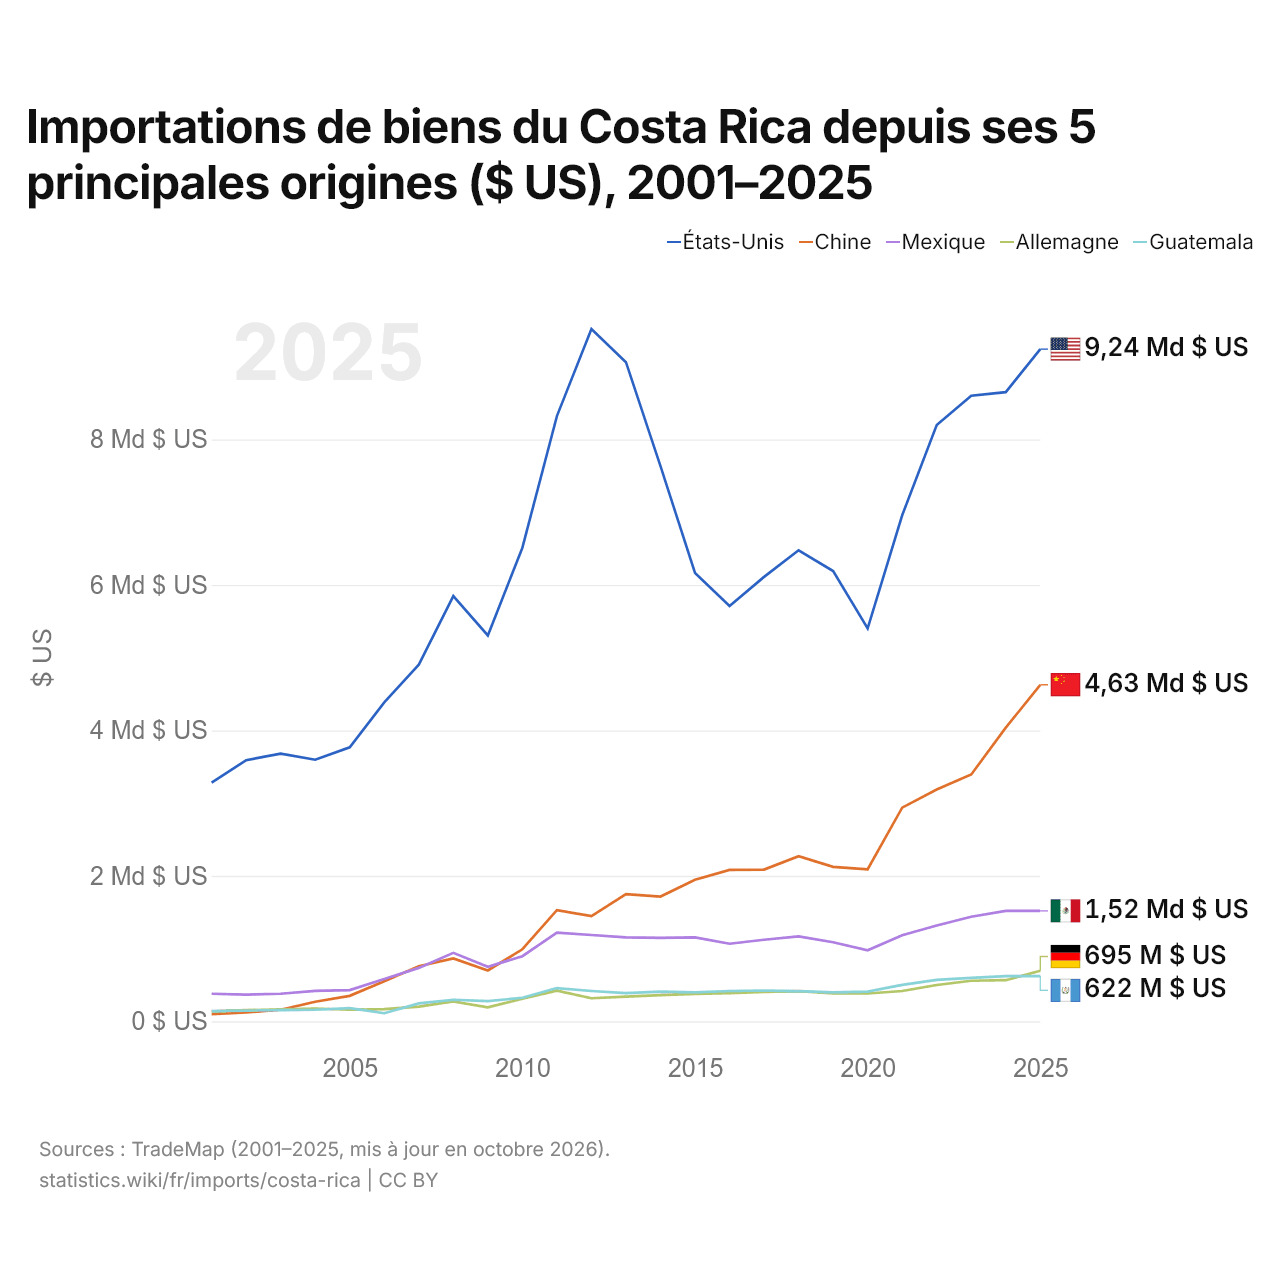
Importations de biens du Costa Rica depuis ses 5 principales origines ($ US), 2001–2025
| Année | $ US | ||||
|---|---|---|---|---|---|
| États-Unis | Chine | Mexique | Allemagne | Guatemala | |
| 2025 | 9 241 852 000 $ US | 4 626 877 000 $ US | 1 518 764 000 $ US | 694 627 000 $ US | 622 292 000 $ US |
| 2024 | 8 649 619 000 $ US | 4 037 317 000 $ US | 1 518 753 000 $ US | 565 774 000 $ US | 621 656 000 $ US |
| 2023 | 8 601 472 000 $ US | 3 393 315 000 $ US | 1 438 218 000 $ US | 557 395 000 $ US | 598 119 000 $ US |
| 2022 | 8 198 697 000 $ US | 3 186 227 000 $ US | 1 318 375 000 $ US | 498 932 000 $ US | 570 177 000 $ US |
| 2021 | 6 957 238 000 $ US | 2 937 921 000 $ US | 1 183 216 000 $ US | 417 410 000 $ US | 500 399 000 $ US |
| 2020 | 5 401 453 000 $ US | 2 091 009 000 $ US | 976 557 000 $ US | 382 556 000 $ US | 408 059 000 $ US |
| 2019 | 6 190 371 000 $ US | 2 123 512 000 $ US | 1 087 646 000 $ US | 384 582 000 $ US | 398 644 000 $ US |
| 2018 | 6 476 111 000 $ US | 2 271 149 000 $ US | 1 166 907 000 $ US | 414 752 000 $ US | 415 226 000 $ US |
| 2017 | 6 110 144 000 $ US | 2 086 590 000 $ US | 1 122 229 000 $ US | 404 504 000 $ US | 422 010 000 $ US |
| 2016 | 5 711 190 000 $ US | 2 082 233 000 $ US | 1 067 140 000 $ US | 388 286 000 $ US | 416 693 000 $ US |
| 2015 | 6 164 480 000 $ US | 1 947 536 000 $ US | 1 153 294 000 $ US | 378 493 000 $ US | 399 177 000 $ US |
| 2014 | 7 632 681 000 $ US | 1 715 660 000 $ US | 1 147 126 000 $ US | 360 603 000 $ US | 408 973 000 $ US |
| 2013 | 9 062 536 000 $ US | 1 748 360 000 $ US | 1 155 030 000 $ US | 338 874 000 $ US | 387 393 000 $ US |
| 2012 | 9 519 474 000 $ US | 1 446 073 000 $ US | 1 187 066 000 $ US | 317 516 000 $ US | 416 946 000 $ US |
| 2011 | 8 321 503 000 $ US | 1 528 463 000 $ US | 1 220 645 000 $ US | 421 327 000 $ US | 457 271 000 $ US |
| 2010 | 6 511 661 000 $ US | 990 685 000 $ US | 895 611 000 $ US | 310 332 000 $ US | 324 038 000 $ US |
| 2009 | 5 305 097 000 $ US | 699 564 000 $ US | 750 074 000 $ US | 191 434 000 $ US | 277 787 000 $ US |
| 2008 | 5 846 372 000 $ US | 865 438 000 $ US | 941 184 000 $ US | 272 040 000 $ US | 296 783 000 $ US |
| 2007 | 4 902 825 000 $ US | 758 444 000 $ US | 734 755 000 $ US | 202 543 000 $ US | 246 670 000 $ US |
| 2006 | 4 385 917 000 $ US | 550 652 000 $ US | 581 206 000 $ US | 168 293 000 $ US | 111 314 000 $ US |
| 2005 | 3 767 193 000 $ US | 350 222 000 $ US | 429 712 000 $ US | 158 983 000 $ US | 181 249 000 $ US |
| 2004 | 3 596 380 000 $ US | 270 006 000 $ US | 417 774 000 $ US | 175 909 000 $ US | 158 767 000 $ US |
| 2003 | 3 679 594 000 $ US | 159 086 000 $ US | 378 780 000 $ US | 165 300 000 $ US | 153 968 000 $ US |
| 2002 | 3 590 156 000 $ US | 121 178 000 $ US | 367 992 000 $ US | 153 550 000 $ US | 147 342 000 $ US |
| 2001 | 3 280 213 000 $ US | 100 177 000 $ US | 379 537 000 $ US | 136 761 000 $ US | 140 745 000 $ US |
En 2025, les importations de biens s'élevaient à 9,24 milliards de dollars en provenance des États-Unis, 4,63 milliards de dollars en provenance de la Chine, 1,52 milliard de dollars en provenance du Mexique, 695 millions de dollars en provenance de l'Allemagne et 622 millions de dollars en provenance du Guatemala. Le premier rang des cinq fournisseurs du Costa Rica est occupé par les États-Unis chaque année depuis 2001. Le changement le plus récent dans leur ordre remonte à 2025, quand les importations du Costa Rica en provenance de l'Allemagne ont dépassé celles en provenance du Guatemala.
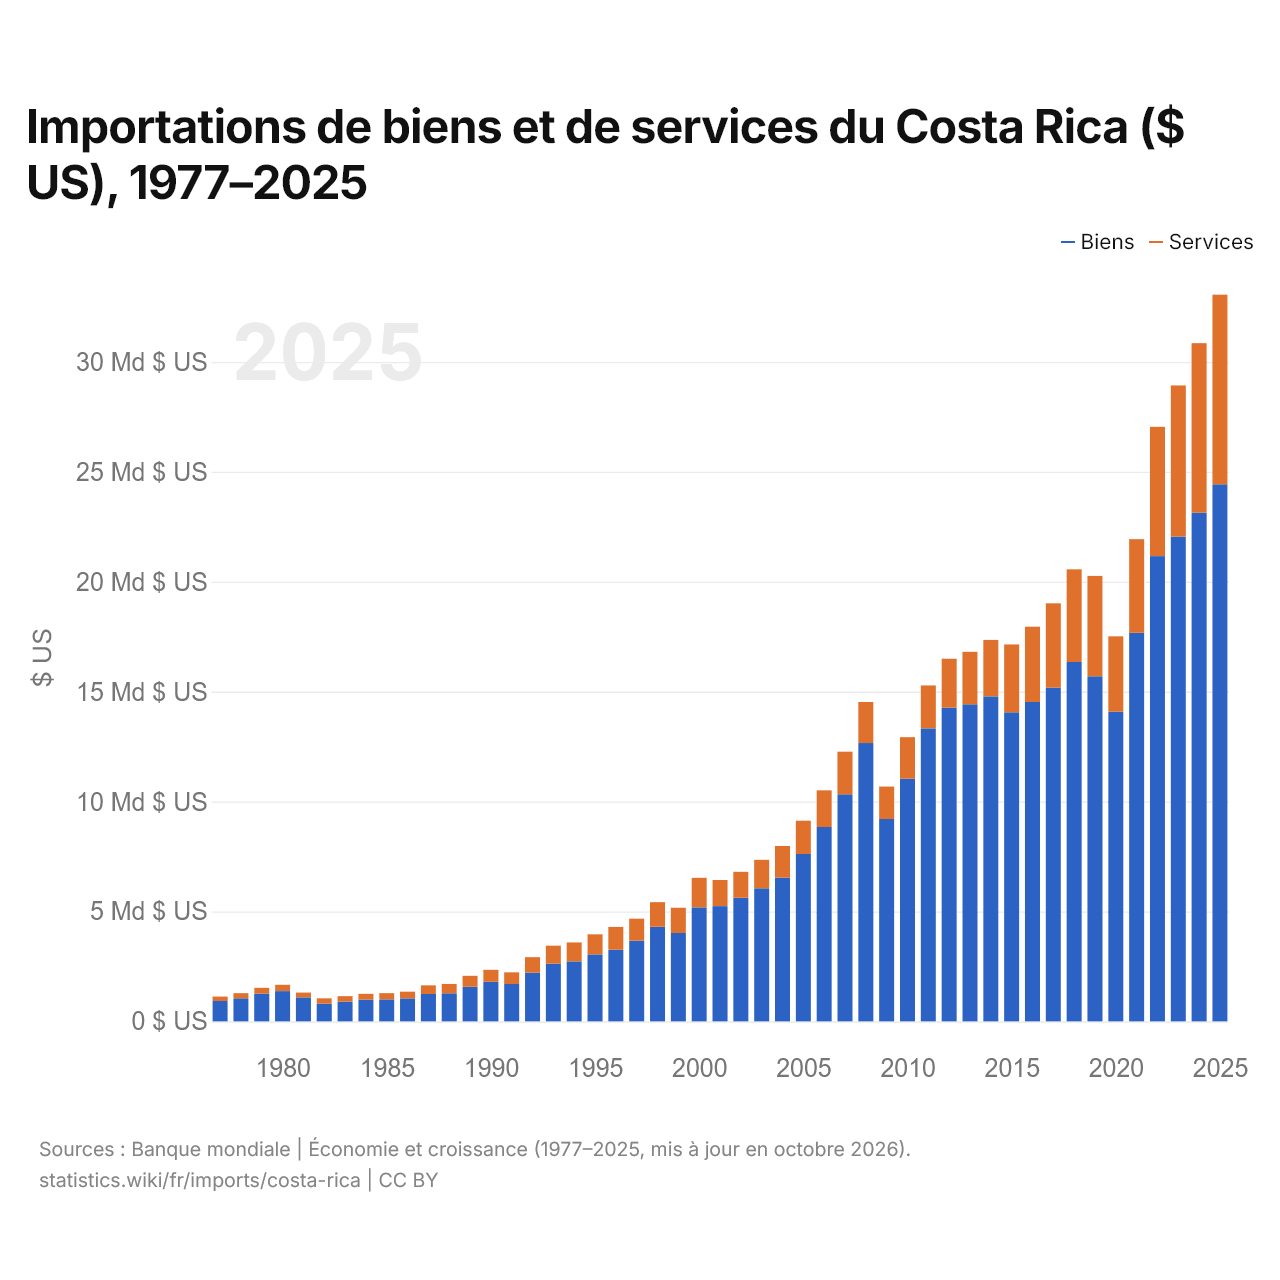
Importations de biens et de services du Costa Rica ($ US), 1977–2025
| Année | $ US | |
|---|---|---|
| Biens | Services | |
| 2025 | 24 433 751 090 $ US | 8 623 708 454 $ US |
| 2024 | 23 140 040 620 $ US | 7 708 348 886 $ US |
| 2023 | 22 049 055 859 $ US | 6 879 877 326 $ US |
| 2022 | 21 162 878 825 $ US | 5 885 521 370 $ US |
| 2021 | 17 670 962 046 $ US | 4 267 299 494 $ US |
| 2020 | 14 085 001 057 $ US | 3 430 724 701 $ US |
| 2019 | 15 699 976 060 $ US | 4 562 113 529 $ US |
| 2018 | 16 350 138 995 $ US | 4 211 934 647 $ US |
| 2017 | 15 177 744 070 $ US | 3 837 297 134 $ US |
| 2016 | 14 526 327 122 $ US | 3 427 283 777 $ US |
| 2015 | 14 059 490 160 $ US | 3 084 947 874 $ US |
| 2014 | 14 784 329 141 $ US | 2 566 783 623 $ US |
| 2013 | 14 425 143 237 $ US | 2 385 563 960 $ US |
| 2012 | 14 270 608 616 $ US | 2 224 247 112 $ US |
| 2011 | 13 328 708 868 $ US | 1 949 447 654 $ US |
| 2010 | 11 040 420 104 $ US | 1 889 337 758 $ US |
| 2009 | 9 204 799 910 $ US | 1 475 883 372 $ US |
| 2008 | 12 658 936 708 $ US | 1 866 649 740 $ US |
| 2007 | 10 329 450 733 $ US | 1 935 958 305 $ US |
| 2006 | 8 843 306 159 $ US | 1 666 816 875 $ US |
| 2005 | 7 615 032 590 $ US | 1 511 664 439 $ US |
| 2004 | 6 542 506 146 $ US | 1 435 822 845 $ US |
| 2003 | 6 055 850 847 $ US | 1 290 848 832 $ US |
| 2002 | 5 618 948 179 $ US | 1 184 438 127 $ US |
| 2001 | 5 240 709 291 $ US | 1 187 654 706 $ US |
| 2000 | 5 180 937 181 $ US | 1 347 920 224 $ US |
| 1999 | 4 021 752 000 $ US | 1 146 247 116 $ US |
| 1998 | 4 300 310 000 $ US | 1 117 810 000 $ US |
| 1997 | 3 674 760 000 $ US | 996 160 000 $ US |
| 1996 | 3 259 380 000 $ US | 1 034 890 000 $ US |
| 1995 | 3 046 100 000 $ US | 914 442 000 $ US |
| 1994 | 2 727 800 000 $ US | 860 100 000 $ US |
| 1993 | 2 627 600 000 $ US | 816 400 000 $ US |
| 1992 | 2 210 900 000 $ US | 710 600 000 $ US |
| 1991 | 1 697 600 000 $ US | 534 800 000 $ US |
| 1990 | 1 796 700 000 $ US | 549 700 000 $ US |
| 1989 | 1 572 000 000 $ US | 496 000 000 $ US |
| 1988 | 1 278 600 000 $ US | 423 700 000 $ US |
| 1987 | 1 245 200 000 $ US | 391 100 000 $ US |
| 1986 | 1 045 200 000 $ US | 303 600 000 $ US |
| 1985 | 1 001 000 000 $ US | 281 700 000 $ US |
| 1984 | 992 900 000 $ US | 261 300 000 $ US |
| 1983 | 894 300 000 $ US | 253 400 000 $ US |
| 1982 | 804 900 000 $ US | 240 300 000 $ US |
| 1981 | 1 090 600 000 $ US | 217 000 000 $ US |
| 1980 | 1 375 200 000 $ US | 286 200 000 $ US |
| 1979 | 1 257 200 000 $ US | 266 800 000 $ US |
| 1978 | 1 049 400 000 $ US | 228 700 000 $ US |
| 1977 | 925 100 000 $ US | 199 000 000 $ US |
En 2025, les importations de biens du Costa Rica s'élevaient à 24,4 milliards de dollars et celles de services à 8,62 milliards de dollars ; les services représentaient 26,1 % du total, contre 17,7 % en 1977.
Le Costa Rica dans le classement mondial des importations, 2025







Importations de biens et services du Costa Rica, % du PIB, 1960–2025
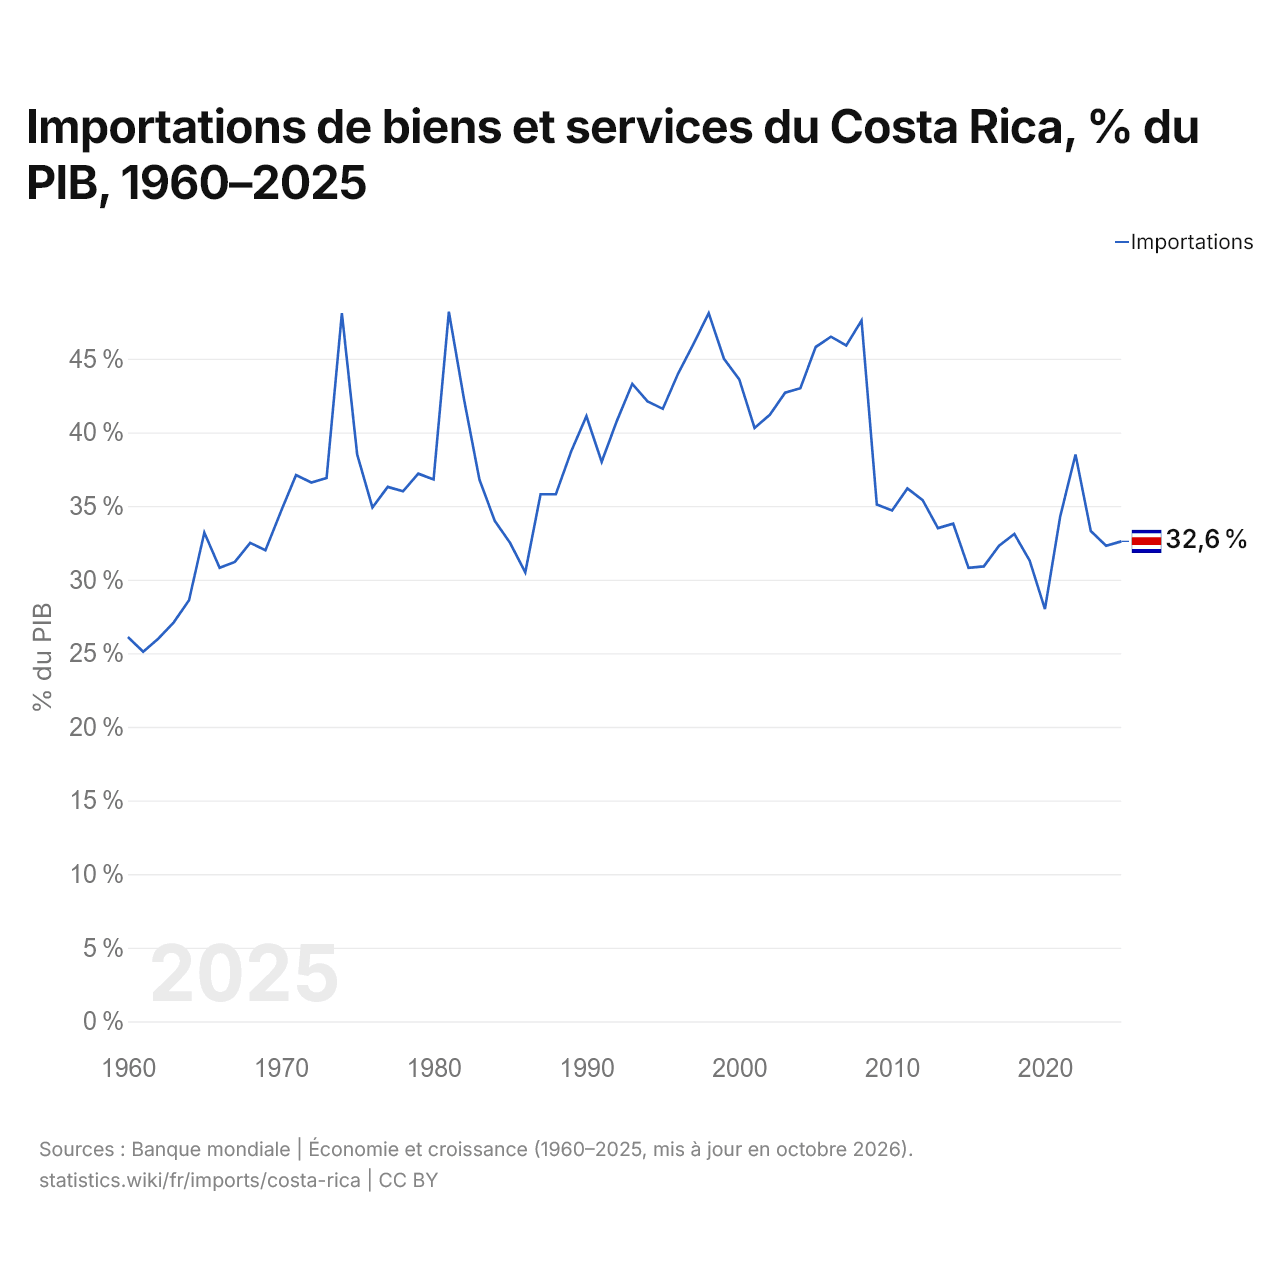
En 2025, les importations de biens et services du Costa Rica équivalaient à 32,6 % de son PIB, contre 26,1 % en 1960. La part la plus élevée a été de 48,2 %, en 1981.
Comparer les importations du Costa Rica avec celles d'autres pays
Sources :
- Banque mondiale | Économie et croissance (1960–2025, mis à jour en octobre 2026)
- TradeMap (2001–2025, mis à jour en octobre 2026)
Creative Commons Attribution (CC BY) : vous pouvez copier, partager, adapter et réutiliser ce contenu, y compris à des fins commerciales, à condition de citer statistics.wiki et d’indiquer les modifications apportées. Les sources citées ci-dessus peuvent avoir leurs propres conditions de licence.