
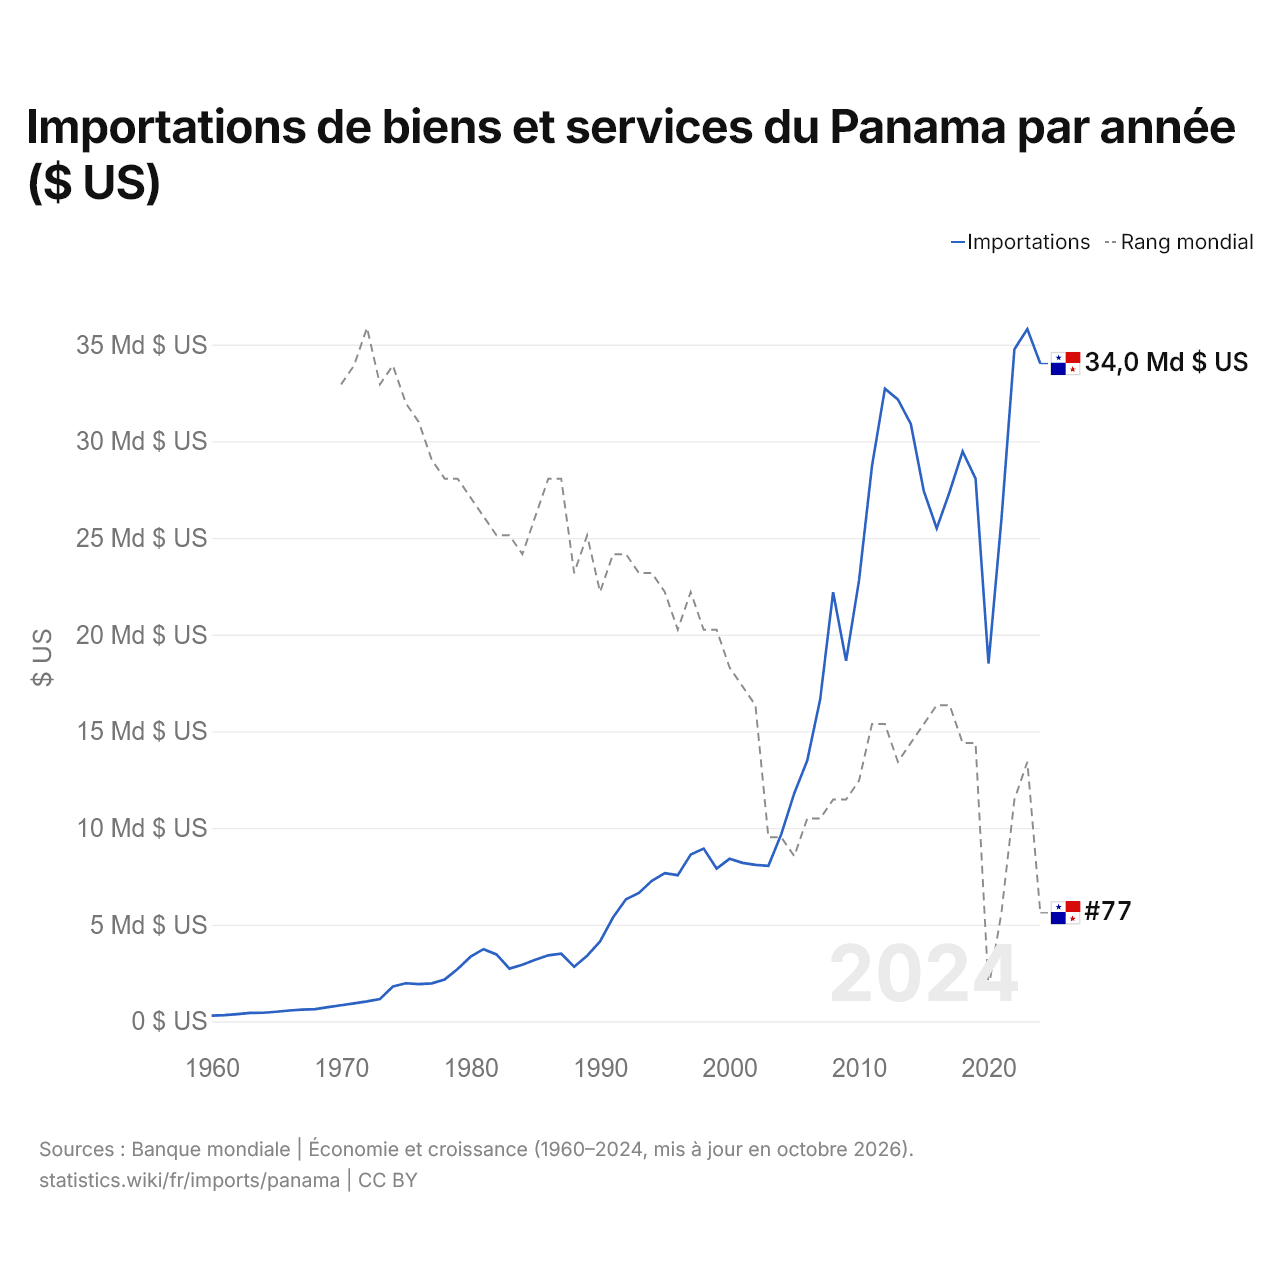
Importations de biens et services du Panama par année ($ US)
| Année | $ US | Rang mondial |
|---|---|---|
| Importations | Rang mondial | |
| 2024 | 34 017 704 900 $ US | #77 |
| 2023 | 35 804 273 200 $ US | #69 |
| 2022 | 34 758 827 500 $ US | #71 |
| 2021 | 25 965 646 100 $ US | #77 |
| 2020 | 18 505 270 200 $ US | #81 |
| 2019 | 28 061 255 700 $ US | #68 |
| 2018 | 29 473 747 500 $ US | #68 |
| 2017 | 27 388 495 500 $ US | #66 |
| 2016 | 25 491 123 600 $ US | #66 |
| 2015 | 27 433 598 900 $ US | #67 |
| 2014 | 30 898 187 800 $ US | #68 |
| 2013 | 32 165 330 900 $ US | #69 |
| 2012 | 32 720 763 400 $ US | #67 |
| 2011 | 28 715 326 100 $ US | #67 |
| 2010 | 22 801 278 400 $ US | #70 |
| 2009 | 18 642 684 400 $ US | #71 |
| 2008 | 22 194 340 800 $ US | #71 |
| 2007 | 16 654 324 300 $ US | #72 |
| 2006 | 13 486 936 400 $ US | #72 |
| 2005 | 11 798 912 400 $ US | #74 |
| 2004 | 9 692 055 300 $ US | #73 |
| 2003 | 8 044 255 200 $ US | #73 |
| 2002 | 8 089 552 400 $ US | #66 |
| 2001 | 8 195 266 400 $ US | #65 |
| 2000 | 8 405 006 400 $ US | #64 |
| 1999 | 7 902 775 100 $ US | #62 |
| 1998 | 8 934 147 100 $ US | #62 |
| 1997 | 8 629 854 000 $ US | #60 |
| 1996 | 7 558 309 100 $ US | #62 |
| 1995 | 7 664 630 500 $ US | #60 |
| 1994 | 7 264 372 200 $ US | #59 |
| 1993 | 6 641 440 500 $ US | #59 |
| 1992 | 6 315 044 100 $ US | #58 |
| 1991 | 5 369 275 600 $ US | #58 |
| 1990 | 4 137 057 400 $ US | #60 |
| 1989 | 3 393 593 400 $ US | #57 |
| 1988 | 2 824 846 900 $ US | #59 |
| 1987 | 3 497 613 100 $ US | #54 |
| 1986 | 3 413 764 500 $ US | #54 |
| 1985 | 3 180 313 400 $ US | #56 |
| 1984 | 2 929 064 300 $ US | #58 |
| 1983 | 2 724 782 300 $ US | #57 |
| 1982 | 3 460 434 900 $ US | #57 |
| 1981 | 3 730 569 700 $ US | #56 |
| 1980 | 3 343 857 700 $ US | #55 |
| 1979 | 2 701 126 300 $ US | #54 |
| 1978 | 2 167 125 500 $ US | #54 |
| 1977 | 1 963 649 700 $ US | #53 |
| 1976 | 1 920 906 000 $ US | #51 |
| 1975 | 1 968 574 100 $ US | #50 |
| 1974 | 1 806 463 200 $ US | #48 |
| 1973 | 1 152 110 300 $ US | #49 |
| 1972 | 1 030 379 300 $ US | #46 |
| 1971 | 925 391 300 $ US | #48 |
| 1970 | 832 024 900 $ US | #49 |
| 1969 | 731 327 800 $ US | - |
| 1968 | 630 826 500 $ US | - |
| 1967 | 603 791 100 $ US | - |
| 1966 | 560 299 300 $ US | - |
| 1965 | 496 433 000 $ US | - |
| 1964 | 441 970 400 $ US | - |
| 1963 | 434 329 900 $ US | - |
| 1962 | 372 814 600 $ US | - |
| 1961 | 321 486 400 $ US | - |
| 1960 | 292 100 100 $ US | - |
Les importations de biens et services du Panama s'élèvent à 34 milliards de dollars (2024), contre 292 millions de dollars en 1960. Le maximum a été de 35,8 milliards de dollars, en 2023. Elles se classent au 77e rang mondial, en baisse par rapport au 69e rang l'année précédente. Leur meilleur rang a été le 46e, occupé pour la dernière fois en 1972.
Les importations de biens et services du Panama sont les 10es plus élevées de 26 pays situés en Amérique latine. Les exportations du Panama dépassent ses importations de 4,36 milliards de dollars, soit un excédent commercial (2024). Le commerce du Panama, exportations et importations réunies, équivaut à 83,7 % de son PIB (2024), au 81e rang mondial.
Importations de biens du Panama par catégorie, 2025
Importations de biens, 2025: 25,8 Md $US
En 2025, la première catégorie des importations de biens du Panama était « machines, électronique et véhicules », avec 30,2 %, suivie de « produits chimiques, pharmaceutiques et plastiques », avec 20,0 %.
Origines des importations de biens du Panama : les 10 premières, 2025
| Rang | Pays | Importations de biens | Part | |
|---|---|---|---|---|
| 1 |
 Chine |
6,94 Md $US | 26,9 % | |
| 2 |
 États-Unis |
3,55 Md $US | 13,8 % | |
| 3 |
 Mexique |
1,00 Md $US | 3,88 % | |
| 4 |
 Japon |
719 M $US | 2,78 % | |
| 5 |
 Italie |
539 M $US | 2,09 % | |
| 6 |
 Belgique |
514 M $US | 1,99 % | |
| 7 |
 Allemagne |
484 M $US | 1,88 % | |
| 8 |
 Costa Rica |
481 M $US | 1,86 % | vs Costa Rica |
| 9 |
 Vietnam |
469 M $US | 1,82 % | |
| 10 |
 Espagne |
468 M $US | 1,81 % | |
| Autres partenaires et non précisés | 10,7 Md $US | 41,3 % |
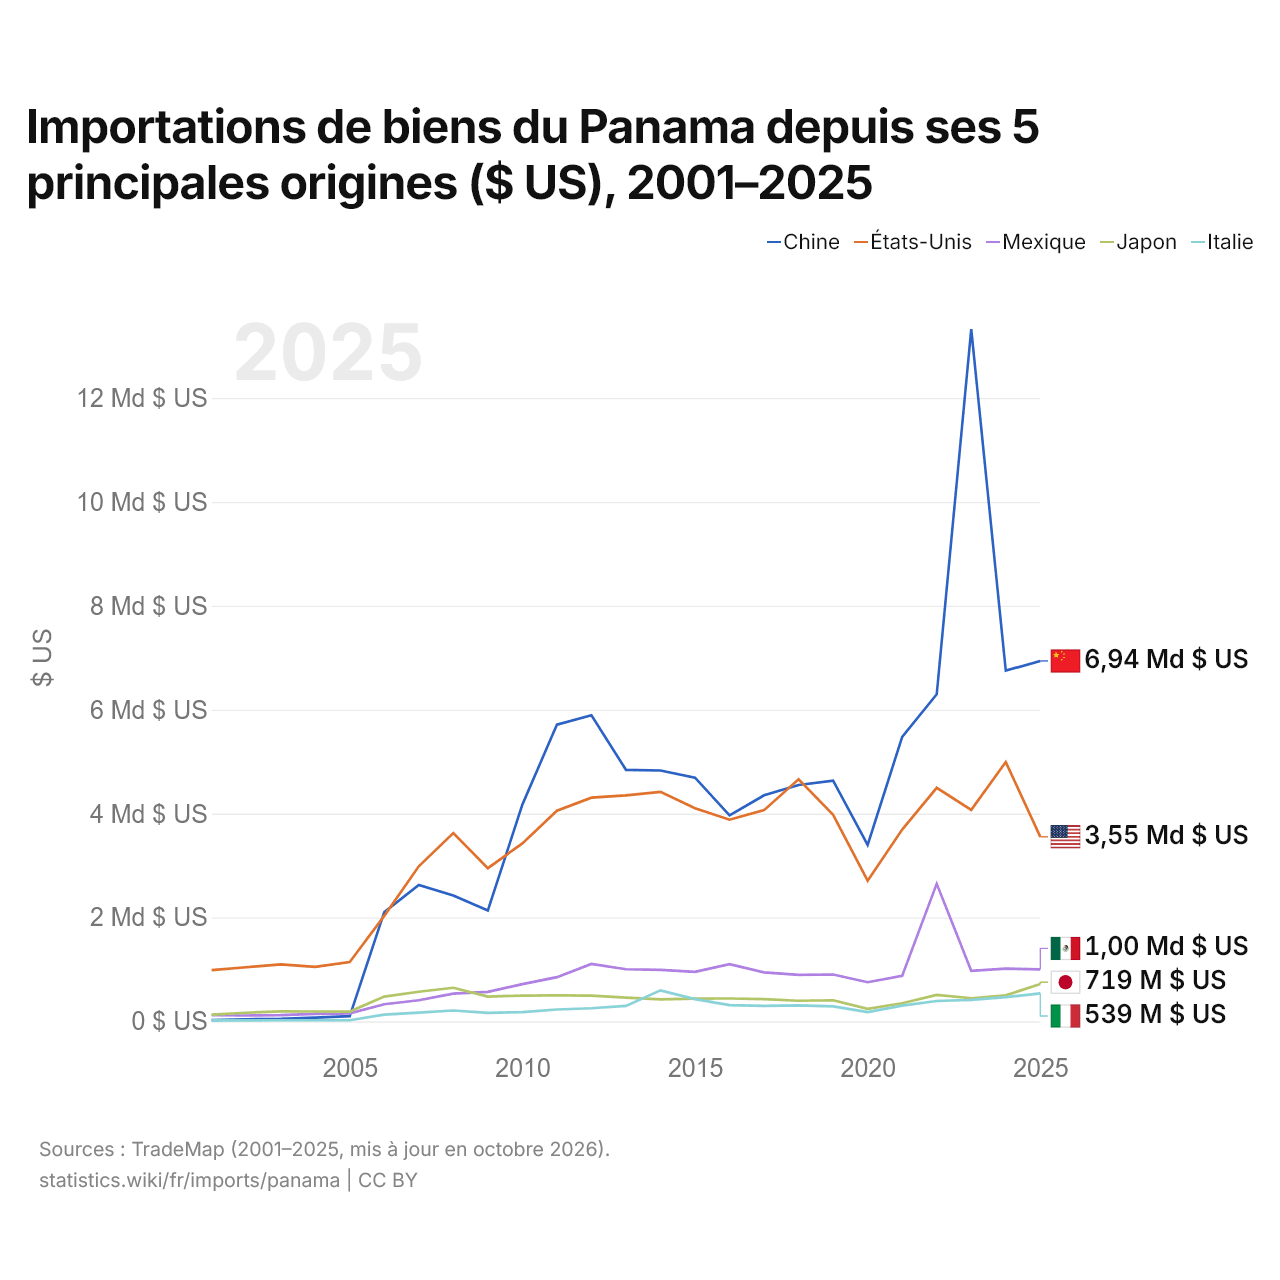
Importations de biens du Panama depuis ses 5 principales origines ($ US), 2001–2025
| Année | $ US | ||||
|---|---|---|---|---|---|
| Chine | États-Unis | Mexique | Japon | Italie | |
| 2025 | 6 937 692 000 $ US | 3 552 273 000 $ US | 1 001 592 000 $ US | 718 608 000 $ US | 538 946 000 $ US |
| 2024 | 6 751 298 000 $ US | 4 991 514 000 $ US | 1 014 265 000 $ US | 499 959 000 $ US | 464 738 000 $ US |
| 2023 | 13 323 989 000 $ US | 4 070 895 000 $ US | 971 802 000 $ US | 445 202 000 $ US | 411 967 000 $ US |
| 2022 | 6 295 349 000 $ US | 4 495 127 000 $ US | 2 647 639 000 $ US | 509 812 000 $ US | 391 729 000 $ US |
| 2021 | 5 475 283 000 $ US | 3 692 092 000 $ US | 878 280 000 $ US | 347 935 000 $ US | 302 821 000 $ US |
| 2020 | 3 395 139 000 $ US | 2 706 632 000 $ US | 752 635 000 $ US | 238 999 000 $ US | 177 257 000 $ US |
| 2019 | 4 634 116 000 $ US | 3 973 670 000 $ US | 901 675 000 $ US | 405 738 000 $ US | 289 024 000 $ US |
| 2018 | 4 550 698 000 $ US | 4 659 073 000 $ US | 894 183 000 $ US | 396 887 000 $ US | 308 337 000 $ US |
| 2017 | 4 350 816 000 $ US | 4 065 536 000 $ US | 942 340 000 $ US | 426 433 000 $ US | 296 662 000 $ US |
| 2016 | 3 964 450 000 $ US | 3 881 930 000 $ US | 1 100 104 000 $ US | 439 166 000 $ US | 311 584 000 $ US |
| 2015 | 4 691 451 000 $ US | 4 102 290 000 $ US | 952 107 000 $ US | 438 314 000 $ US | 428 302 000 $ US |
| 2014 | 4 828 303 000 $ US | 4 417 514 000 $ US | 991 106 000 $ US | 421 352 000 $ US | 596 655 000 $ US |
| 2013 | 4 842 007 000 $ US | 4 349 453 000 $ US | 1 002 434 000 $ US | 457 503 000 $ US | 297 020 000 $ US |
| 2012 | 5 891 104 000 $ US | 4 306 058 000 $ US | 1 104 806 000 $ US | 496 322 000 $ US | 251 091 000 $ US |
| 2011 | 5 712 163 000 $ US | 4 053 254 000 $ US | 850 787 000 $ US | 499 397 000 $ US | 227 982 000 $ US |
| 2010 | 4 172 699 000 $ US | 3 425 530 000 $ US | 716 308 000 $ US | 496 368 000 $ US | 178 014 000 $ US |
| 2009 | 2 133 796 000 $ US | 2 948 291 000 $ US | 568 288 000 $ US | 475 937 000 $ US | 164 020 000 $ US |
| 2008 | 2 424 350 000 $ US | 3 624 059 000 $ US | 532 938 000 $ US | 646 549 000 $ US | 207 811 000 $ US |
| 2007 | 2 626 350 000 $ US | 2 984 977 000 $ US | 405 387 000 $ US | 570 111 000 $ US | 166 930 000 $ US |
| 2006 | 2 102 233 000 $ US | 2 030 438 000 $ US | 328 539 000 $ US | 476 949 000 $ US | 129 858 000 $ US |
| 2005 | 99 029 000 $ US | 1 143 022 000 $ US | 154 024 000 $ US | 188 222 000 $ US | 20 123 000 $ US |
| 2004 | 72 107 000 $ US | 1 048 886 000 $ US | 143 321 000 $ US | 189 829 000 $ US | 21 538 000 $ US |
| 2003 | 48 411 000 $ US | 1 096 363 000 $ US | 119 154 000 $ US | 193 230 000 $ US | 20 707 000 $ US |
| 2002 | 40 793 000 $ US | 1 041 078 000 $ US | 112 447 000 $ US | 164 641 000 $ US | 18 825 000 $ US |
| 2001 | 24 732 000 $ US | 985 515 000 $ US | 119 388 000 $ US | 128 975 000 $ US | 19 232 000 $ US |
En 2025, les importations de biens s'élevaient à 6,94 milliards de dollars en provenance de la Chine, 3,55 milliards de dollars en provenance des États-Unis, 1 milliard de dollars en provenance du Mexique, 719 millions de dollars en provenance du Japon et 539 millions de dollars en provenance de l'Italie. Le premier rang des cinq fournisseurs du Panama est occupé par la Chine depuis 2019.
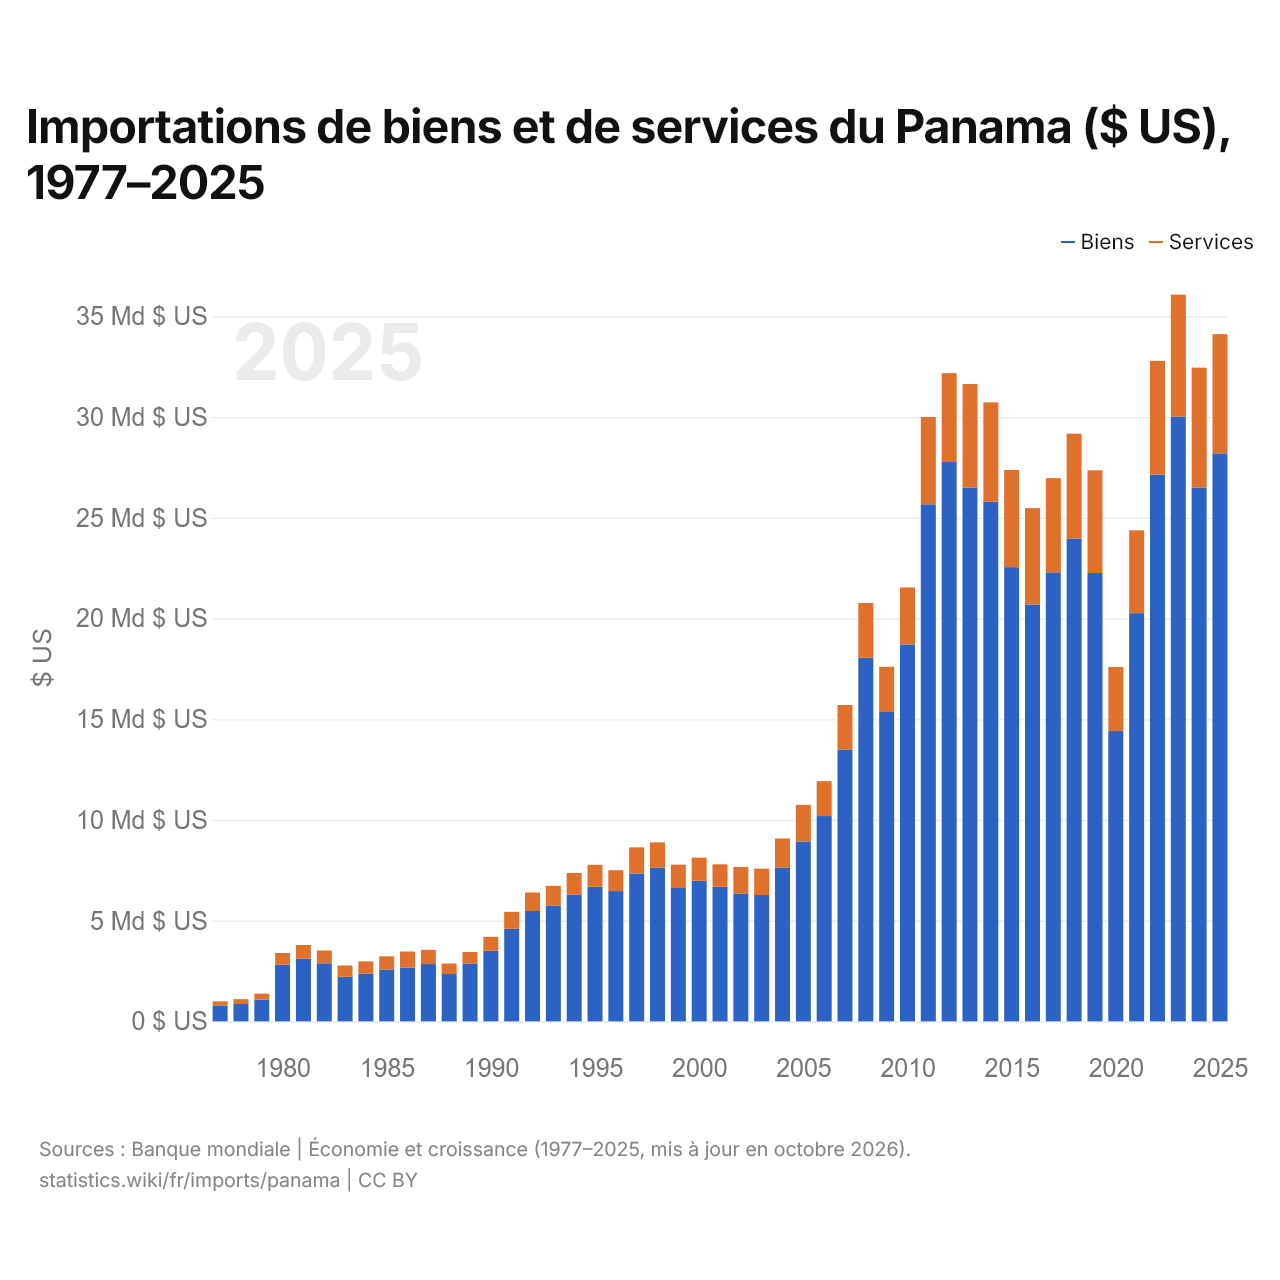
Importations de biens et de services du Panama ($ US), 1977–2025
| Année | $ US | |
|---|---|---|
| Biens | Services | |
| 2025 | 28 193 966 019 $ US | 5 910 494 917 $ US |
| 2024 | 26 497 115 475 $ US | 5 945 745 669 $ US |
| 2023 | 30 020 033 420 $ US | 6 047 897 392 $ US |
| 2022 | 27 143 398 960 $ US | 5 640 757 761 $ US |
| 2021 | 20 256 933 426 $ US | 4 117 041 349 $ US |
| 2020 | 14 406 800 893 $ US | 3 179 932 213 $ US |
| 2019 | 22 252 907 911 $ US | 5 099 479 010 $ US |
| 2018 | 23 960 661 613 $ US | 5 208 693 664 $ US |
| 2017 | 22 286 266 066 $ US | 4 673 242 691 $ US |
| 2016 | 20 693 756 500 $ US | 4 780 642 474 $ US |
| 2015 | 22 541 800 000 $ US | 4 823 800 000 $ US |
| 2014 | 25 783 100 000 $ US | 4 940 600 000 $ US |
| 2013 | 26 493 400 000 $ US | 5 142 400 000 $ US |
| 2012 | 27 761 700 000 $ US | 4 410 800 000 $ US |
| 2011 | 25 661 500 000 $ US | 4 337 200 000 $ US |
| 2010 | 18 709 500 000 $ US | 2 827 000 000 $ US |
| 2009 | 15 357 200 000 $ US | 2 238 500 000 $ US |
| 2008 | 18 043 900 000 $ US | 2 724 200 000 $ US |
| 2007 | 13 488 000 000 $ US | 2 210 500 000 $ US |
| 2006 | 10 189 300 000 $ US | 1 728 100 000 $ US |
| 2005 | 8 932 100 000 $ US | 1 813 300 000 $ US |
| 2004 | 7 615 700 000 $ US | 1 460 900 000 $ US |
| 2003 | 6 272 600 000 $ US | 1 306 500 000 $ US |
| 2002 | 6 342 000 000 $ US | 1 315 200 000 $ US |
| 2001 | 6 678 500 000 $ US | 1 114 000 000 $ US |
| 2000 | 6 969 700 000 $ US | 1 152 500 000 $ US |
| 1999 | 6 618 300 000 $ US | 1 156 100 000 $ US |
| 1998 | 7 616 700 000 $ US | 1 263 900 000 $ US |
| 1997 | 7 342 800 000 $ US | 1 295 400 000 $ US |
| 1996 | 6 465 700 000 $ US | 1 035 300 000 $ US |
| 1995 | 6 678 200 000 $ US | 1 089 400 000 $ US |
| 1994 | 6 294 700 000 $ US | 1 064 500 000 $ US |
| 1993 | 5 749 900 000 $ US | 977 600 000 $ US |
| 1992 | 5 478 800 000 $ US | 918 000 000 $ US |
| 1991 | 4 590 500 000 $ US | 848 800 000 $ US |
| 1990 | 3 503 100 000 $ US | 690 000 000 $ US |
| 1989 | 2 865 200 000 $ US | 575 900 000 $ US |
| 1988 | 2 348 200 000 $ US | 518 900 000 $ US |
| 1987 | 2 842 300 000 $ US | 707 900 000 $ US |
| 1986 | 2 669 100 000 $ US | 797 200 000 $ US |
| 1985 | 2 569 300 000 $ US | 658 100 000 $ US |
| 1984 | 2 377 100 000 $ US | 598 100 000 $ US |
| 1983 | 2 216 500 000 $ US | 551 500 000 $ US |
| 1982 | 2 880 400 000 $ US | 633 700 000 $ US |
| 1981 | 3 114 800 000 $ US | 671 400 000 $ US |
| 1980 | 2 802 900 000 $ US | 591 000 000 $ US |
| 1979 | 1 085 700 000 $ US | 287 700 000 $ US |
| 1978 | 862 100 000 $ US | 238 800 000 $ US |
| 1977 | 790 400 000 $ US | 205 000 000 $ US |
En 2025, les importations de biens du Panama s'élevaient à 28,2 milliards de dollars et celles de services à 5,91 milliards de dollars ; les services représentaient 17,3 % du total, contre 20,6 % en 1977.
Le Panama dans le classement mondial des importations
| Rang | Pays | Importations | Part mondiale | |
|---|---|---|---|---|
| 74 |
 Rép. dominicaine |
35,5 Md $US (2025) | 0,11 % | vs Rép. dominicaine |
| 75 |
 Bahreïn |
34,6 Md $US (2025) | 0,1 % | |
| 76 |
 Cambodge |
34,6 Md $US (2025) | 0,1 % | |
| 77 |
 Panama |
34,0 Md $US | 0,11 % | |
| 78 |
Costa Rica
|
33,6 Md $US (2025) | 0,1 % | vs Costa Rica |
| 79 |
 Jordanie |
33,5 Md $US | 0,11 % | |
| 80 |
 Lettonie |
32,6 Md $US (2025) | 0,1 % |
Importations de biens et services du Panama, % du PIB
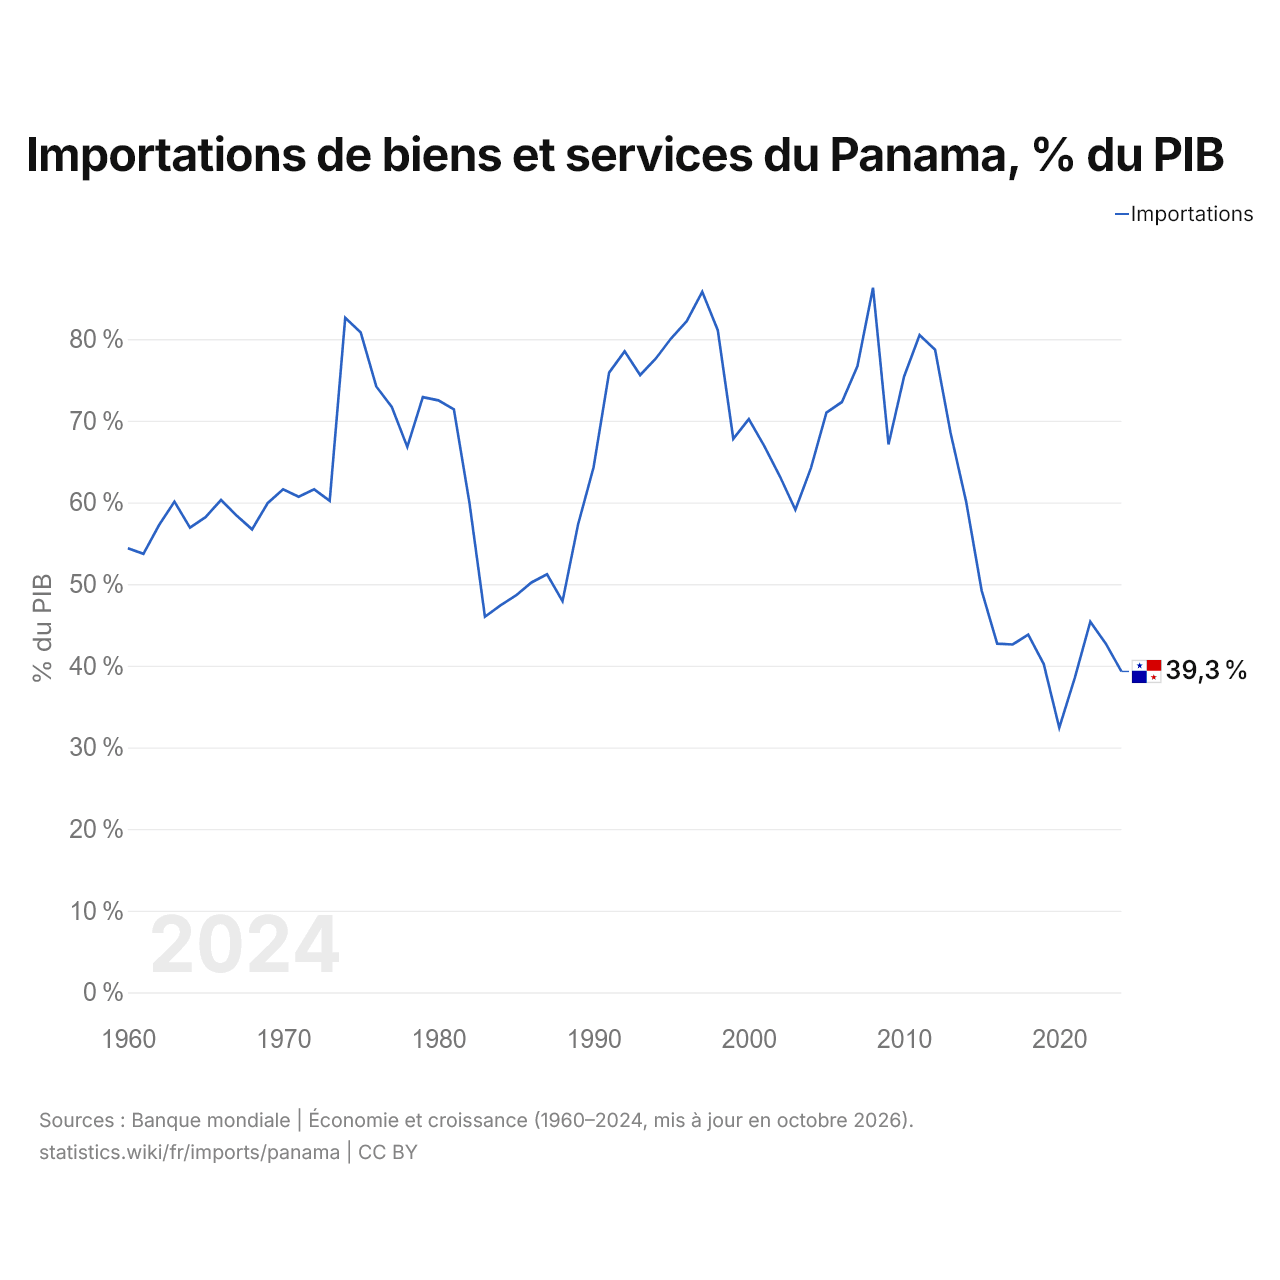
Les importations de biens et services du Panama équivalent à 39,3 % de son PIB (2024), contre 54,4 % en 1960. La part la plus élevée a été de 86,3 %, en 2008.
Comparer les importations du Panama avec celles d'autres pays
Sources :
- Banque mondiale | Économie et croissance (1960–2025, mis à jour en octobre 2026)
- TradeMap (2001–2025, mis à jour en octobre 2026)
Creative Commons Attribution (CC BY) : vous pouvez copier, partager, adapter et réutiliser ce contenu, y compris à des fins commerciales, à condition de citer statistics.wiki et d’indiquer les modifications apportées. Les sources citées ci-dessus peuvent avoir leurs propres conditions de licence.