
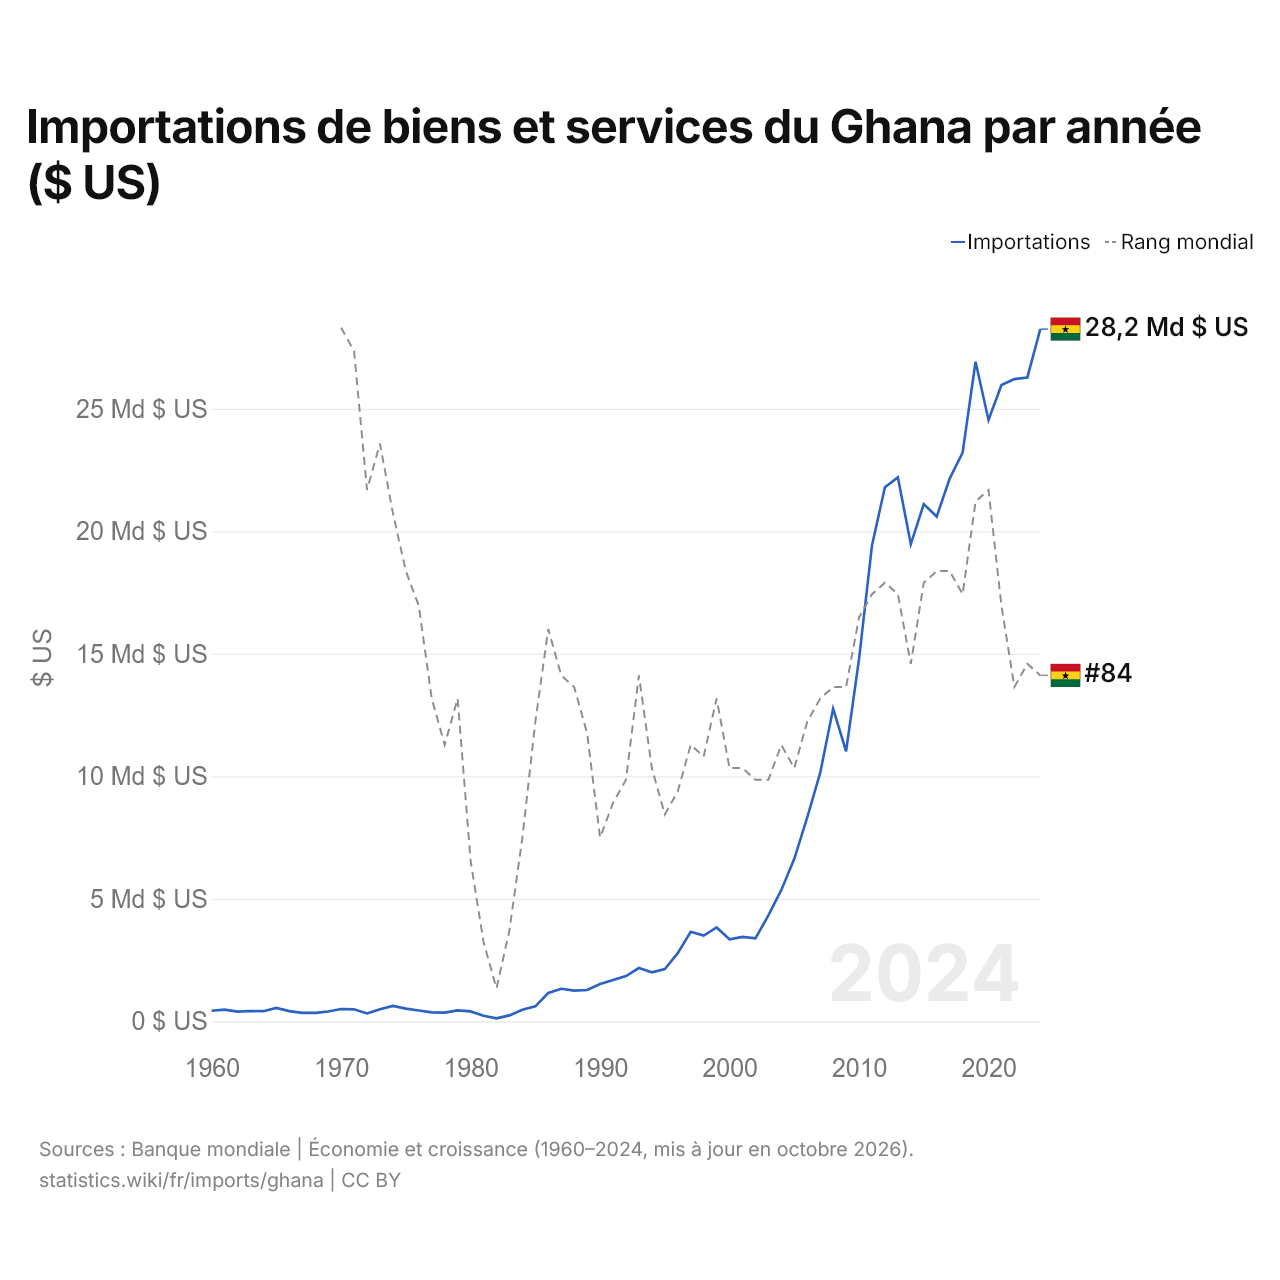
Importations de biens et services du Ghana par année ($ US)
| Année | $ US | Rang mondial |
|---|---|---|
| Importations | Rang mondial | |
| 2024 | 28 244 066 026 $ US | #84 |
| 2023 | 26 272 099 172 $ US | #83 |
| 2022 | 26 205 330 554 $ US | #85 |
| 2021 | 25 963 543 827 $ US | #78 |
| 2020 | 24 537 944 240 $ US | #68 |
| 2019 | 26 913 986 432 $ US | #69 |
| 2018 | 23 206 913 262 $ US | #77 |
| 2017 | 22 144 229 691 $ US | #75 |
| 2016 | 20 595 796 191 $ US | #75 |
| 2015 | 21 104 358 074 $ US | #76 |
| 2014 | 19 468 106 209 $ US | #83 |
| 2013 | 22 196 190 510 $ US | #77 |
| 2012 | 21 795 097 067 $ US | #76 |
| 2011 | 19 416 125 146 $ US | #77 |
| 2010 | 14 779 077 374 $ US | #79 |
| 2009 | 11 019 356 825 $ US | #85 |
| 2008 | 12 757 957 188 $ US | #85 |
| 2007 | 10 136 811 817 $ US | #86 |
| 2006 | 8 325 374 082 $ US | #88 |
| 2005 | 6 631 794 425 $ US | #92 |
| 2004 | 5 361 446 367 $ US | #90 |
| 2003 | 4 320 740 017 $ US | #93 |
| 2002 | 3 383 577 207 $ US | #93 |
| 2001 | 3 444 719 917 $ US | #92 |
| 2000 | 3 350 776 354 $ US | #92 |
| 1999 | 3 830 248 310 $ US | #86 |
| 1998 | 3 496 235 606 $ US | #91 |
| 1997 | 3 651 882 361 $ US | #90 |
| 1996 | 2 779 627 875 $ US | #94 |
| 1995 | 2 128 504 595 $ US | #96 |
| 1994 | 2 002 227 733 $ US | #92 |
| 1993 | 2 173 595 289 $ US | #84 |
| 1992 | 1 845 761 703 $ US | #93 |
| 1991 | 1 685 450 045 $ US | #95 |
| 1990 | 1 522 350 993 $ US | #98 |
| 1989 | 1 278 473 226 $ US | #89 |
| 1988 | 1 250 692 247 $ US | #85 |
| 1987 | 1 328 870 748 $ US | #84 |
| 1986 | 1 154 912 517 $ US | #80 |
| 1985 | 612 106 092 $ US | #88 |
| 1984 | 475 228 311 $ US | #98 |
| 1983 | 242 989 418 $ US | #106 |
| 1982 | 120 354 809 $ US | #111 |
| 1981 | 224 767 442 $ US | #107 |
| 1980 | 406 950 207 $ US | #100 |
| 1979 | 448 717 949 $ US | #86 |
| 1978 | 354 799 302 $ US | #90 |
| 1977 | 368 285 714 $ US | #86 |
| 1976 | 443 644 068 $ US | #78 |
| 1975 | 518 085 106 $ US | #75 |
| 1974 | 631 055 901 $ US | #70 |
| 1973 | 492 968 900 $ US | #64 |
| 1972 | 321 158 623 $ US | #68 |
| 1971 | 489 222 776 $ US | #56 |
| 1970 | 503 014 460 $ US | #54 |
| 1969 | 399 077 749 $ US | - |
| 1968 | 347 109 394 $ US | - |
| 1967 | 348 508 174 $ US | - |
| 1966 | 417 416 074 $ US | - |
| 1965 | 549 084 232 $ US | - |
| 1964 | 413 213 899 $ US | - |
| 1963 | 423 018 974 $ US | - |
| 1962 | 393 603 748 $ US | - |
| 1961 | 474 845 802 $ US | - |
| 1960 | 431 423 325 $ US | - |
Les importations de biens et services du Ghana s'élèvent à 28,2 milliards de dollars (2024), contre 431 millions de dollars en 1960. Le minimum a été de 120 millions de dollars, en 1982. Elles se classent au 84e rang mondial, en baisse par rapport au 83e rang l'année précédente. Leur meilleur rang a été le 54e, occupé pour la dernière fois en 1970.
Les importations de biens et services du Ghana sont les 9es plus élevées de 50 pays situés en Afrique. Les exportations du Ghana dépassent ses importations de 953 millions de dollars, soit un excédent commercial (2024). Le commerce du Ghana, exportations et importations réunies, équivaut à 69,0 % de son PIB (2024), au 107e rang mondial.
Importations de biens du Ghana par catégorie, 2025
Importations de biens, 2025: 20,2 Md $US
En 2025, la première catégorie des importations de biens du Ghana était « pétrole, gaz, minerais et autres matières premières », avec 31,8 %, suivie de « machines, électronique et véhicules », avec 30,1 %.
Origines des importations de biens du Ghana : les 10 premières, 2025
| Rang | Pays | Importations de biens | Part | |
|---|---|---|---|---|
| 1 |
 Chine |
4,59 Md $US | 22,7 % | vs Chine |
| 2 |
 États-Unis |
1,42 Md $US | 7,03 % | |
| 3 |
 Inde |
1,38 Md $US | 6,85 % | |
| 4 |
 EAU |
1,22 Md $US | 6,03 % | |
| 5 |
 Belgique |
1,01 Md $US | 5 % | vs Belgique |
| 6 |
 Pays-Bas |
908 M $US | 4,5 % | |
| 7 |
 Nigeria |
906 M $US | 4,49 % | |
| 8 |
 Royaume-Uni |
516 M $US | 2,56 % | |
| 9 |
 Russie |
462 M $US | 2,29 % | |
| 10 |
 Canada |
436 M $US | 2,16 % | vs Canada |
| Autres partenaires et non précisés | 7,33 Md $US | 36,3 % |
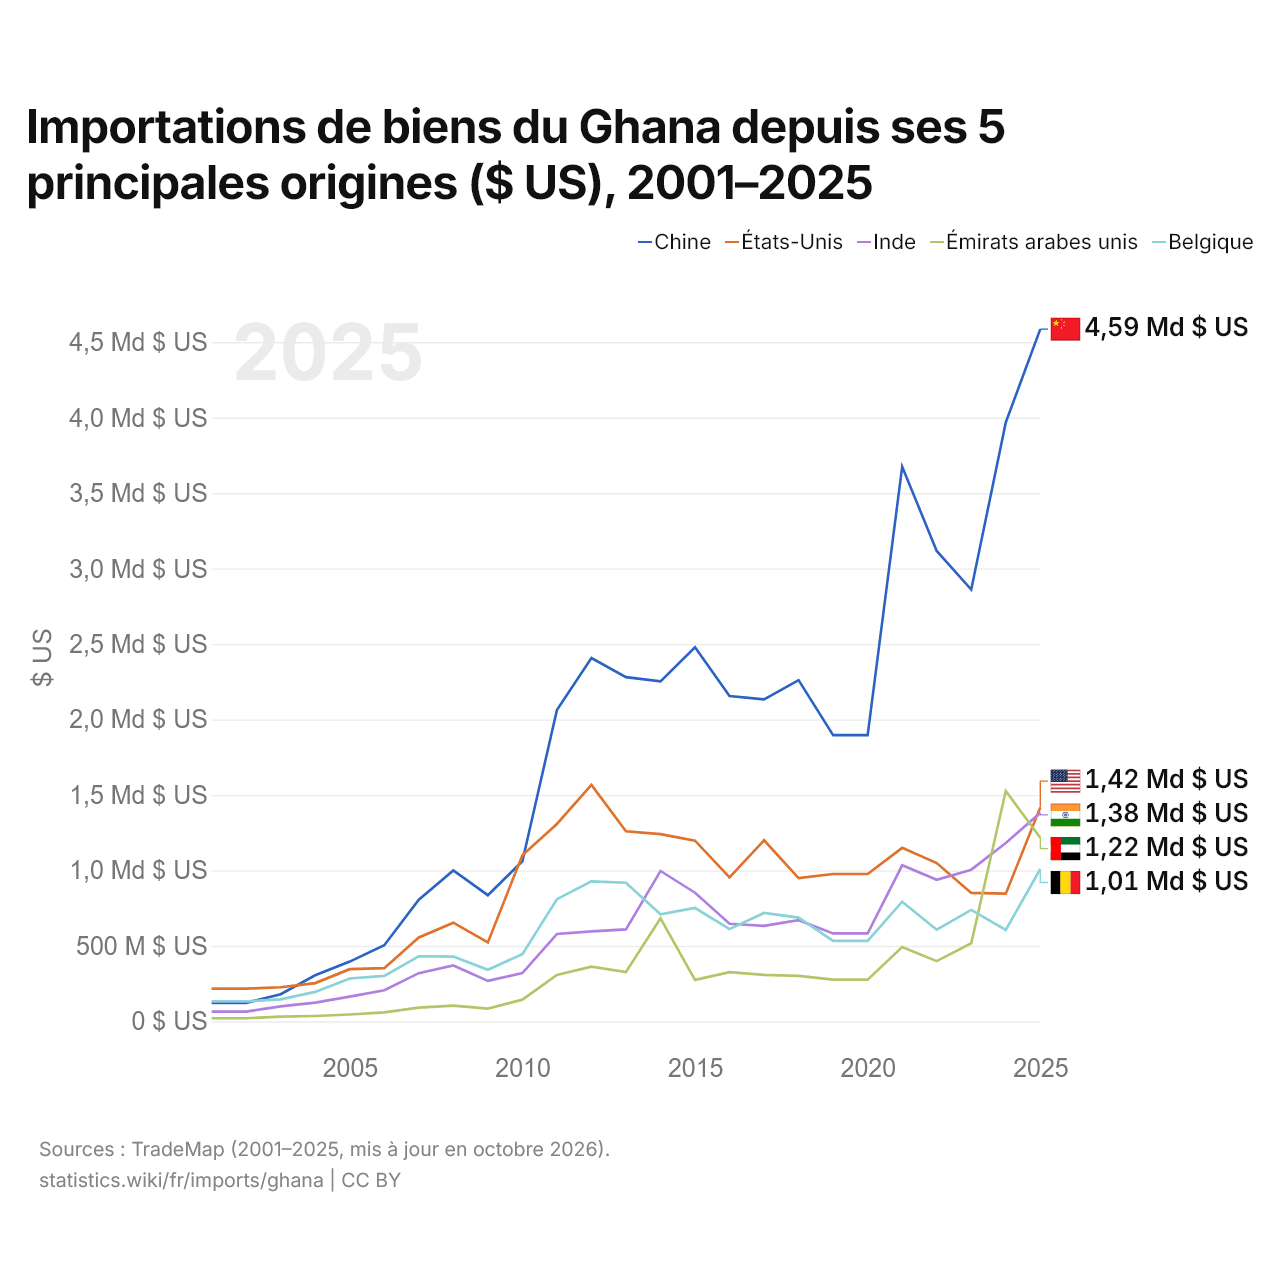
Importations de biens du Ghana depuis ses 5 principales origines ($ US), 2001–2025
| Année | $ US | ||||
|---|---|---|---|---|---|
| Chine | États-Unis | Inde | Émirats arabes unis | Belgique | |
| 2025 | 4 586 049 000 $ US | 1 416 761 000 $ US | 1 381 087 000 $ US | 1 216 582 000 $ US | 1 009 020 000 $ US |
| 2024 | 3 967 705 000 $ US | 845 980 000 $ US | 1 181 658 000 $ US | 1 525 910 000 $ US | 605 528 000 $ US |
| 2023 | 2 860 392 000 $ US | 850 881 000 $ US | 1 004 839 000 $ US | 516 983 000 $ US | 737 987 000 $ US |
| 2022 | 3 116 226 000 $ US | 1 048 678 000 $ US | 937 927 000 $ US | 398 732 000 $ US | 607 155 000 $ US |
| 2021 | 3 674 766 000 $ US | 1 149 596 000 $ US | 1 033 873 000 $ US | 492 479 000 $ US | 792 499 000 $ US |
| 2020 | 1 895 911 000 $ US | 976 222 000 $ US | 582 202 000 $ US | 275 843 000 $ US | 532 885 000 $ US |
| 2019 | 1 895 911 000 $ US | 976 222 000 $ US | 582 202 000 $ US | 275 843 000 $ US | 532 885 000 $ US |
| 2018 | 2 260 471 000 $ US | 948 620 000 $ US | 670 221 000 $ US | 301 558 000 $ US | 687 462 000 $ US |
| 2017 | 2 132 990 000 $ US | 1 199 390 000 $ US | 632 937 000 $ US | 307 344 000 $ US | 718 411 000 $ US |
| 2016 | 2 155 035 000 $ US | 953 552 000 $ US | 646 210 000 $ US | 326 039 000 $ US | 610 909 000 $ US |
| 2015 | 2 478 709 000 $ US | 1 196 962 000 $ US | 852 163 000 $ US | 274 664 000 $ US | 750 973 000 $ US |
| 2014 | 2 252 088 000 $ US | 1 240 362 000 $ US | 996 118 000 $ US | 682 565 000 $ US | 708 769 000 $ US |
| 2013 | 2 280 470 000 $ US | 1 259 242 000 $ US | 608 809 000 $ US | 326 903 000 $ US | 918 051 000 $ US |
| 2012 | 2 407 442 000 $ US | 1 566 865 000 $ US | 595 995 000 $ US | 362 113 000 $ US | 927 428 000 $ US |
| 2011 | 2 062 109 000 $ US | 1 307 251 000 $ US | 578 730 000 $ US | 306 897 000 $ US | 809 300 000 $ US |
| 2010 | 1 060 302 000 $ US | 1 100 613 000 $ US | 319 809 000 $ US | 143 629 000 $ US | 445 305 000 $ US |
| 2009 | 835 839 000 $ US | 522 885 000 $ US | 267 843 000 $ US | 84 663 000 $ US | 341 918 000 $ US |
| 2008 | 999 614 000 $ US | 653 549 000 $ US | 369 875 000 $ US | 103 919 000 $ US | 428 905 000 $ US |
| 2007 | 806 060 000 $ US | 555 774 000 $ US | 319 190 000 $ US | 91 298 000 $ US | 431 015 000 $ US |
| 2006 | 504 040 000 $ US | 352 293 000 $ US | 205 818 000 $ US | 59 572 000 $ US | 300 931 000 $ US |
| 2005 | 395 795 000 $ US | 345 569 000 $ US | 163 885 000 $ US | 45 294 000 $ US | 283 840 000 $ US |
| 2004 | 305 606 000 $ US | 253 431 000 $ US | 123 577 000 $ US | 35 582 000 $ US | 195 062 000 $ US |
| 2003 | 179 634 000 $ US | 225 879 000 $ US | 99 471 000 $ US | 31 121 000 $ US | 145 913 000 $ US |
| 2002 | 122 000 000 $ US | 216 233 000 $ US | 64 455 000 $ US | 20 678 000 $ US | 131 788 000 $ US |
| 2001 | 122 000 000 $ US | 216 233 000 $ US | 64 455 000 $ US | 20 678 000 $ US | 131 788 000 $ US |
En 2025, les importations de biens s'élevaient à 4,59 milliards de dollars en provenance de la Chine, 1,42 milliard de dollars en provenance des États-Unis, 1,38 milliard de dollars en provenance de l'Inde, 1,22 milliard de dollars en provenance des Émirats arabes unis et 1,01 milliard de dollars en provenance de la Belgique. Le premier rang des cinq fournisseurs du Ghana est occupé par la Chine depuis 2011. Le changement le plus récent dans leur ordre remonte à 2025, quand les importations du Ghana en provenance des États-Unis ont dépassé celles en provenance de l'Inde.
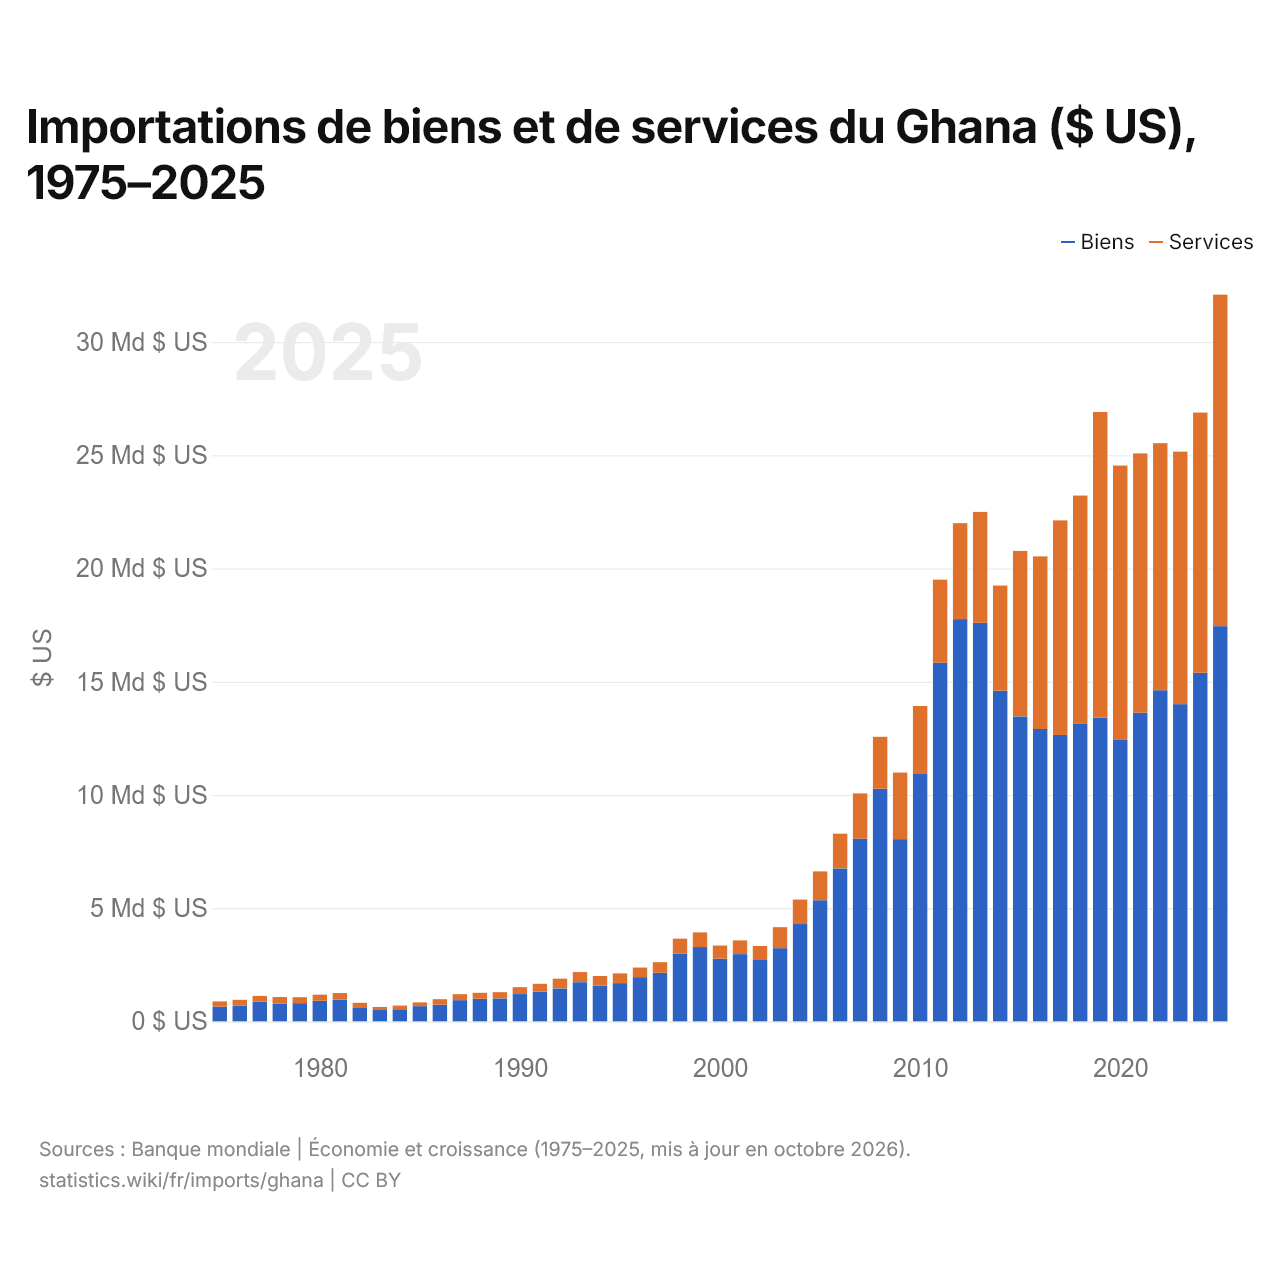
Importations de biens et de services du Ghana ($ US), 1975–2025
| Année | $ US | |
|---|---|---|
| Biens | Services | |
| 2025 | 17 452 126 500 $ US | 14 639 173 513 $ US |
| 2024 | 15 391 522 590 $ US | 11 494 708 028 $ US |
| 2023 | 14 008 508 081 $ US | 11 150 313 931 $ US |
| 2022 | 14 621 226 763 $ US | 10 913 392 509 $ US |
| 2021 | 13 628 661 956 $ US | 11 456 158 798 $ US |
| 2020 | 12 428 560 844 $ US | 12 116 810 362 $ US |
| 2019 | 13 410 702 464 $ US | 13 497 556 265 $ US |
| 2018 | 13 134 075 353 $ US | 10 086 482 951 $ US |
| 2017 | 12 647 770 000 $ US | 9 475 000 000 $ US |
| 2016 | 12 910 204 931 $ US | 7 626 261 682 $ US |
| 2015 | 13 465 053 156 $ US | 7 308 790 109 $ US |
| 2014 | 14 600 029 644 $ US | 4 647 069 509 $ US |
| 2013 | 17 600 235 990 $ US | 4 897 807 097 $ US |
| 2012 | 17 763 163 562 $ US | 4 235 934 897 $ US |
| 2011 | 15 837 733 213 $ US | 3 666 428 552 $ US |
| 2010 | 10 922 100 000 $ US | 3 003 230 000 $ US |
| 2009 | 8 046 260 000 $ US | 2 943 120 000 $ US |
| 2008 | 10 268 499 316 $ US | 2 298 064 135 $ US |
| 2007 | 8 066 114 752 $ US | 1 998 589 935 $ US |
| 2006 | 6 753 675 316 $ US | 1 532 818 782 $ US |
| 2005 | 5 347 309 681 $ US | 1 273 090 963 $ US |
| 2004 | 4 297 278 948 $ US | 1 081 786 887 $ US |
| 2003 | 3 232 824 021 $ US | 921 984 272 $ US |
| 2002 | 2 707 019 112 $ US | 620 912 459 $ US |
| 2001 | 2 968 511 883 $ US | 606 018 637 $ US |
| 2000 | 2 766 555 192 $ US | 583 663 077 $ US |
| 1999 | 3 279 900 000 $ US | 646 000 000 $ US |
| 1998 | 2 991 600 000 $ US | 659 430 000 $ US |
| 1997 | 2 143 720 000 $ US | 468 704 000 $ US |
| 1996 | 1 950 650 000 $ US | 424 800 000 $ US |
| 1995 | 1 687 800 000 $ US | 431 700 000 $ US |
| 1994 | 1 579 900 000 $ US | 420 800 000 $ US |
| 1993 | 1 728 000 000 $ US | 445 300 000 $ US |
| 1992 | 1 456 500 000 $ US | 425 300 000 $ US |
| 1991 | 1 318 700 000 $ US | 336 352 000 $ US |
| 1990 | 1 205 000 000 $ US | 300 500 000 $ US |
| 1989 | 1 011 600 000 $ US | 275 900 000 $ US |
| 1988 | 993 400 000 $ US | 268 000 000 $ US |
| 1987 | 933 900 000 $ US | 266 900 000 $ US |
| 1986 | 735 100 000 $ US | 240 750 000 $ US |
| 1985 | 668 700 000 $ US | 167 700 000 $ US |
| 1984 | 533 000 000 $ US | 163 000 000 $ US |
| 1983 | 499 700 000 $ US | 134 700 000 $ US |
| 1982 | 588 700 000 $ US | 228 200 000 $ US |
| 1981 | 954 300 000 $ US | 295 300 000 $ US |
| 1980 | 908 300 000 $ US | 269 900 000 $ US |
| 1979 | 803 100 000 $ US | 260 936 736 $ US |
| 1978 | 780 291 879 $ US | 292 588 191 $ US |
| 1977 | 860 177 855 $ US | 261 044 675 $ US |
| 1976 | 690 264 666 $ US | 260 262 301 $ US |
| 1975 | 650 525 317 $ US | 231 044 749 $ US |
En 2025, les importations de biens du Ghana s'élevaient à 17,5 milliards de dollars et celles de services à 14,6 milliards de dollars ; les services représentaient 45,6 % du total, contre 26,2 % en 1975.
Le Ghana dans le classement mondial des importations







Importations de biens et services du Ghana, % du PIB
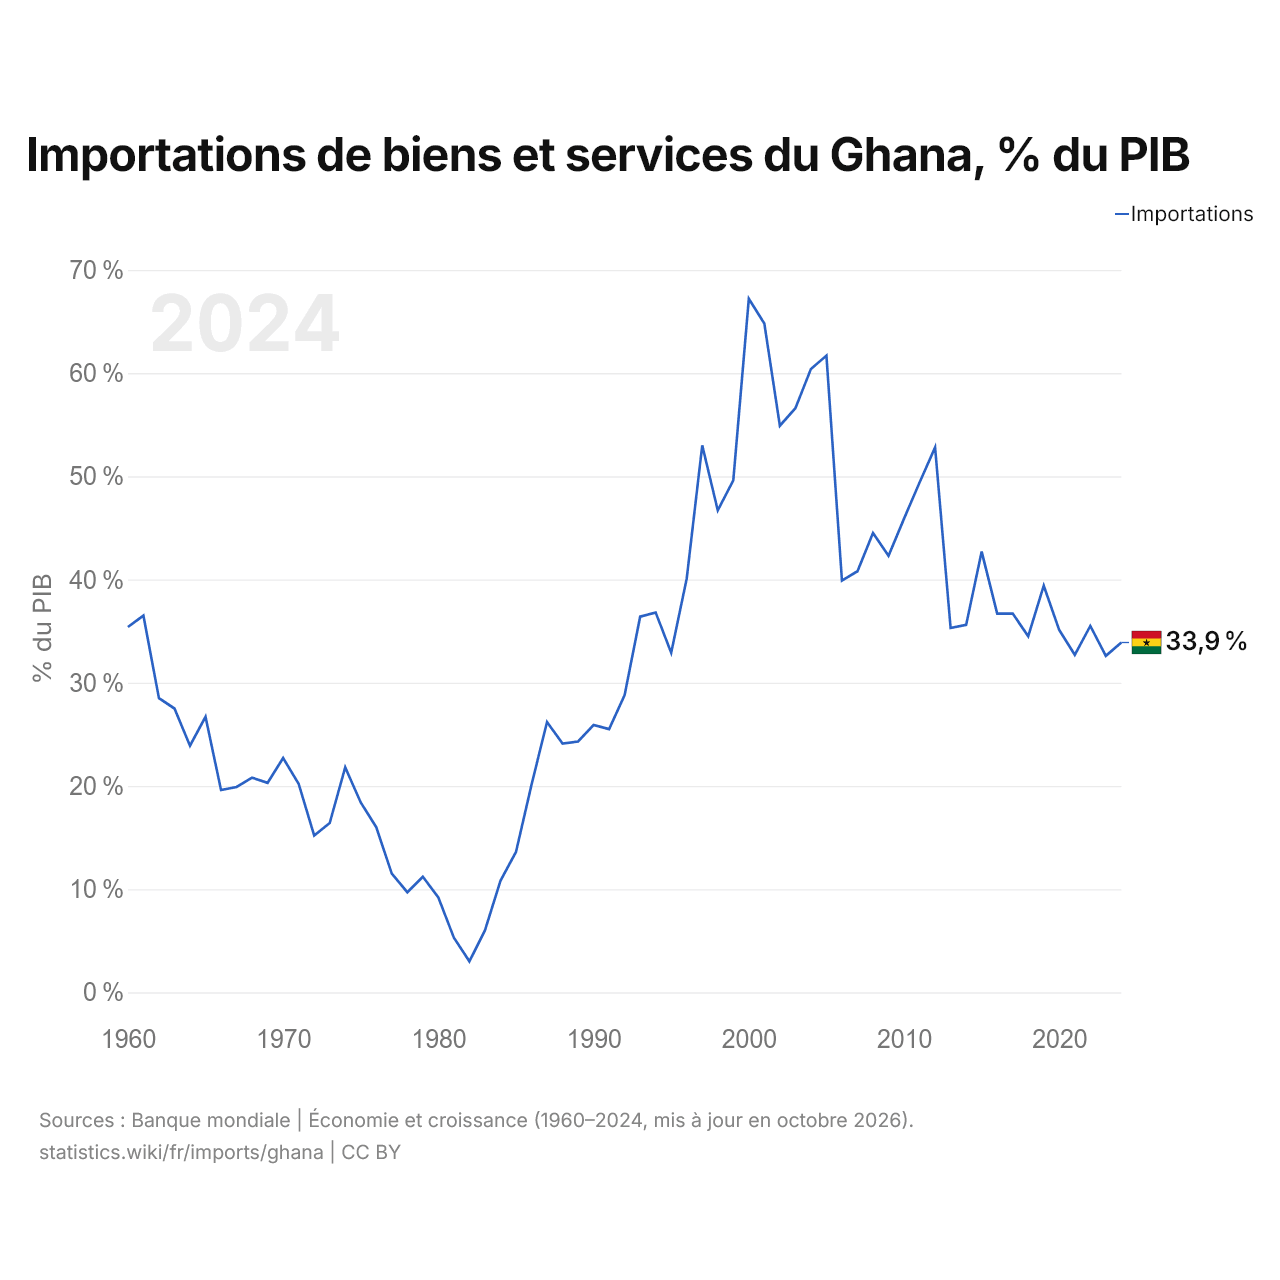
Les importations de biens et services du Ghana équivalent à 33,9 % de son PIB (2024), contre 35,4 % en 1960. La part la plus élevée a été de 67,2 %, en 2000.
Comparer les importations du Ghana avec celles d'autres pays
Sources :
- TradeMap (2001–2025, mis à jour en octobre 2026)
- Banque mondiale | Économie et croissance (1960–2025, mis à jour en octobre 2026)
Creative Commons Attribution (CC BY) : vous pouvez copier, partager, adapter et réutiliser ce contenu, y compris à des fins commerciales, à condition de citer statistics.wiki et d’indiquer les modifications apportées. Les sources citées ci-dessus peuvent avoir leurs propres conditions de licence.