
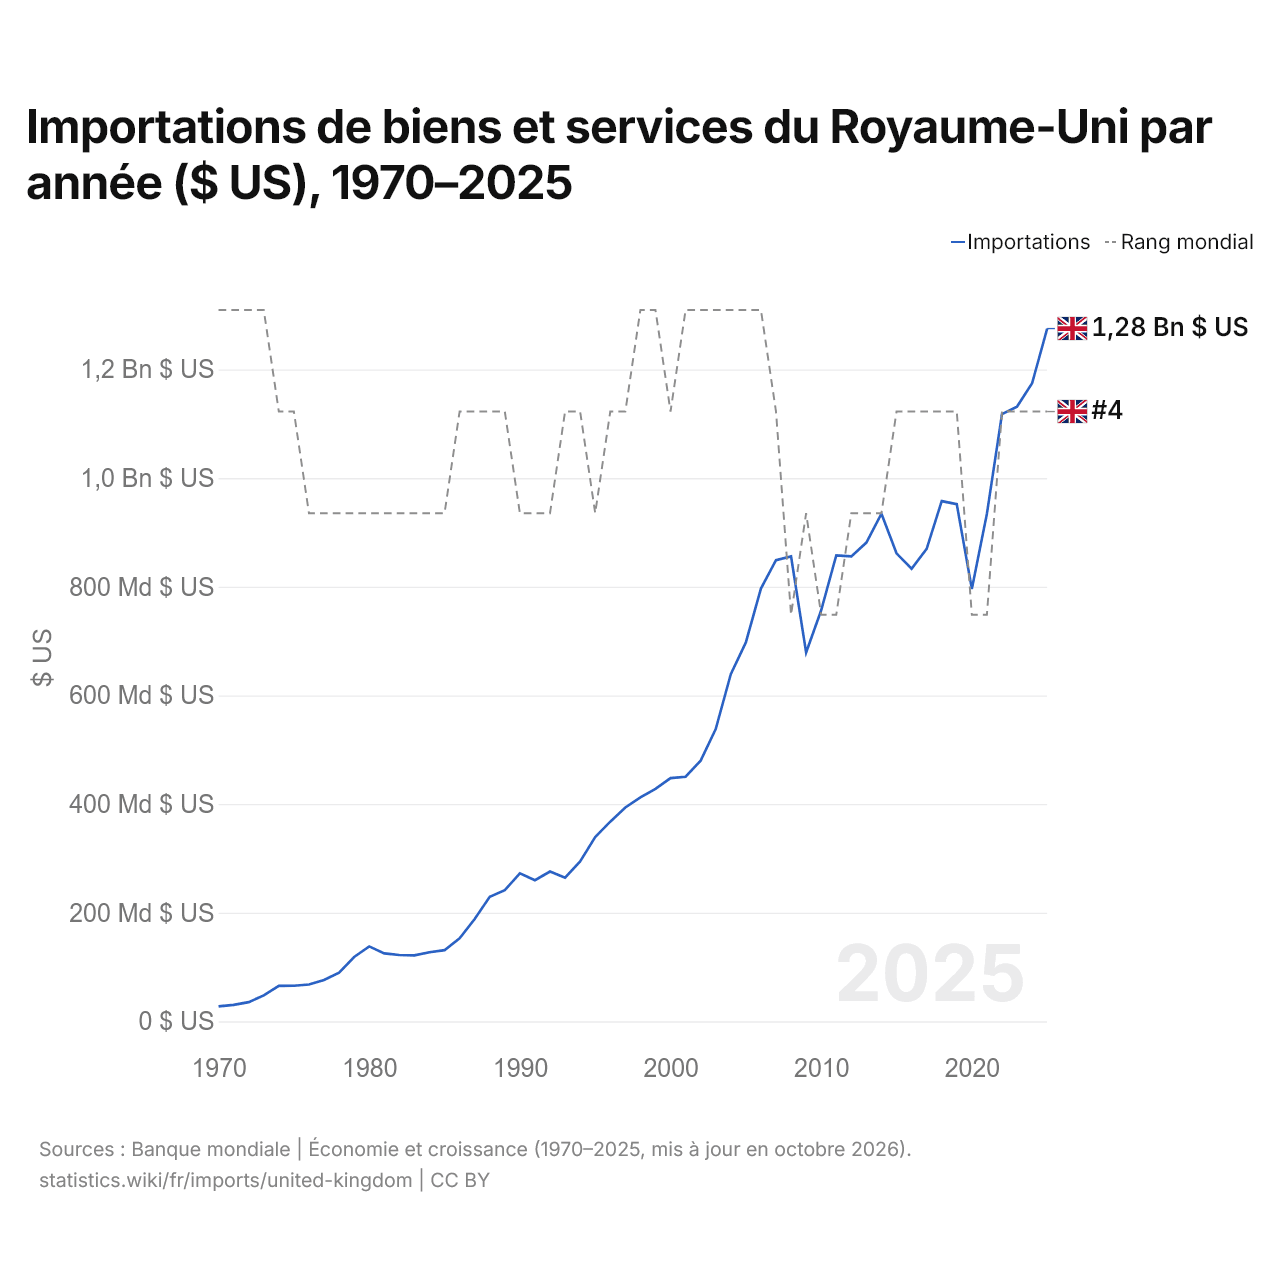
Importations de biens et services du Royaume-Uni par année ($ US), 1970–2025
| Année | $ US | Rang mondial |
|---|---|---|
| Importations | Rang mondial | |
| 2025 | 1 275 239 250 328 $ US | #4 |
| 2024 | 1 174 549 941 083 $ US | #4 |
| 2023 | 1 131 603 446 868 $ US | #4 |
| 2022 | 1 117 793 765 633 $ US | #4 |
| 2021 | 934 375 952 194 $ US | #6 |
| 2020 | 795 714 534 395 $ US | #6 |
| 2019 | 951 880 342 949 $ US | #4 |
| 2018 | 957 619 509 260 $ US | #4 |
| 2017 | 869 550 502 969 $ US | #4 |
| 2016 | 833 100 578 280 $ US | #4 |
| 2015 | 861 463 440 127 $ US | #4 |
| 2014 | 934 525 774 097 $ US | #5 |
| 2013 | 881 359 614 350 $ US | #5 |
| 2012 | 855 876 434 983 $ US | #5 |
| 2011 | 857 771 146 098 $ US | #6 |
| 2010 | 756 632 614 065 $ US | #6 |
| 2009 | 678 917 276 834 $ US | #5 |
| 2008 | 855 805 147 059 $ US | #6 |
| 2007 | 848 867 547 019 $ US | #4 |
| 2006 | 796 610 855 566 $ US | #3 |
| 2005 | 697 472 727 273 $ US | #3 |
| 2004 | 639 128 524 350 $ US | #3 |
| 2003 | 537 968 979 592 $ US | #3 |
| 2002 | 479 947 541 966 $ US | #3 |
| 2001 | 450 228 875 774 $ US | #3 |
| 2000 | 447 681 948 858 $ US | #4 |
| 1999 | 427 731 758 615 $ US | #3 |
| 1998 | 412 207 684 664 $ US | #3 |
| 1997 | 393 672 233 137 $ US | #4 |
| 1996 | 367 588 143 526 $ US | #4 |
| 1995 | 339 072 116 143 $ US | #5 |
| 1994 | 294 340 260 178 $ US | #4 |
| 1993 | 264 458 431 314 $ US | #4 |
| 1992 | 275 832 937 873 $ US | #5 |
| 1991 | 259 644 733 686 $ US | #5 |
| 1990 | 272 419 897 017 $ US | #5 |
| 1989 | 241 323 782 723 $ US | #4 |
| 1988 | 229 258 518 321 $ US | #4 |
| 1987 | 188 351 657 134 $ US | #4 |
| 1986 | 152 907 770 449 $ US | #4 |
| 1985 | 130 952 876 027 $ US | #5 |
| 1984 | 127 268 012 769 $ US | #5 |
| 1983 | 121 326 941 034 $ US | #5 |
| 1982 | 122 122 796 995 $ US | #5 |
| 1981 | 125 119 803 055 $ US | #5 |
| 1980 | 137 927 313 502 $ US | #5 |
| 1979 | 118 503 699 704 $ US | #5 |
| 1978 | 89 608 628 955 $ US | #5 |
| 1977 | 76 156 548 055 $ US | #5 |
| 1976 | 67 727 417 790 $ US | #5 |
| 1975 | 65 493 940 265 $ US | #4 |
| 1974 | 65 219 086 022 $ US | #4 |
| 1973 | 47 681 185 693 $ US | #3 |
| 1972 | 35 239 697 802 $ US | #3 |
| 1971 | 30 409 471 891 $ US | #3 |
| 1970 | 27 400 376 770 $ US | #3 |
En 2025, les importations de biens et services du Royaume-Uni s'élevaient à 1,28 billion de dollars, contre 27,4 milliards de dollars en 1970. Elles se classaient au 4e rang mondial, un rang qu'elles occupent depuis 2022. Leur meilleur rang a été le 3e, occupé pour la dernière fois en 2006.
En 2025, les importations de biens et services du Royaume-Uni étaient les 2es plus élevées de 41 pays situés en Europe, après celles de l'Allemagne. En 2025, les importations du Royaume-Uni dépassaient ses exportations de 50,6 milliards de dollars, soit un déficit commercial. Le commerce du Royaume-Uni, exportations et importations réunies, équivalait à 62,5 % de son PIB en 2025, au 116e rang mondial.
Importations de biens du Royaume-Uni par catégorie, 2025
Importations de biens, 2025: 948 Md $US
En 2025, la première catégorie des importations de biens du Royaume-Uni était « machines, électronique et véhicules », avec 34,4 %, suivie de « métaux précieux, pierres précieuses, bijoux, montres, instruments de musique et art », avec 19,6 %.
Origines des importations de biens du Royaume-Uni : les 10 premières, 2025
| Rang | Pays | Importations de biens | Part | |
|---|---|---|---|---|
| 1 |
 États-Unis |
112 Md $US | 11,8 % | vs USA |
| 2 |
 Chine |
108 Md $US | 11,4 % | vs Chine |
| 3 |
 Allemagne |
79,1 Md $US | 8,34 % | vs Allemagne |
| 4 |
 Suisse |
51,7 Md $US | 5,45 % | vs Suisse |
| 5 |
 France |
42,5 Md $US | 4,49 % | vs France |
| 6 |
 Canada |
36,8 Md $US | 3,88 % | vs Canada |
| 7 |
 Italie |
35,6 Md $US | 3,76 % | vs Italie |
| 8 |
 Norvège |
28,4 Md $US | 3 % | vs Norvège |
| 9 |
 Pays-Bas |
27,9 Md $US | 2,94 % | vs Pays-Bas |
| 10 |
 Espagne |
26,6 Md $US | 2,81 % | vs Espagne |
| Autres partenaires et non précisés | 399 Md $US | 42,1 % |
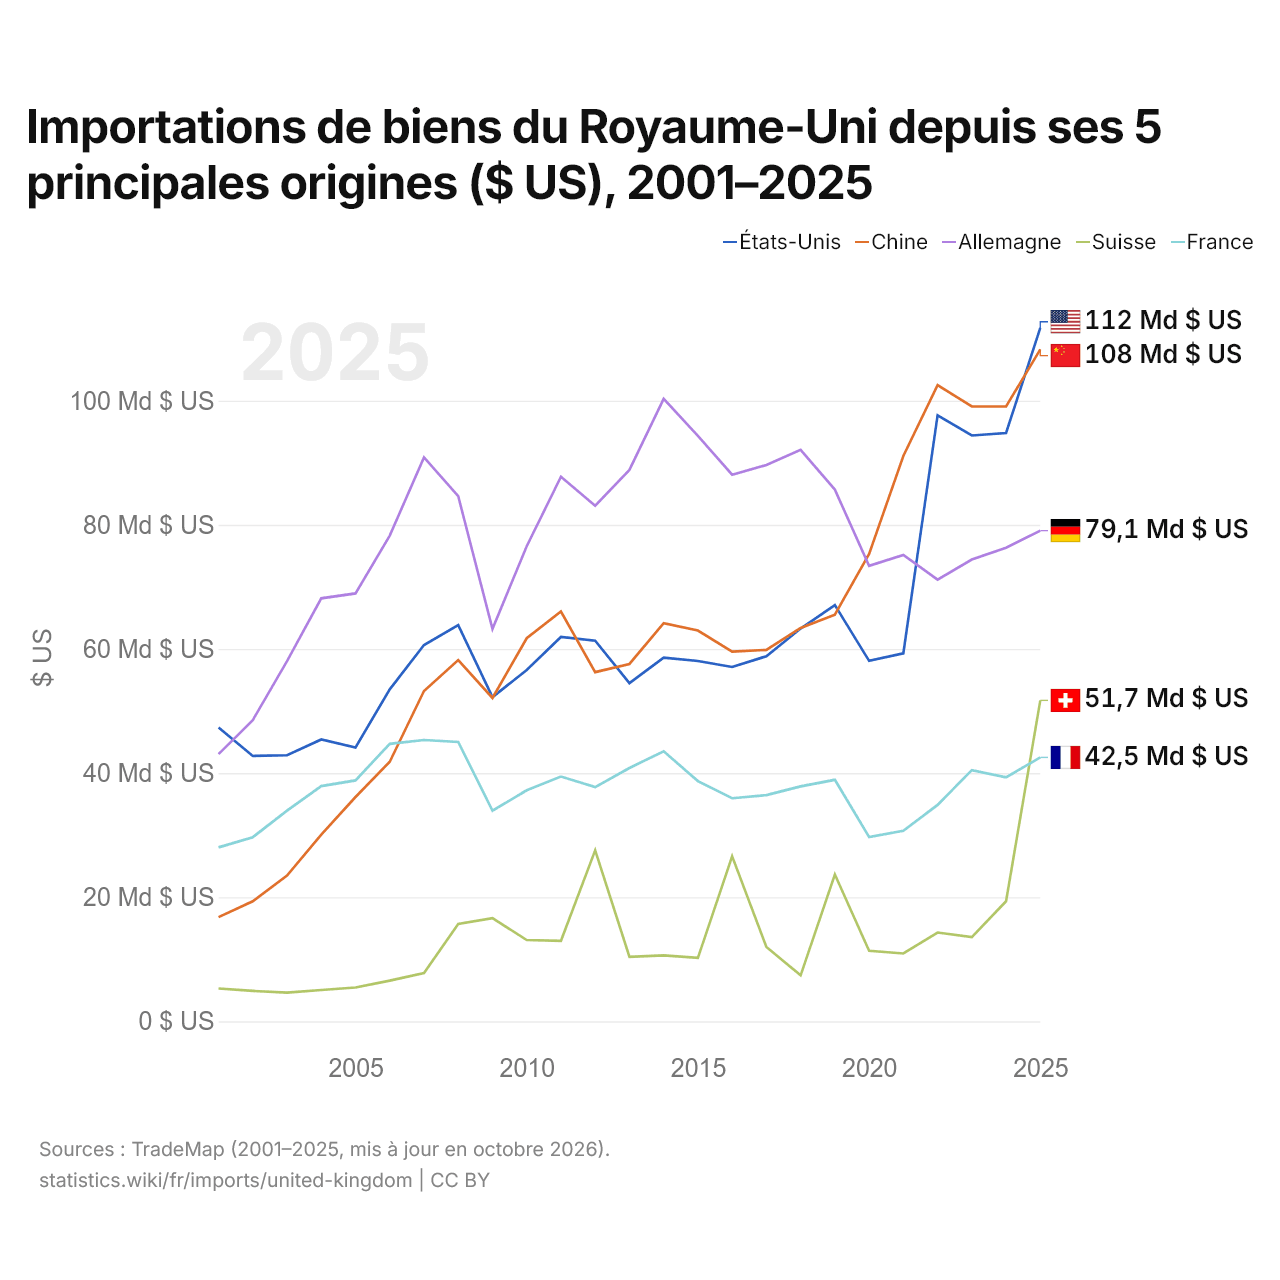
Importations de biens du Royaume-Uni depuis ses 5 principales origines ($ US), 2001–2025
| Année | $ US | ||||
|---|---|---|---|---|---|
| États-Unis | Chine | Allemagne | Suisse | France | |
| 2025 | 111 737 143 000 $ US | 108 275 766 000 $ US | 79 067 582 000 $ US | 51 716 117 000 $ US | 42 522 735 000 $ US |
| 2024 | 94 797 503 000 $ US | 99 075 328 000 $ US | 76 301 573 000 $ US | 19 348 641 000 $ US | 39 317 804 000 $ US |
| 2023 | 94 398 249 000 $ US | 99 084 779 000 $ US | 74 413 970 000 $ US | 13 564 285 000 $ US | 40 477 835 000 $ US |
| 2022 | 97 662 160 000 $ US | 102 521 073 000 $ US | 71 185 155 000 $ US | 14 309 231 000 $ US | 34 876 193 000 $ US |
| 2021 | 59 300 426 000 $ US | 91 108 698 000 $ US | 75 142 388 000 $ US | 10 929 775 000 $ US | 30 701 106 000 $ US |
| 2020 | 58 083 097 000 $ US | 75 298 743 000 $ US | 73 394 637 000 $ US | 11 372 175 000 $ US | 29 691 287 000 $ US |
| 2019 | 67 079 307 000 $ US | 65 529 528 000 $ US | 85 679 090 000 $ US | 23 659 479 000 $ US | 38 915 835 000 $ US |
| 2018 | 63 294 166 000 $ US | 63 391 697 000 $ US | 92 101 404 000 $ US | 7 410 016 000 $ US | 37 854 190 000 $ US |
| 2017 | 58 827 516 000 $ US | 59 860 984 000 $ US | 89 639 326 000 $ US | 11 984 128 000 $ US | 36 458 563 000 $ US |
| 2016 | 57 103 332 000 $ US | 59 575 883 000 $ US | 88 077 491 000 $ US | 26 596 303 000 $ US | 35 949 857 000 $ US |
| 2015 | 58 066 454 000 $ US | 62 979 614 000 $ US | 94 348 064 000 $ US | 10 226 344 000 $ US | 38 703 822 000 $ US |
| 2014 | 58 616 732 000 $ US | 64 147 254 000 $ US | 100 307 056 000 $ US | 10 638 131 000 $ US | 43 522 747 000 $ US |
| 2013 | 54 494 354 000 $ US | 57 587 865 000 $ US | 88 849 201 000 $ US | 10 399 991 000 $ US | 40 823 512 000 $ US |
| 2012 | 61 329 451 000 $ US | 56 267 400 000 $ US | 83 087 742 000 $ US | 27 560 770 000 $ US | 37 745 972 000 $ US |
| 2011 | 61 939 375 000 $ US | 66 039 714 000 $ US | 87 752 114 000 $ US | 12 967 878 000 $ US | 39 439 263 000 $ US |
| 2010 | 56 611 555 000 $ US | 61 733 672 000 $ US | 76 551 720 000 $ US | 13 102 134 000 $ US | 37 227 452 000 $ US |
| 2009 | 52 234 705 000 $ US | 52 101 299 000 $ US | 63 240 203 000 $ US | 16 631 481 000 $ US | 33 934 945 000 $ US |
| 2008 | 63 856 137 000 $ US | 58 220 696 000 $ US | 84 615 733 000 $ US | 15 695 084 000 $ US | 45 021 986 000 $ US |
| 2007 | 60 645 663 000 $ US | 53 227 609 000 $ US | 90 882 625 000 $ US | 7 778 626 000 $ US | 45 330 932 000 $ US |
| 2006 | 53 490 012 000 $ US | 41 828 380 000 $ US | 78 267 412 000 $ US | 6 561 269 000 $ US | 44 720 572 000 $ US |
| 2005 | 44 128 283 000 $ US | 36 153 931 000 $ US | 68 953 200 000 $ US | 5 448 350 000 $ US | 38 823 135 000 $ US |
| 2004 | 45 420 373 000 $ US | 30 097 198 000 $ US | 68 165 138 000 $ US | 5 053 579 000 $ US | 37 904 205 000 $ US |
| 2003 | 42 882 412 000 $ US | 23 495 430 000 $ US | 58 050 824 000 $ US | 4 623 915 000 $ US | 33 949 318 000 $ US |
| 2002 | 42 761 236 000 $ US | 19 346 004 000 $ US | 48 537 137 000 $ US | 4 903 462 000 $ US | 29 674 672 000 $ US |
| 2001 | 47 341 167 000 $ US | 16 790 045 000 $ US | 43 056 874 000 $ US | 5 292 728 000 $ US | 28 031 287 000 $ US |
En 2025, les importations de biens s'élevaient à 112 milliards de dollars en provenance des États-Unis, 108 milliards de dollars en provenance de la Chine, 79,1 milliards de dollars en provenance de l'Allemagne, 51,7 milliards de dollars en provenance de la Suisse et 42,5 milliards de dollars en provenance de la France. Le changement le plus récent dans leur ordre remonte à 2025, quand les importations du Royaume-Uni en provenance des États-Unis ont dépassé celles en provenance de la Chine.
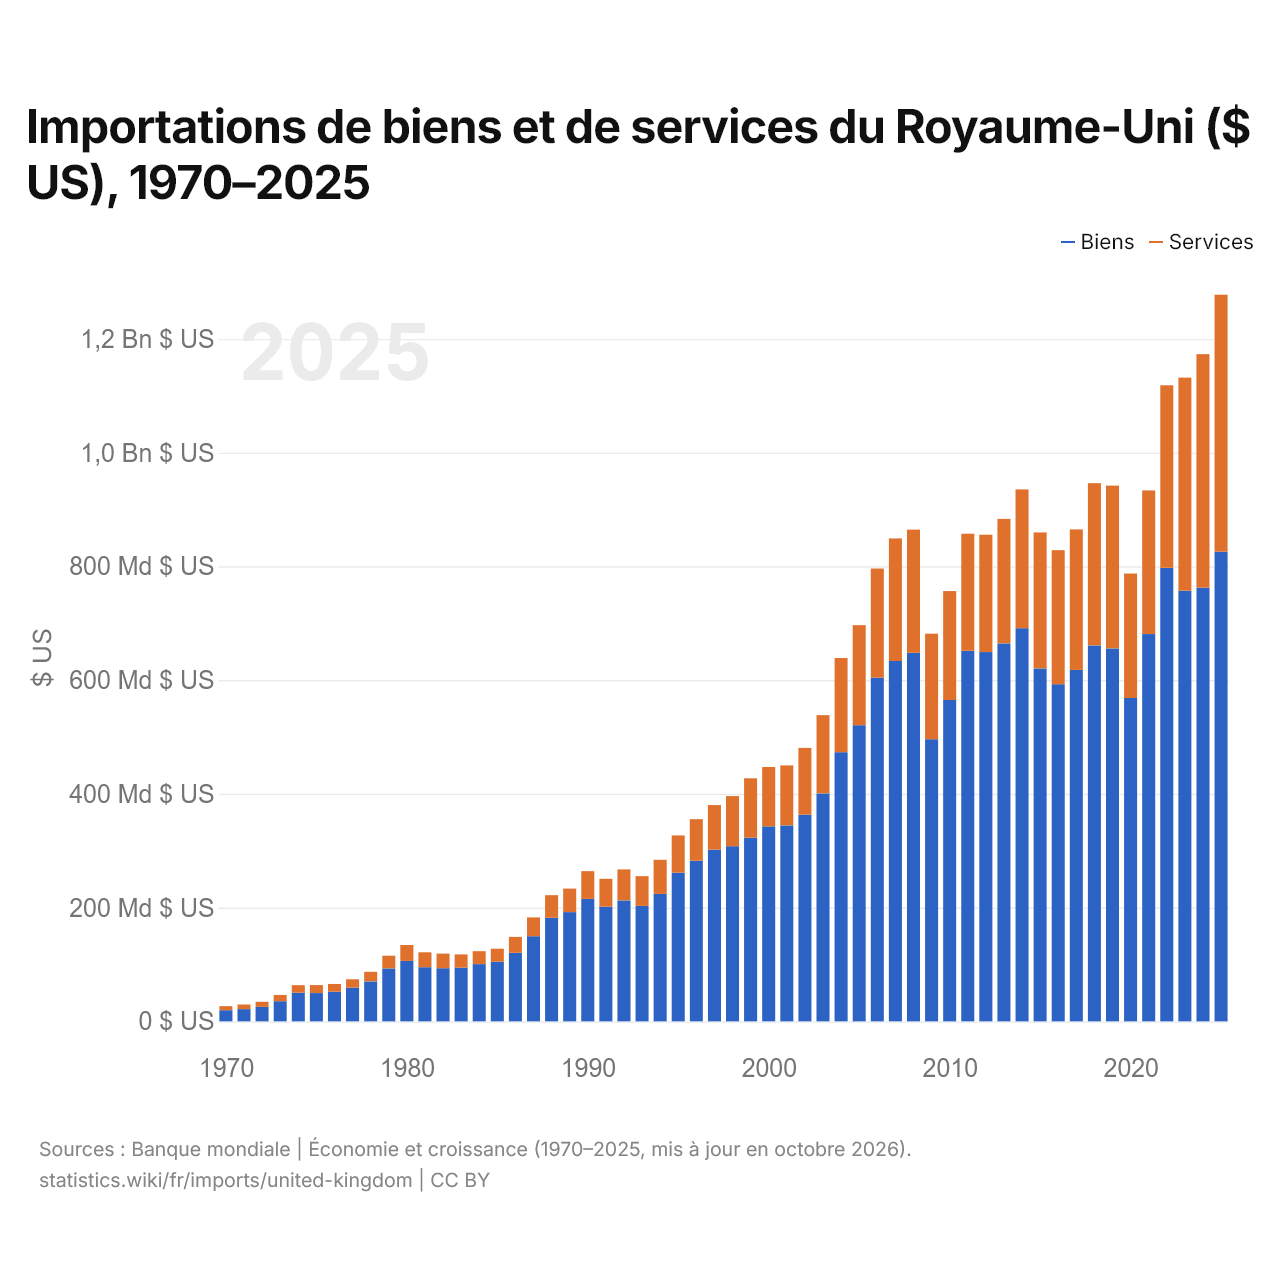
Importations de biens et de services du Royaume-Uni ($ US), 1970–2025
| Année | $ US | |
|---|---|---|
| Biens | Services | |
| 2025 | 825 982 649 505 $ US | 451 778 237 808 $ US |
| 2024 | 762 443 521 219 $ US | 410 746 112 649 $ US |
| 2023 | 757 248 581 077 $ US | 374 628 336 453 $ US |
| 2022 | 797 513 378 356 $ US | 320 920 125 669 $ US |
| 2021 | 680 951 099 973 $ US | 252 683 183 367 $ US |
| 2020 | 568 514 940 475 $ US | 218 840 883 413 $ US |
| 2019 | 655 676 175 048 $ US | 286 306 505 998 $ US |
| 2018 | 660 958 038 393 $ US | 285 376 986 735 $ US |
| 2017 | 618 022 651 733 $ US | 247 027 933 808 $ US |
| 2016 | 592 757 677 234 $ US | 235 738 628 885 $ US |
| 2015 | 620 553 414 216 $ US | 239 125 398 513 $ US |
| 2014 | 691 362 740 577 $ US | 243 905 254 346 $ US |
| 2013 | 664 458 006 060 $ US | 219 079 586 931 $ US |
| 2012 | 649 287 062 353 $ US | 206 370 892 626 $ US |
| 2011 | 651 546 852 841 $ US | 205 869 210 050 $ US |
| 2010 | 565 049 983 298 $ US | 191 582 670 264 $ US |
| 2009 | 496 173 740 091 $ US | 185 401 241 679 $ US |
| 2008 | 647 924 214 179 $ US | 216 640 965 425 $ US |
| 2007 | 633 587 053 599 $ US | 215 638 724 926 $ US |
| 2006 | 604 264 468 191 $ US | 192 004 047 717 $ US |
| 2005 | 520 614 537 775 $ US | 176 000 646 168 $ US |
| 2004 | 473 315 591 230 $ US | 165 623 339 401 $ US |
| 2003 | 400 783 362 905 $ US | 137 588 151 775 $ US |
| 2002 | 363 290 483 106 $ US | 117 571 974 741 $ US |
| 2001 | 344 543 433 483 $ US | 105 456 343 686 $ US |
| 2000 | 342 874 818 376 $ US | 104 305 290 911 $ US |
| 1999 | 323 207 898 632 $ US | 104 254 276 182 $ US |
| 1998 | 307 850 547 388 $ US | 88 298 834 704 $ US |
| 1997 | 301 739 432 060 $ US | 78 541 498 195 $ US |
| 1996 | 282 475 479 557 $ US | 73 017 971 833 $ US |
| 1995 | 261 323 849 676 $ US | 65 676 593 106 $ US |
| 1994 | 224 135 220 777 $ US | 59 958 833 104 $ US |
| 1993 | 202 960 810 653 $ US | 52 306 552 792 $ US |
| 1992 | 212 698 257 093 $ US | 54 523 019 838 $ US |
| 1991 | 201 673 601 463 $ US | 48 999 535 808 $ US |
| 1990 | 215 352 807 241 $ US | 48 736 688 987 $ US |
| 1989 | 192 055 820 638 $ US | 41 395 146 523 $ US |
| 1988 | 182 016 526 011 $ US | 39 731 931 506 $ US |
| 1987 | 149 675 610 290 $ US | 33 140 709 632 $ US |
| 1986 | 120 487 898 958 $ US | 27 972 076 398 $ US |
| 1985 | 104 817 097 629 $ US | 22 956 588 432 $ US |
| 1984 | 100 600 735 984 $ US | 22 828 432 635 $ US |
| 1983 | 94 339 908 423 $ US | 23 269 713 518 $ US |
| 1982 | 93 492 301 474 $ US | 25 553 305 447 $ US |
| 1981 | 95 198 256 335 $ US | 26 305 792 415 $ US |
| 1980 | 106 267 189 126 $ US | 27 932 791 346 $ US |
| 1979 | 92 990 917 347 $ US | 22 433 430 523 $ US |
| 1978 | 70 184 832 159 $ US | 16 872 222 016 $ US |
| 1977 | 59 323 424 551 $ US | 14 624 432 050 $ US |
| 1976 | 52 103 384 214 $ US | 13 604 538 994 $ US |
| 1975 | 49 747 144 035 $ US | 14 063 443 275 $ US |
| 1974 | 50 347 012 950 $ US | 13 189 958 766 $ US |
| 1973 | 35 361 355 172 $ US | 11 033 807 841 $ US |
| 1972 | 25 353 459 823 $ US | 8 947 352 495 $ US |
| 1971 | 21 473 749 824 $ US | 8 133 292 934 $ US |
| 1970 | 19 540 784 395 $ US | 7 106 394 325 $ US |
En 2025, les importations de biens du Royaume-Uni s'élevaient à 826 milliards de dollars et celles de services à 452 milliards de dollars ; les services représentaient 35,4 % du total, contre 26,7 % en 1970.
Le Royaume-Uni dans le classement mondial des importations, 2025



Importations de biens et services du Royaume-Uni, % du PIB, 1970–2025
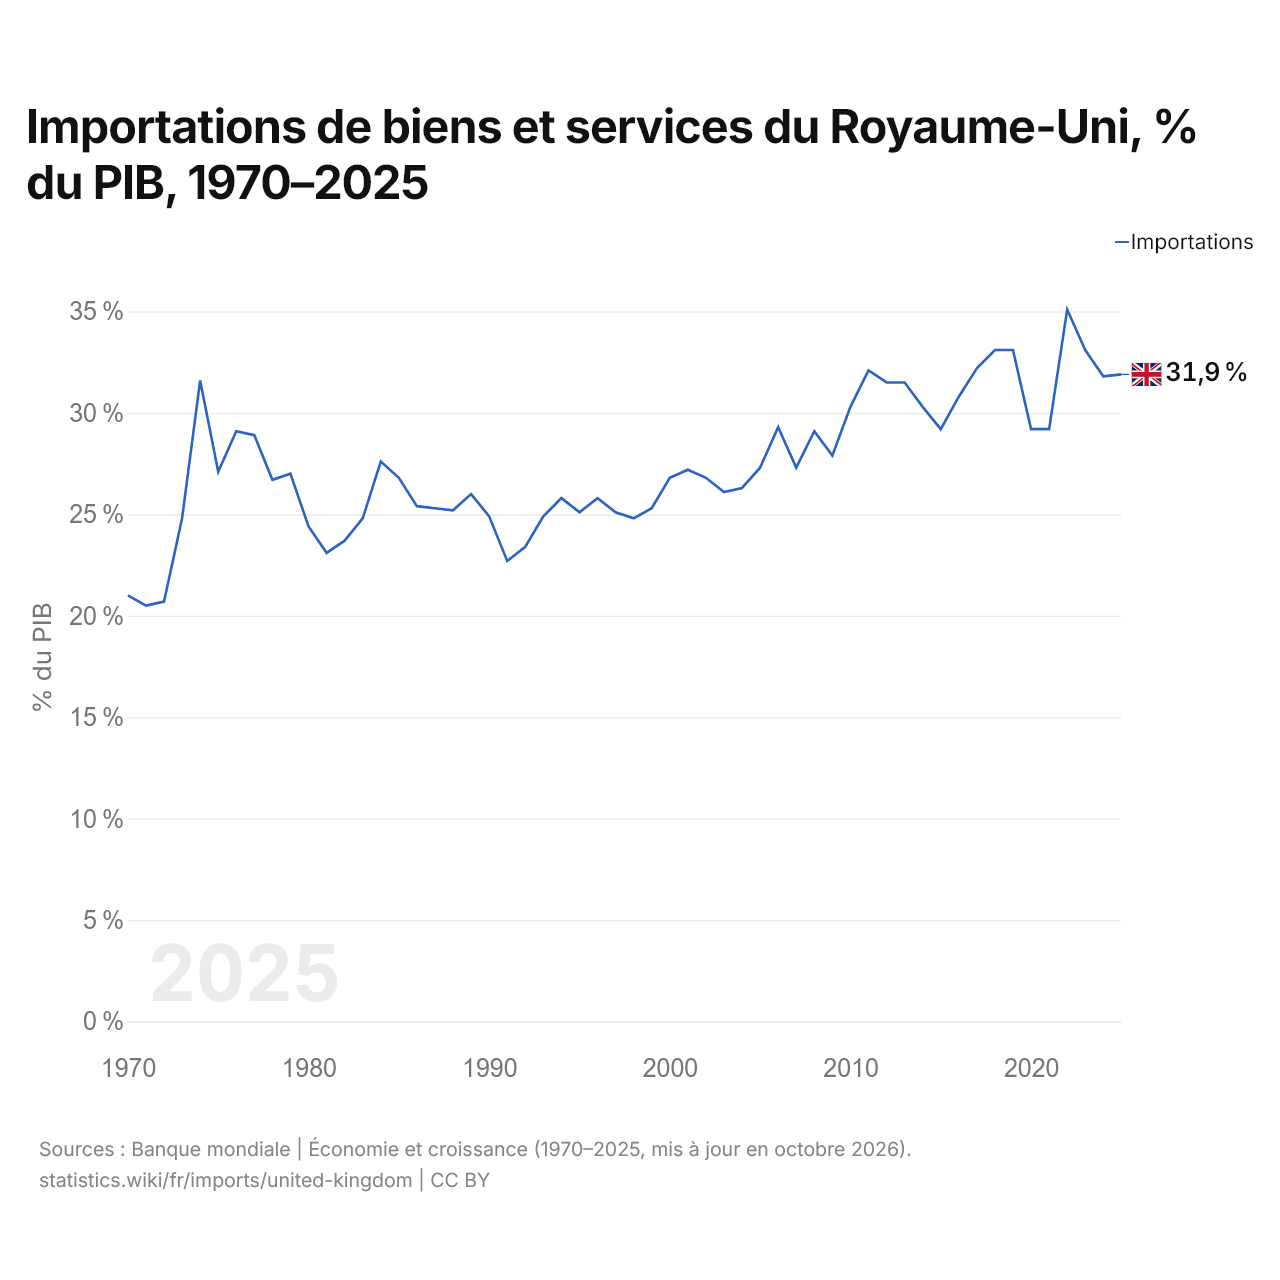
En 2025, les importations de biens et services du Royaume-Uni équivalaient à 31,9 % de son PIB, contre 21,0 % en 1970. La part la plus élevée a été de 35,1 %, en 2022.
Comparer les importations du Royaume-Uni avec celles d'autres pays
Sources :
- TradeMap (2001–2025, mis à jour en octobre 2026)
- Banque mondiale | Économie et croissance (1970–2025, mis à jour en octobre 2026)
Creative Commons Attribution (CC BY) : vous pouvez copier, partager, adapter et réutiliser ce contenu, y compris à des fins commerciales, à condition de citer statistics.wiki et d’indiquer les modifications apportées. Les sources citées ci-dessus peuvent avoir leurs propres conditions de licence.