
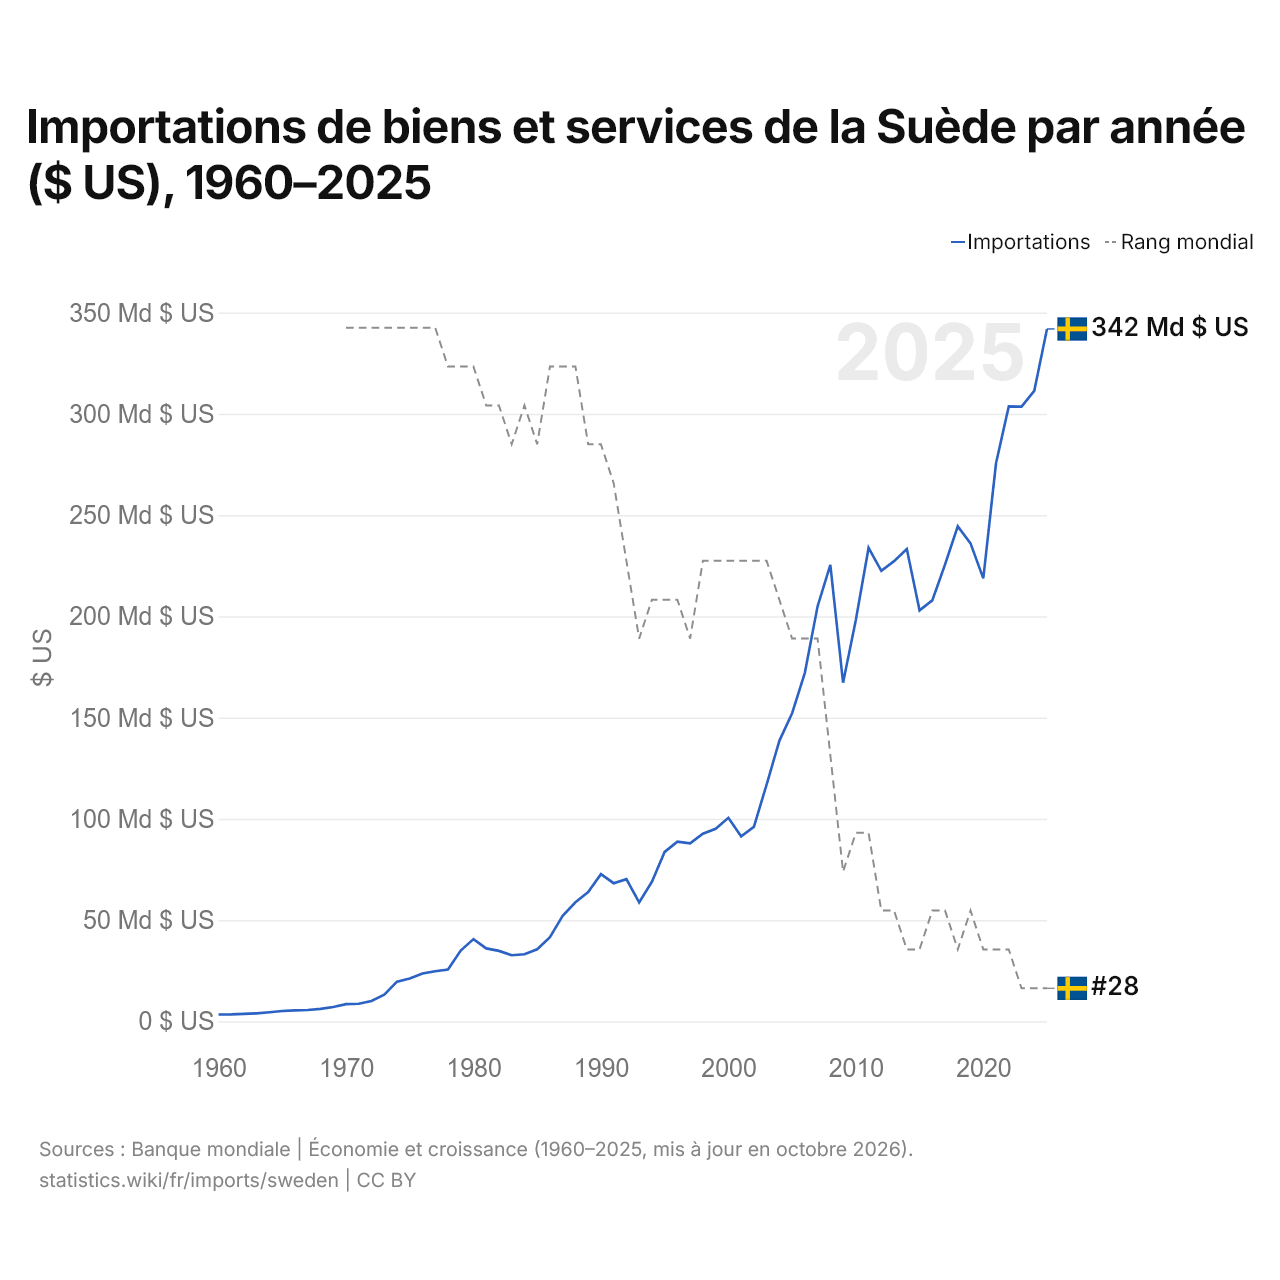
Importations de biens et services de la Suède par année ($ US), 1960–2025
| Année | $ US | Rang mondial |
|---|---|---|
| Importations | Rang mondial | |
| 2025 | 341 902 516 919 $ US | #28 |
| 2024 | 311 306 792 242 $ US | #28 |
| 2023 | 303 529 221 657 $ US | #28 |
| 2022 | 303 635 821 943 $ US | #27 |
| 2021 | 275 582 535 325 $ US | #27 |
| 2020 | 218 725 234 276 $ US | #27 |
| 2019 | 236 048 697 363 $ US | #26 |
| 2018 | 244 417 315 964 $ US | #27 |
| 2017 | 225 583 506 107 $ US | #26 |
| 2016 | 207 862 500 839 $ US | #26 |
| 2015 | 202 956 408 286 $ US | #27 |
| 2014 | 233 195 472 530 $ US | #27 |
| 2013 | 227 247 994 887 $ US | #26 |
| 2012 | 222 449 369 430 $ US | #26 |
| 2011 | 233 787 459 646 $ US | #24 |
| 2010 | 198 157 087 923 $ US | #24 |
| 2009 | 167 206 485 667 $ US | #25 |
| 2008 | 225 371 485 791 $ US | #22 |
| 2007 | 204 952 210 452 $ US | #19 |
| 2006 | 172 103 900 680 $ US | #19 |
| 2005 | 152 117 327 481 $ US | #19 |
| 2004 | 138 501 544 449 $ US | #18 |
| 2003 | 116 899 076 215 $ US | #17 |
| 2002 | 96 049 747 872 $ US | #17 |
| 2001 | 91 348 132 945 $ US | #17 |
| 2000 | 100 499 443 365 $ US | #17 |
| 1999 | 95 109 169 249 $ US | #17 |
| 1998 | 92 655 630 888 $ US | #17 |
| 1997 | 87 887 333 167 $ US | #19 |
| 1996 | 88 694 154 489 $ US | #18 |
| 1995 | 83 696 886 434 $ US | #18 |
| 1994 | 68 924 572 317 $ US | #18 |
| 1993 | 58 755 042 783 $ US | #19 |
| 1992 | 70 211 547 443 $ US | #17 |
| 1991 | 68 211 777 594 $ US | #15 |
| 1990 | 72 704 404 947 $ US | #14 |
| 1989 | 63 887 689 897 $ US | #14 |
| 1988 | 58 782 877 823 $ US | #12 |
| 1987 | 52 071 738 849 $ US | #12 |
| 1986 | 41 574 831 686 $ US | #12 |
| 1985 | 35 584 567 928 $ US | #14 |
| 1984 | 33 130 075 921 $ US | #13 |
| 1983 | 32 645 095 929 $ US | #14 |
| 1982 | 34 770 640 977 $ US | #13 |
| 1981 | 36 020 657 858 $ US | #13 |
| 1980 | 40 613 126 300 $ US | #12 |
| 1979 | 34 937 462 154 $ US | #12 |
| 1978 | 25 608 957 619 $ US | #12 |
| 1977 | 24 746 102 062 $ US | #11 |
| 1976 | 23 627 331 206 $ US | #11 |
| 1975 | 21 182 621 020 $ US | #11 |
| 1974 | 19 623 805 920 $ US | #11 |
| 1973 | 13 198 116 685 $ US | #11 |
| 1972 | 10 009 365 236 $ US | #11 |
| 1971 | 8 687 795 704 $ US | #11 |
| 1970 | 8 470 278 358 $ US | #11 |
| 1969 | 7 096 025 481 $ US | - |
| 1968 | 6 121 510 458 $ US | - |
| 1967 | 5 610 432 438 $ US | - |
| 1966 | 5 401 663 227 $ US | - |
| 1965 | 5 103 033 951 $ US | - |
| 1964 | 4 503 064 316 $ US | - |
| 1963 | 3 969 327 638 $ US | - |
| 1962 | 3 645 522 311 $ US | - |
| 1961 | 3 408 478 200 $ US | - |
| 1960 | 3 384 851 091 $ US | - |
En 2025, les importations de biens et services de la Suède s'élevaient à 342 milliards de dollars, contre 3,38 milliards de dollars en 1960. Elles se classaient au 28e rang mondial, un rang qu'elles occupent depuis 2023. Leur meilleur rang a été le 11e, occupé pour la dernière fois en 1977.
En 2025, les importations de biens et services de la Suède étaient les 12es plus élevées de 41 pays situés en Europe. En 2025, les exportations de la Suède dépassaient ses importations de 14,2 milliards de dollars, soit un excédent commercial. Le commerce de la Suède, exportations et importations réunies, équivalait à 104,3 % de son PIB en 2025, au 54e rang mondial.
Importations de biens de la Suède par catégorie, 2025
Importations de biens, 2025: 202 Md $US
En 2025, la première catégorie des importations de biens de la Suède était « machines, électronique et véhicules », avec 40,3 %, suivie de « pétrole, gaz, minerais et autres matières premières », avec 12,4 %.
Origines des importations de biens de la Suède : les 10 premières, 2025
| Rang | Pays | Importations de biens | Part | |
|---|---|---|---|---|
| 1 |
 Allemagne |
32,2 Md $US | 15,9 % | vs Allemagne |
| 2 |
 Pays-Bas |
22,1 Md $US | 10,9 % | vs Pays-Bas |
| 3 |
 Norvège |
17,8 Md $US | 8,81 % | vs Norvège |
| 4 |
 Danemark |
13,6 Md $US | 6,72 % | vs Danemark |
| 5 |
 Chine |
12,9 Md $US | 6,36 % | |
| 6 |
 Belgique |
9,90 Md $US | 4,9 % | vs Belgique |
| 7 |
 Finlande |
9,87 Md $US | 4,88 % | vs Finlande |
| 8 |
 Pologne |
9,66 Md $US | 4,78 % | vs Pologne |
| 9 |
 États-Unis |
8,73 Md $US | 4,32 % | vs USA |
| 10 |
 France |
6,93 Md $US | 3,43 % | vs France |
| Autres partenaires et non précisés | 58,6 Md $US | 29 % |
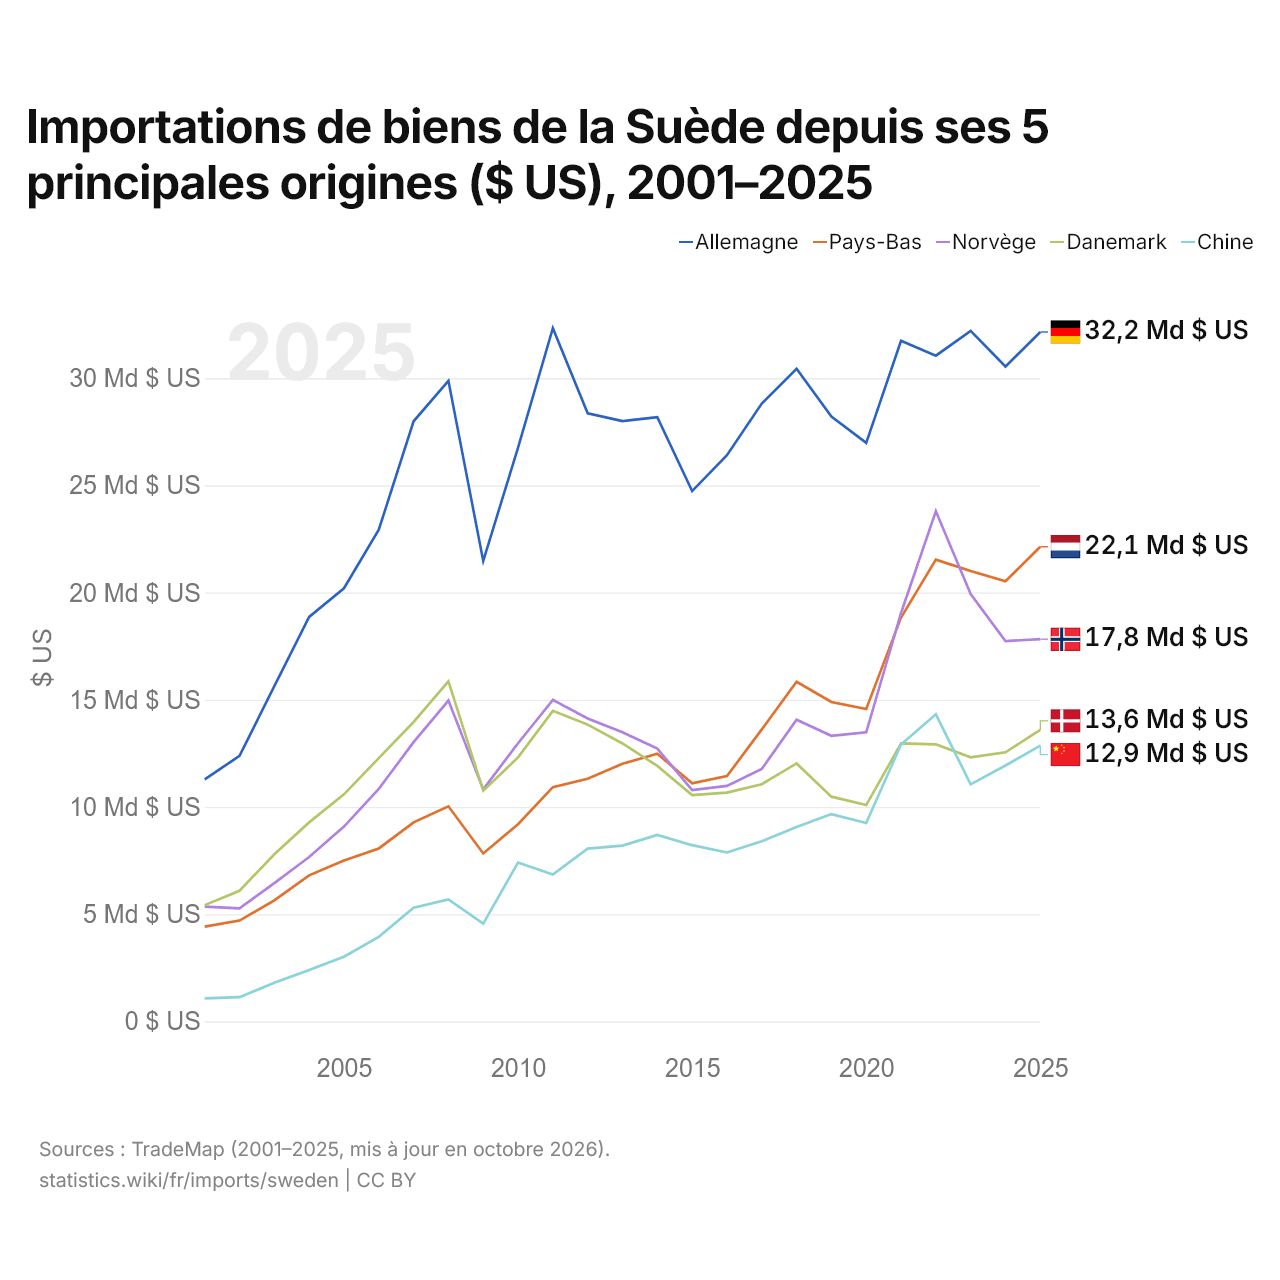
Importations de biens de la Suède depuis ses 5 principales origines ($ US), 2001–2025
| Année | $ US | ||||
|---|---|---|---|---|---|
| Allemagne | Pays-Bas | Norvège | Danemark | Chine | |
| 2025 | 32 150 142 000 $ US | 22 137 455 000 $ US | 17 823 207 000 $ US | 13 592 240 000 $ US | 12 859 771 000 $ US |
| 2024 | 30 538 262 000 $ US | 20 522 563 000 $ US | 17 737 312 000 $ US | 12 547 343 000 $ US | 11 930 337 000 $ US |
| 2023 | 32 201 517 000 $ US | 20 999 514 000 $ US | 19 928 700 000 $ US | 12 312 153 000 $ US | 11 054 665 000 $ US |
| 2022 | 31 047 077 000 $ US | 21 532 501 000 $ US | 23 792 502 000 $ US | 12 920 239 000 $ US | 14 321 195 000 $ US |
| 2021 | 31 739 724 000 $ US | 18 835 282 000 $ US | 19 043 839 000 $ US | 12 960 304 000 $ US | 12 908 673 000 $ US |
| 2020 | 26 978 661 000 $ US | 14 568 652 000 $ US | 13 481 435 000 $ US | 10 087 227 000 $ US | 9 248 034 000 $ US |
| 2019 | 28 208 437 000 $ US | 14 893 745 000 $ US | 13 316 326 000 $ US | 10 478 716 000 $ US | 9 665 745 000 $ US |
| 2018 | 30 438 163 000 $ US | 15 836 001 000 $ US | 14 065 433 000 $ US | 12 027 154 000 $ US | 9 059 115 000 $ US |
| 2017 | 28 813 210 000 $ US | 13 614 124 000 $ US | 11 768 746 000 $ US | 11 056 445 000 $ US | 8 401 806 000 $ US |
| 2016 | 26 403 305 000 $ US | 11 435 337 000 $ US | 10 981 841 000 $ US | 10 668 068 000 $ US | 7 876 689 000 $ US |
| 2015 | 24 728 937 000 $ US | 11 100 990 000 $ US | 10 786 057 000 $ US | 10 554 444 000 $ US | 8 216 407 000 $ US |
| 2014 | 28 182 621 000 $ US | 12 483 247 000 $ US | 12 719 508 000 $ US | 11 911 365 000 $ US | 8 695 062 000 $ US |
| 2013 | 27 992 318 000 $ US | 12 012 513 000 $ US | 13 482 148 000 $ US | 12 959 966 000 $ US | 8 197 296 000 $ US |
| 2012 | 28 357 935 000 $ US | 11 314 400 000 $ US | 14 123 167 000 $ US | 13 839 501 000 $ US | 8 053 266 000 $ US |
| 2011 | 32 328 558 000 $ US | 10 921 233 000 $ US | 14 994 913 000 $ US | 14 479 886 000 $ US | 6 845 033 000 $ US |
| 2010 | 26 758 232 000 $ US | 9 195 966 000 $ US | 12 970 540 000 $ US | 12 308 794 000 $ US | 7 407 657 000 $ US |
| 2009 | 21 472 500 000 $ US | 7 829 360 000 $ US | 10 823 112 000 $ US | 10 758 182 000 $ US | 4 558 649 000 $ US |
| 2008 | 29 875 826 000 $ US | 10 030 362 000 $ US | 14 962 001 000 $ US | 15 860 884 000 $ US | 5 686 115 000 $ US |
| 2007 | 27 986 156 000 $ US | 9 279 641 000 $ US | 13 018 302 000 $ US | 13 962 510 000 $ US | 5 296 175 000 $ US |
| 2006 | 22 926 763 000 $ US | 8 063 078 000 $ US | 10 840 008 000 $ US | 12 278 339 000 $ US | 3 938 725 000 $ US |
| 2005 | 20 199 921 000 $ US | 7 504 382 000 $ US | 9 080 770 000 $ US | 10 587 122 000 $ US | 3 012 114 000 $ US |
| 2004 | 18 864 407 000 $ US | 6 809 052 000 $ US | 7 662 562 000 $ US | 9 278 524 000 $ US | 2 396 057 000 $ US |
| 2003 | 15 639 192 000 $ US | 5 637 662 000 $ US | 6 447 212 000 $ US | 7 793 470 000 $ US | 1 796 532 000 $ US |
| 2002 | 12 381 305 000 $ US | 4 700 058 000 $ US | 5 267 070 000 $ US | 6 090 528 000 $ US | 1 126 310 000 $ US |
| 2001 | 11 280 896 000 $ US | 4 414 783 000 $ US | 5 350 449 000 $ US | 5 420 265 000 $ US | 1 070 462 000 $ US |
En 2025, les importations de biens s'élevaient à 32,2 milliards de dollars en provenance de l'Allemagne, 22,1 milliards de dollars en provenance des Pays-Bas, 17,8 milliards de dollars en provenance de la Norvège, 13,6 milliards de dollars en provenance du Danemark et 12,9 milliards de dollars en provenance de la Chine. Le premier rang des cinq fournisseurs de la Suède est occupé par l'Allemagne chaque année depuis 2001. Le changement le plus récent dans leur ordre remonte à 2023, quand les importations de la Suède en provenance des Pays-Bas ont dépassé celles en provenance de la Norvège.
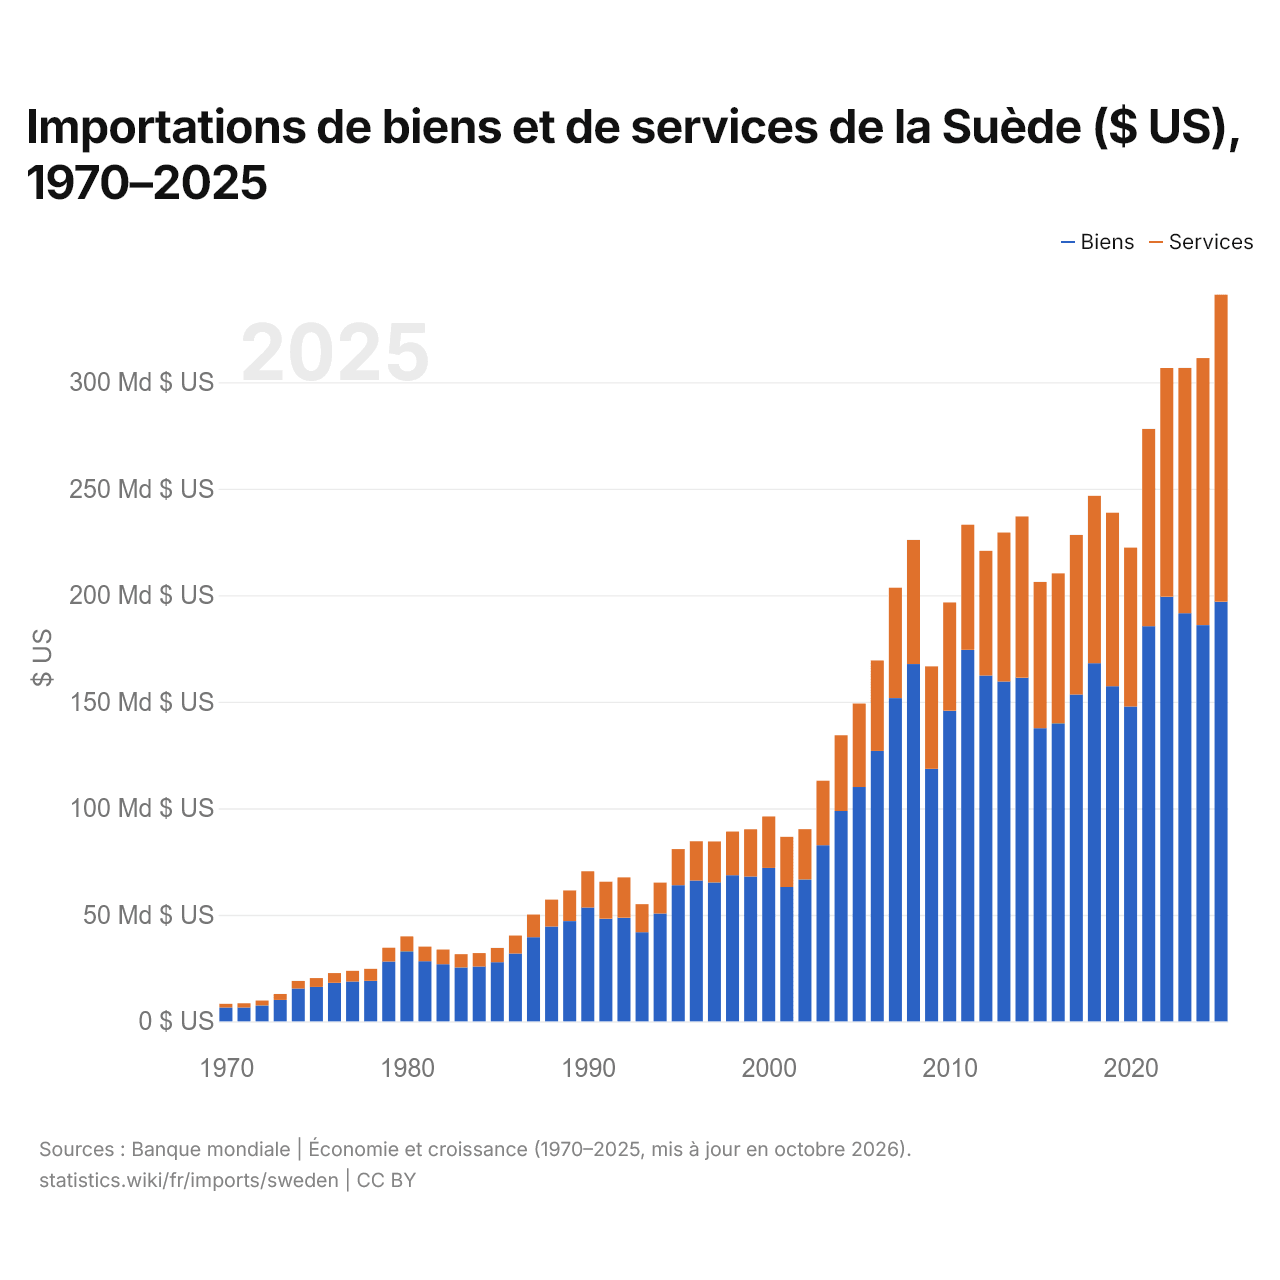
Importations de biens et de services de la Suède ($ US), 1970–2025
| Année | $ US | |
|---|---|---|
| Biens | Services | |
| 2025 | 197 003 057 015 $ US | 144 102 105 638 $ US |
| 2024 | 185 992 342 147 $ US | 125 341 292 916 $ US |
| 2023 | 191 582 101 391 $ US | 115 124 396 002 $ US |
| 2022 | 199 351 068 805 $ US | 107 334 954 751 $ US |
| 2021 | 185 462 528 593 $ US | 92 635 038 043 $ US |
| 2020 | 147 722 801 387 $ US | 74 656 713 994 $ US |
| 2019 | 157 342 459 452 $ US | 81 384 086 129 $ US |
| 2018 | 168 079 242 312 $ US | 78 577 263 350 $ US |
| 2017 | 153 394 258 189 $ US | 74 924 072 262 $ US |
| 2016 | 139 892 326 976 $ US | 70 379 092 714 $ US |
| 2015 | 137 620 084 869 $ US | 68 638 200 614 $ US |
| 2014 | 161 312 272 266 $ US | 75 686 121 994 $ US |
| 2013 | 159 505 934 581 $ US | 69 935 961 885 $ US |
| 2012 | 162 317 131 702 $ US | 58 534 889 951 $ US |
| 2011 | 174 402 916 425 $ US | 58 713 594 190 $ US |
| 2010 | 145 834 181 111 $ US | 50 769 996 676 $ US |
| 2009 | 118 525 730 733 $ US | 48 120 340 032 $ US |
| 2008 | 167 702 237 865 $ US | 58 286 049 663 $ US |
| 2007 | 151 731 442 716 $ US | 51 805 399 635 $ US |
| 2006 | 126 940 425 121 $ US | 42 440 903 815 $ US |
| 2005 | 109 981 734 347 $ US | 39 194 173 195 $ US |
| 2004 | 98 735 000 252 $ US | 35 549 566 072 $ US |
| 2003 | 82 651 603 150 $ US | 30 275 175 254 $ US |
| 2002 | 66 634 787 490 $ US | 23 578 501 579 $ US |
| 2001 | 63 063 982 065 $ US | 23 547 259 714 $ US |
| 2000 | 72 038 724 285 $ US | 24 127 353 438 $ US |
| 1999 | 68 007 214 263 $ US | 22 154 357 221 $ US |
| 1998 | 68 566 956 415 $ US | 20 508 796 836 $ US |
| 1997 | 65 194 776 020 $ US | 19 244 974 356 $ US |
| 1996 | 66 053 426 253 $ US | 18 479 219 980 $ US |
| 1995 | 63 925 590 887 $ US | 16 945 646 531 $ US |
| 1994 | 50 641 231 643 $ US | 14 474 300 868 $ US |
| 1993 | 41 800 822 224 $ US | 13 202 228 265 $ US |
| 1992 | 48 642 345 680 $ US | 18 915 347 534 $ US |
| 1991 | 48 185 384 294 $ US | 17 352 138 178 $ US |
| 1990 | 53 432 614 713 $ US | 17 027 406 847 $ US |
| 1989 | 47 053 517 534 $ US | 14 388 901 798 $ US |
| 1988 | 44 487 370 049 $ US | 12 662 049 248 $ US |
| 1987 | 39 527 737 566 $ US | 10 605 981 911 $ US |
| 1986 | 31 810 718 013 $ US | 8 462 889 299 $ US |
| 1985 | 27 788 093 759 $ US | 6 681 183 148 $ US |
| 1984 | 25 701 153 065 $ US | 6 333 752 537 $ US |
| 1983 | 25 303 240 759 $ US | 6 224 336 456 $ US |
| 1982 | 26 797 187 869 $ US | 6 909 038 563 $ US |
| 1981 | 28 225 734 332 $ US | 6 862 858 672 $ US |
| 1980 | 32 859 798 893 $ US | 7 017 771 724 $ US |
| 1979 | 28 071 657 282 $ US | 6 470 643 920 $ US |
| 1978 | 19 023 296 975 $ US | 5 610 096 149 $ US |
| 1977 | 18 654 463 576 $ US | 5 036 552 249 $ US |
| 1976 | 18 124 403 977 $ US | 4 516 798 886 $ US |
| 1975 | 16 181 468 714 $ US | 4 144 029 723 $ US |
| 1974 | 15 405 148 193 $ US | 3 554 514 380 $ US |
| 1973 | 10 065 830 903 $ US | 2 775 201 787 $ US |
| 1972 | 7 479 395 967 $ US | 2 284 554 411 $ US |
| 1971 | 6 508 118 740 $ US | 1 956 727 547 $ US |
| 1970 | 6 446 674 303 $ US | 1 776 459 876 $ US |
En 2025, les importations de biens de la Suède s'élevaient à 197 milliards de dollars et celles de services à 144 milliards de dollars ; les services représentaient 42,2 % du total, contre 21,6 % en 1970.
La Suède dans le classement mondial des importations, 2025







Importations de biens et services de la Suède, % du PIB, 1960–2025
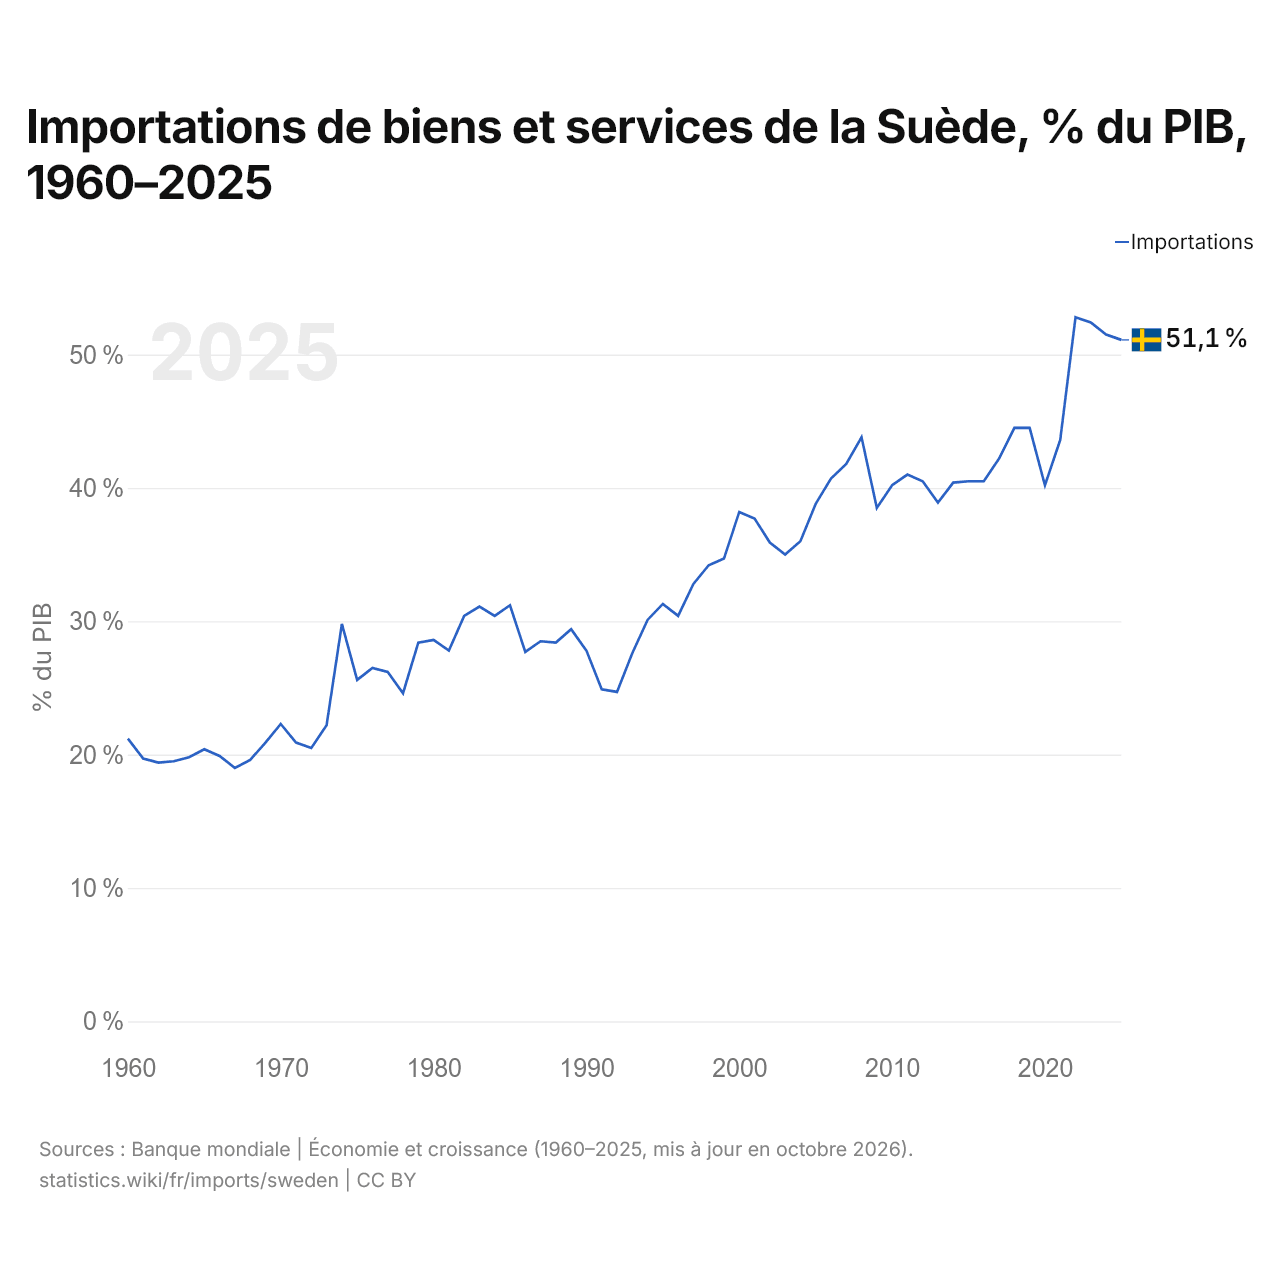
En 2025, les importations de biens et services de la Suède équivalaient à 51,1 % de son PIB, contre 21,2 % en 1960. La part la plus élevée a été de 52,8 %, en 2022.
Comparer les importations de la Suède avec celles d'autres pays
Sources :
- TradeMap (2001–2025, mis à jour en octobre 2026)
- Banque mondiale | Économie et croissance (1960–2025, mis à jour en octobre 2026)
Creative Commons Attribution (CC BY) : vous pouvez copier, partager, adapter et réutiliser ce contenu, y compris à des fins commerciales, à condition de citer statistics.wiki et d’indiquer les modifications apportées. Les sources citées ci-dessus peuvent avoir leurs propres conditions de licence.