
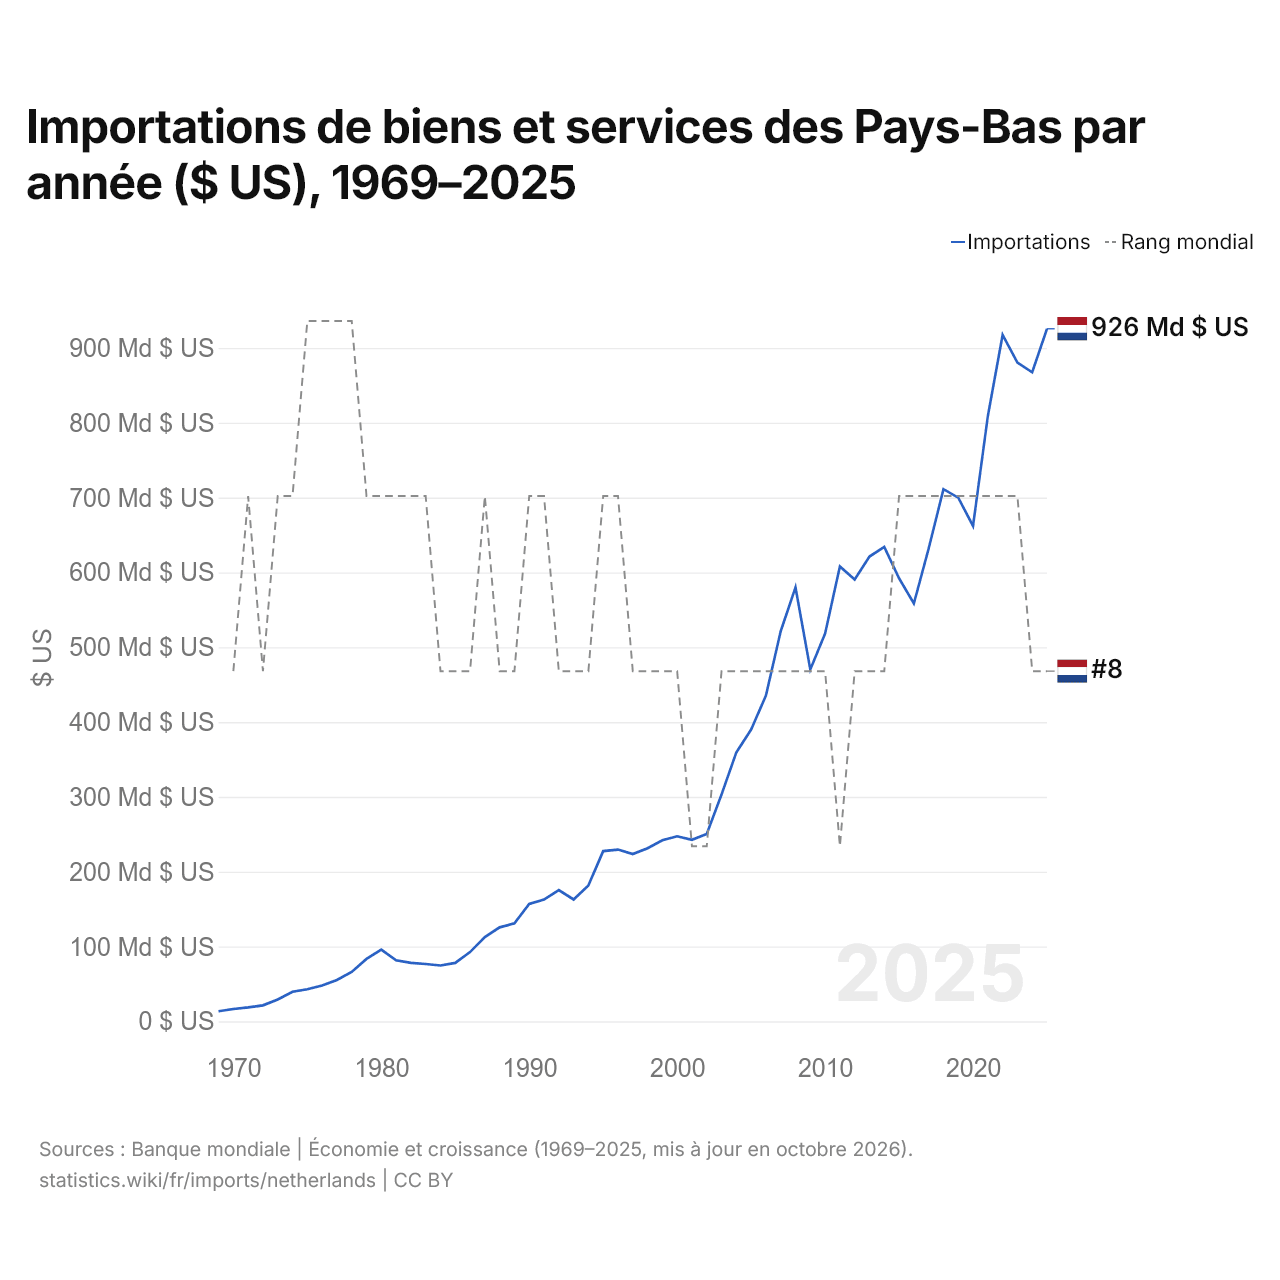
Importations de biens et services des Pays-Bas par année ($ US), 1969–2025
| Année | $ US | Rang mondial |
|---|---|---|
| Importations | Rang mondial | |
| 2025 | 925 615 517 034 $ US | #8 |
| 2024 | 867 461 920 495 $ US | #8 |
| 2023 | 880 497 587 437 $ US | #7 |
| 2022 | 917 438 087 562 $ US | #7 |
| 2021 | 808 831 153 930 $ US | #7 |
| 2020 | 662 040 850 865 $ US | #7 |
| 2019 | 699 981 663 067 $ US | #7 |
| 2018 | 711 271 186 937 $ US | #7 |
| 2017 | 631 649 933 012 $ US | #7 |
| 2016 | 558 461 399 909 $ US | #7 |
| 2015 | 592 155 905 830 $ US | #7 |
| 2014 | 634 097 409 855 $ US | #8 |
| 2013 | 621 247 134 614 $ US | #8 |
| 2012 | 590 440 051 624 $ US | #8 |
| 2011 | 607 986 567 101 $ US | #9 |
| 2010 | 518 250 485 050 $ US | #8 |
| 2009 | 470 309 474 397 $ US | #8 |
| 2008 | 579 974 770 036 $ US | #8 |
| 2007 | 521 387 406 195 $ US | #8 |
| 2006 | 435 548 397 900 $ US | #8 |
| 2005 | 389 965 072 237 $ US | #8 |
| 2004 | 359 456 671 940 $ US | #8 |
| 2003 | 303 246 002 571 $ US | #8 |
| 2002 | 250 343 480 545 $ US | #9 |
| 2001 | 242 665 446 715 $ US | #9 |
| 2000 | 247 348 982 303 $ US | #8 |
| 1999 | 241 942 977 209 $ US | #8 |
| 1998 | 231 284 159 076 $ US | #8 |
| 1997 | 223 487 689 180 $ US | #8 |
| 1996 | 229 597 385 621 $ US | #7 |
| 1995 | 227 502 058 743 $ US | #7 |
| 1994 | 181 718 131 735 $ US | #8 |
| 1993 | 162 828 808 733 $ US | #8 |
| 1992 | 175 443 091 479 $ US | #8 |
| 1991 | 162 784 113 626 $ US | #7 |
| 1990 | 157 018 155 634 $ US | #7 |
| 1989 | 130 992 629 118 $ US | #8 |
| 1988 | 125 626 371 948 $ US | #8 |
| 1987 | 112 600 253 481 $ US | #7 |
| 1986 | 92 542 898 003 $ US | #8 |
| 1985 | 78 045 086 253 $ US | #8 |
| 1984 | 74 599 745 192 $ US | #8 |
| 1983 | 76 616 167 091 $ US | #7 |
| 1982 | 78 148 994 801 $ US | #7 |
| 1981 | 81 551 200 212 $ US | #7 |
| 1980 | 95 852 206 828 $ US | #7 |
| 1979 | 83 387 729 320 $ US | #7 |
| 1978 | 65 956 646 975 $ US | #6 |
| 1977 | 55 216 125 528 $ US | #6 |
| 1976 | 47 989 441 574 $ US | #6 |
| 1975 | 42 810 922 795 $ US | #6 |
| 1974 | 39 595 393 885 $ US | #7 |
| 1973 | 29 099 110 043 $ US | #7 |
| 1972 | 21 388 128 261 $ US | #8 |
| 1971 | 18 597 748 747 $ US | #7 |
| 1970 | 16 429 307 847 $ US | #8 |
| 1969 | 13 496 027 480 $ US | - |
En 2025, les importations de biens et services des Pays-Bas s'élevaient à 926 milliards de dollars, contre 13,5 milliards de dollars en 1969. Elles se classaient au 8e rang mondial, un rang qu'elles occupent depuis 2024. Leur meilleur rang a été le 6e, occupé pour la dernière fois en 1978.
En 2025, les importations de biens et services des Pays-Bas étaient les 4es plus élevées de 41 pays situés en Europe. En 2025, les exportations des Pays-Bas dépassaient leurs importations de 150 milliards de dollars, soit un excédent commercial. Le commerce des Pays-Bas, exportations et importations réunies, équivalait à 150,1 % de leur PIB en 2025, au 20e rang mondial.
Importations de biens des Pays-Bas par catégorie, 2025
Importations de biens, 2025: 658 Md $US
En 2025, la première catégorie des importations de biens des Pays-Bas était « machines, électronique et véhicules », avec 36,4 %, suivie de « pétrole, gaz, minerais et autres matières premières », avec 18,8 %.
Origines des importations de biens des Pays-Bas : les 10 premières, 2025
| Rang | Pays | Importations de biens | Part | |
|---|---|---|---|---|
| 1 |
 Allemagne |
111 Md $US | 16,9 % | vs Allemagne |
| 2 |
 États-Unis |
64,7 Md $US | 9,84 % | vs USA |
| 3 |
 Belgique |
62,8 Md $US | 9,55 % | vs Belgique |
| 4 |
 Chine |
54,8 Md $US | 8,33 % | |
| 5 |
 Royaume-Uni |
28,2 Md $US | 4,29 % | vs R.-U. |
| 6 |
 France |
23,9 Md $US | 3,63 % | vs France |
| 7 |
 Italie |
16,8 Md $US | 2,56 % | vs Italie |
| 8 |
 Pologne |
15,7 Md $US | 2,39 % | vs Pologne |
| 9 |
 Norvège |
15,5 Md $US | 2,36 % | vs Norvège |
| 10 |
 Irlande |
14,7 Md $US | 2,23 % | vs Irlande |
| Autres partenaires et non précisés | 249 Md $US | 37,9 % |
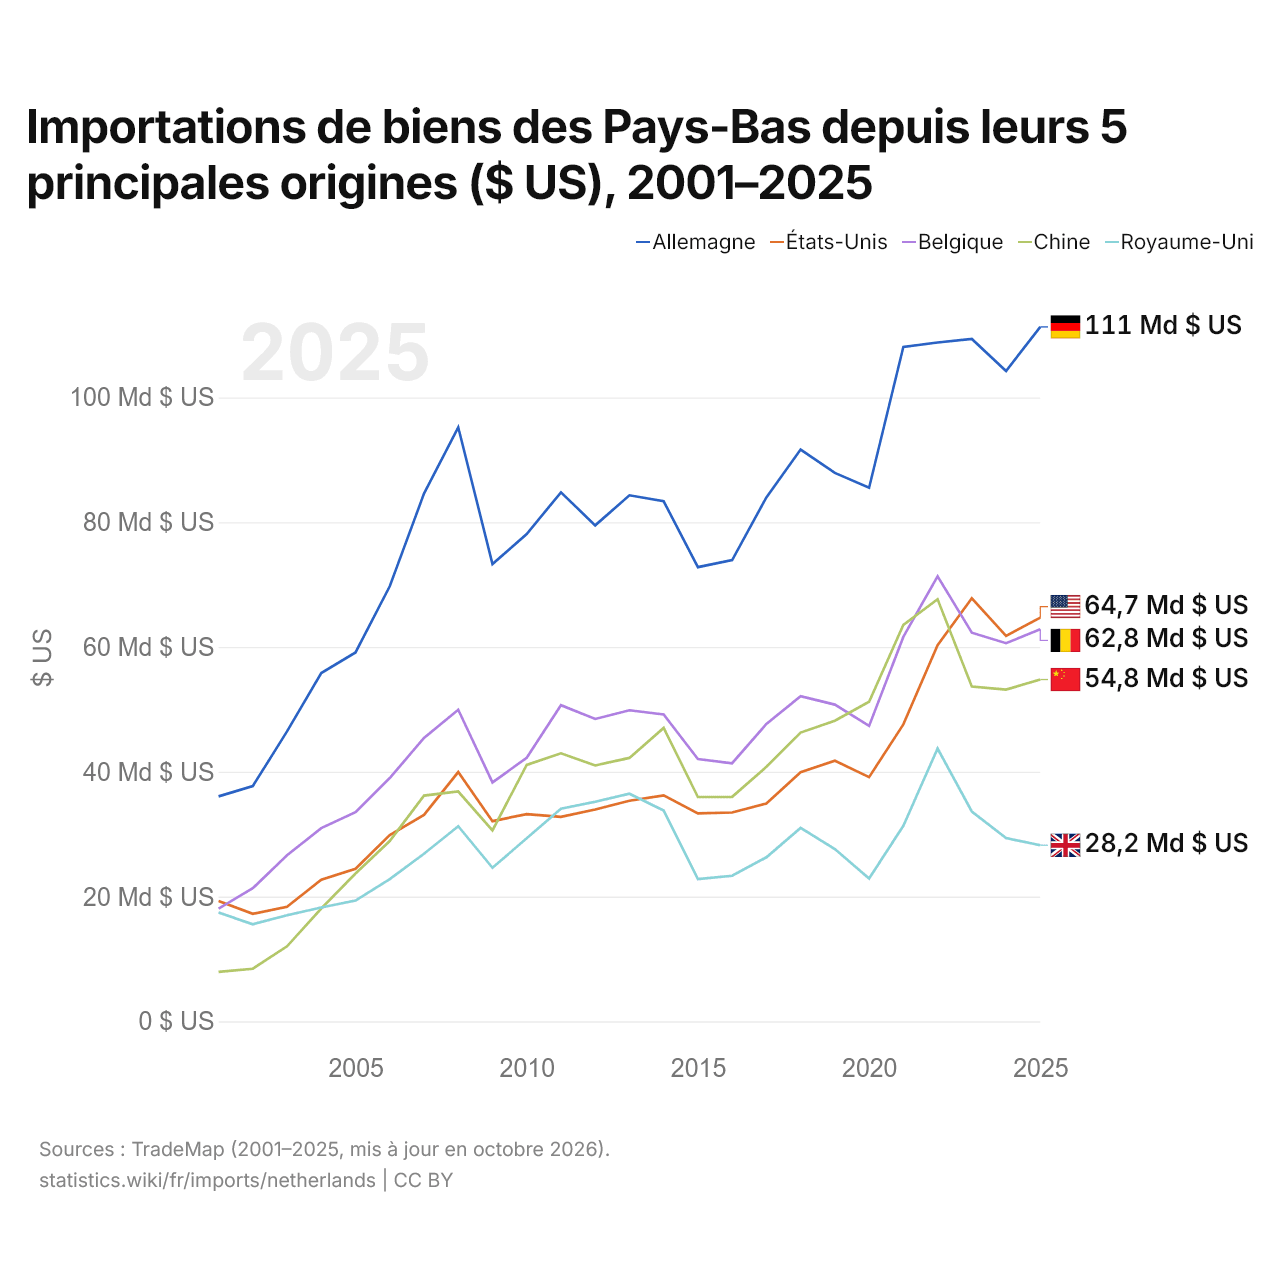
Importations de biens des Pays-Bas depuis leurs 5 principales origines ($ US), 2001–2025
| Année | $ US | ||||
|---|---|---|---|---|---|
| Allemagne | États-Unis | Belgique | Chine | Royaume-Uni | |
| 2025 | 111 299 201 000 $ US | 64 700 696 000 $ US | 62 830 142 000 $ US | 54 777 234 000 $ US | 28 222 720 000 $ US |
| 2024 | 104 226 913 000 $ US | 61 783 172 000 $ US | 60 608 778 000 $ US | 53 168 977 000 $ US | 29 376 061 000 $ US |
| 2023 | 109 374 718 000 $ US | 67 801 910 000 $ US | 62 288 482 000 $ US | 53 664 835 000 $ US | 33 630 691 000 $ US |
| 2022 | 108 803 233 000 $ US | 60 275 697 000 $ US | 71 324 828 000 $ US | 67 656 334 000 $ US | 43 727 837 000 $ US |
| 2021 | 108 104 451 000 $ US | 47 590 027 000 $ US | 61 614 519 000 $ US | 63 542 649 000 $ US | 31 334 754 000 $ US |
| 2020 | 85 522 486 000 $ US | 39 138 999 000 $ US | 47 351 862 000 $ US | 51 227 906 000 $ US | 22 881 676 000 $ US |
| 2019 | 87 905 140 000 $ US | 41 772 668 000 $ US | 50 763 591 000 $ US | 48 168 518 000 $ US | 27 619 951 000 $ US |
| 2018 | 91 643 743 000 $ US | 39 914 922 000 $ US | 52 121 701 000 $ US | 46 276 605 000 $ US | 31 002 313 000 $ US |
| 2017 | 83 979 474 000 $ US | 34 911 653 000 $ US | 47 667 026 000 $ US | 40 790 609 000 $ US | 26 294 232 000 $ US |
| 2016 | 73 922 456 000 $ US | 33 469 115 000 $ US | 41 363 797 000 $ US | 35 979 810 000 $ US | 23 331 701 000 $ US |
| 2015 | 72 793 101 000 $ US | 33 340 107 000 $ US | 42 030 168 000 $ US | 35 955 086 000 $ US | 22 798 691 000 $ US |
| 2014 | 83 355 370 000 $ US | 36 222 282 000 $ US | 49 195 805 000 $ US | 47 037 454 000 $ US | 33 772 707 000 $ US |
| 2013 | 84 312 089 000 $ US | 35 349 568 000 $ US | 49 861 052 000 $ US | 42 219 299 000 $ US | 36 482 083 000 $ US |
| 2012 | 79 488 933 000 $ US | 33 945 250 000 $ US | 48 464 715 000 $ US | 41 012 724 000 $ US | 35 204 284 000 $ US |
| 2011 | 84 792 350 000 $ US | 32 781 603 000 $ US | 50 673 205 000 $ US | 42 957 013 000 $ US | 34 091 317 000 $ US |
| 2010 | 78 104 314 000 $ US | 33 216 013 000 $ US | 42 243 161 000 $ US | 41 097 214 000 $ US | 29 336 731 000 $ US |
| 2009 | 73 281 544 000 $ US | 32 081 657 000 $ US | 38 290 263 000 $ US | 30 604 219 000 $ US | 24 616 209 000 $ US |
| 2008 | 95 216 954 000 $ US | 39 955 896 000 $ US | 49 942 596 000 $ US | 36 833 043 000 $ US | 31 272 701 000 $ US |
| 2007 | 84 579 786 000 $ US | 33 091 649 000 $ US | 45 416 309 000 $ US | 36 183 256 000 $ US | 26 854 414 000 $ US |
| 2006 | 69 729 452 000 $ US | 29 846 023 000 $ US | 38 989 924 000 $ US | 28 903 826 000 $ US | 22 783 610 000 $ US |
| 2005 | 59 126 326 000 $ US | 24 457 595 000 $ US | 33 516 381 000 $ US | 23 690 323 000 $ US | 19 357 499 000 $ US |
| 2004 | 55 828 065 000 $ US | 22 684 249 000 $ US | 30 964 583 000 $ US | 18 082 779 000 $ US | 18 247 998 000 $ US |
| 2003 | 46 470 126 000 $ US | 18 374 242 000 $ US | 26 619 039 000 $ US | 12 025 550 000 $ US | 16 999 878 000 $ US |
| 2002 | 37 702 364 000 $ US | 17 232 738 000 $ US | 21 334 878 000 $ US | 8 432 367 000 $ US | 15 558 466 000 $ US |
| 2001 | 36 055 699 000 $ US | 19 280 364 000 $ US | 18 073 146 000 $ US | 7 922 493 000 $ US | 17 429 012 000 $ US |
En 2025, les importations de biens s'élevaient à 111 milliards de dollars en provenance de l'Allemagne, 64,7 milliards de dollars en provenance des États-Unis, 62,8 milliards de dollars en provenance de la Belgique, 54,8 milliards de dollars en provenance de la Chine et 28,2 milliards de dollars en provenance du Royaume-Uni. Le premier rang des cinq fournisseurs des Pays-Bas est occupé par l'Allemagne chaque année depuis 2001. Le changement le plus récent dans leur ordre remonte à 2023, quand les importations des Pays-Bas en provenance des États-Unis ont dépassé celles en provenance de la Belgique.
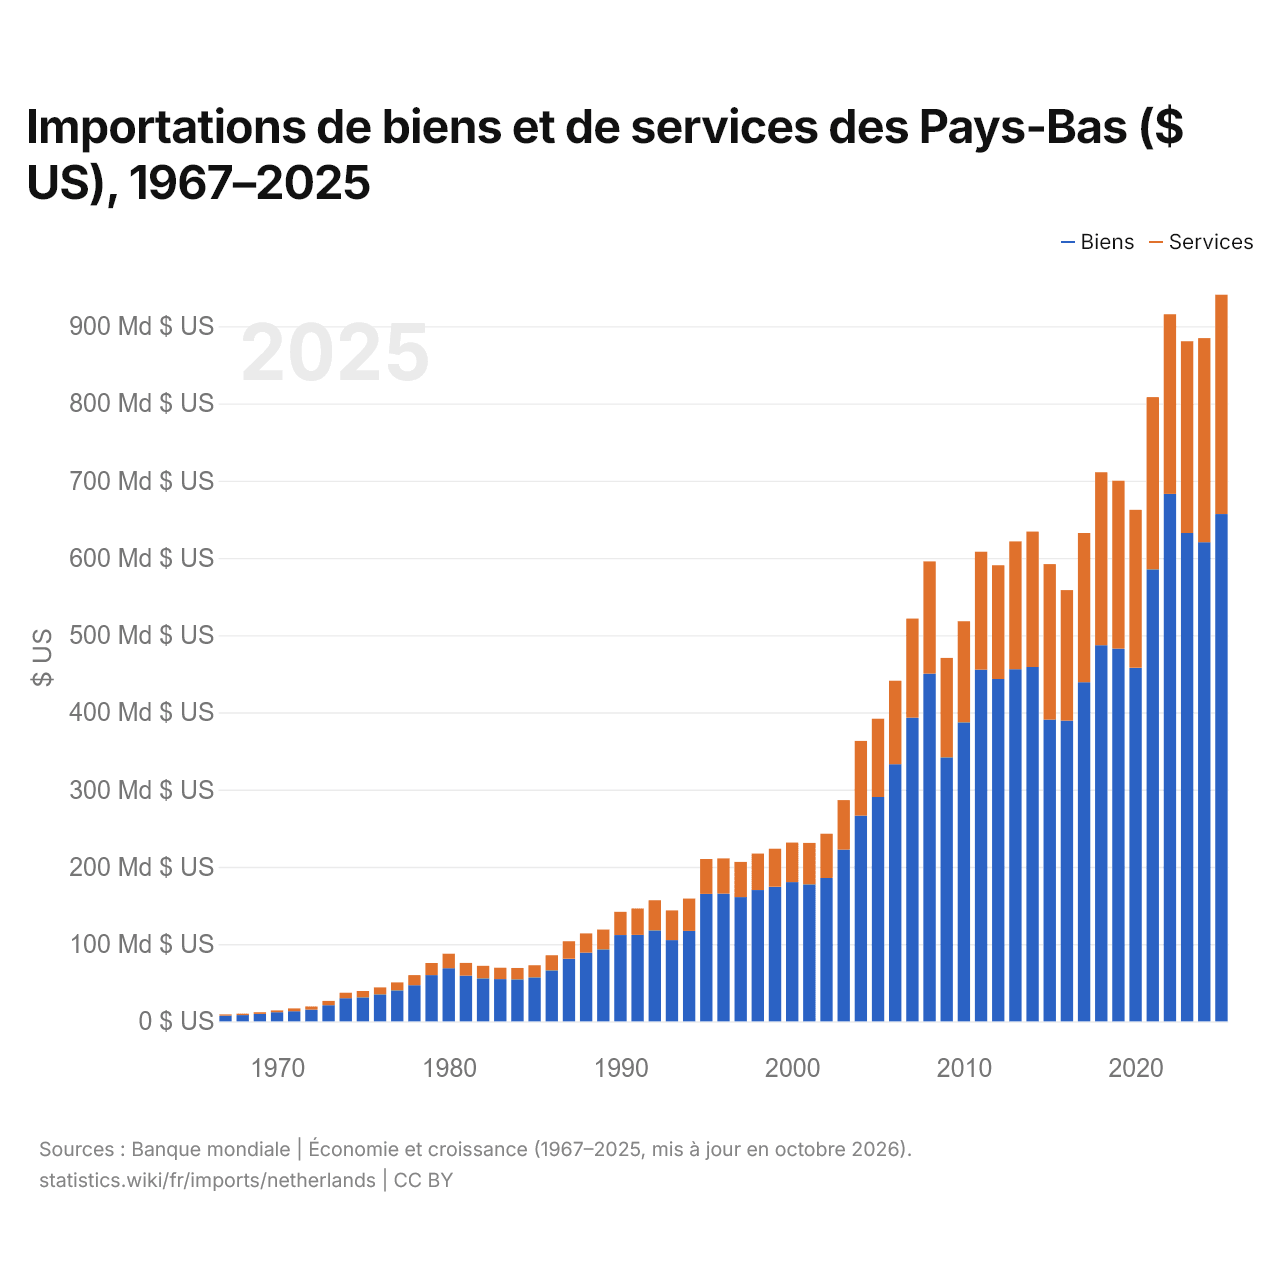
Importations de biens et de services des Pays-Bas ($ US), 1967–2025
| Année | $ US | |
|---|---|---|
| Biens | Services | |
| 2025 | 656 756 236 318 $ US | 284 015 785 919 $ US |
| 2024 | 620 278 001 243 $ US | 264 212 357 702 $ US |
| 2023 | 632 275 406 575 $ US | 248 246 806 871 $ US |
| 2022 | 682 822 120 840 $ US | 232 559 251 123 $ US |
| 2021 | 585 078 937 639 $ US | 223 032 455 109 $ US |
| 2020 | 457 693 305 988 $ US | 204 514 244 563 $ US |
| 2019 | 482 601 828 968 $ US | 217 335 472 737 $ US |
| 2018 | 487 008 981 542 $ US | 223 944 998 386 $ US |
| 2017 | 438 964 849 510 $ US | 193 266 943 398 $ US |
| 2016 | 389 384 215 378 $ US | 168 849 490 473 $ US |
| 2015 | 390 732 919 187 $ US | 201 154 672 002 $ US |
| 2014 | 458 757 159 049 $ US | 175 262 345 209 $ US |
| 2013 | 455 812 530 863 $ US | 165 590 355 022 $ US |
| 2012 | 443 270 214 352 $ US | 147 174 162 901 $ US |
| 2011 | 455 274 914 807 $ US | 152 683 202 042 $ US |
| 2010 | 387 017 525 933 $ US | 130 981 441 249 $ US |
| 2009 | 341 809 612 292 $ US | 128 723 491 555 $ US |
| 2008 | 450 144 071 240 $ US | 145 326 413 170 $ US |
| 2007 | 393 076 433 770 $ US | 128 337 396 140 $ US |
| 2006 | 332 963 981 127 $ US | 107 984 575 969 $ US |
| 2005 | 290 446 010 940 $ US | 101 312 719 673 $ US |
| 2004 | 266 287 905 188 $ US | 96 817 202 860 $ US |
| 2003 | 222 364 056 404 $ US | 64 039 070 254 $ US |
| 2002 | 185 632 992 578 $ US | 57 192 536 157 $ US |
| 2001 | 177 390 376 803 $ US | 53 598 461 196 $ US |
| 2000 | 180 240 689 274 $ US | 51 113 707 103 $ US |
| 1999 | 174 181 525 824 $ US | 49 266 644 765 $ US |
| 1998 | 169 961 372 901 $ US | 47 208 285 589 $ US |
| 1997 | 160 843 813 470 $ US | 45 597 208 822 $ US |
| 1996 | 165 295 076 077 $ US | 45 624 568 745 $ US |
| 1995 | 165 064 342 187 $ US | 45 095 600 536 $ US |
| 1994 | 117 134 266 283 $ US | 41 887 005 838 $ US |
| 1993 | 105 153 550 178 $ US | 38 463 422 416 $ US |
| 1992 | 117 857 318 931 $ US | 38 854 403 654 $ US |
| 1991 | 111 884 863 916 $ US | 34 222 291 473 $ US |
| 1990 | 111 740 766 321 $ US | 30 075 003 103 $ US |
| 1989 | 93 162 460 460 $ US | 25 713 182 120 $ US |
| 1988 | 88 965 615 624 $ US | 24 817 808 997 $ US |
| 1987 | 80 991 176 220 $ US | 22 616 233 937 $ US |
| 1986 | 66 051 386 866 $ US | 19 535 778 775 $ US |
| 1985 | 56 892 690 404 $ US | 15 705 318 544 $ US |
| 1984 | 54 335 321 008 $ US | 14 749 725 779 $ US |
| 1983 | 54 643 161 488 $ US | 14 724 839 000 $ US |
| 1982 | 55 653 114 917 $ US | 16 164 950 597 $ US |
| 1981 | 59 074 198 661 $ US | 16 591 562 832 $ US |
| 1980 | 68 764 035 250 $ US | 18 843 121 477 $ US |
| 1979 | 59 901 906 990 $ US | 15 643 851 302 $ US |
| 1978 | 46 816 600 057 $ US | 12 954 472 118 $ US |
| 1977 | 40 013 266 848 $ US | 10 445 305 072 $ US |
| 1976 | 34 914 859 878 $ US | 9 010 737 924 $ US |
| 1975 | 31 060 671 863 $ US | 8 215 798 608 $ US |
| 1974 | 29 871 432 086 $ US | 7 179 764 333 $ US |
| 1973 | 20 916 957 439 $ US | 5 513 150 205 $ US |
| 1972 | 15 105 505 040 $ US | 4 111 473 157 $ US |
| 1971 | 13 064 854 479 $ US | 3 755 956 906 $ US |
| 1970 | 11 744 475 130 $ US | 2 459 392 263 $ US |
| 1969 | 9 622 099 441 $ US | 2 137 845 302 $ US |
| 1968 | 8 068 508 281 $ US | 1 880 110 496 $ US |
| 1967 | 7 388 950 271 $ US | 1 629 005 524 $ US |
En 2025, les importations de biens des Pays-Bas s'élevaient à 657 milliards de dollars et celles de services à 284 milliards de dollars ; les services représentaient 30,2 % du total, contre 18,1 % en 1967.
Les Pays-Bas dans le classement mondial des importations, 2025
| Rang | Pays | Importations | Part mondiale | |
|---|---|---|---|---|
| 5 |
France
|
1,14 Bn $US | 3,37 % | vs France |
| 6 |
 Japon |
998 Md $US | 2,96 % | vs Japon |
| 7 |
 Inde |
950 Md $US | 2,82 % | |
| 8 |
 Pays-Bas |
926 Md $US | 2,74 % | |
| 9 |
 Singapour |
860 Md $US | 2,55 % | |
| 10 |
Italie
|
773 Md $US | 2,29 % | vs Italie |
| 11 |
 Corée du Sud |
760 Md $US | 2,25 % | vs Corée du Sud |
Importations de biens et services des Pays-Bas, % du PIB, 1969–2025
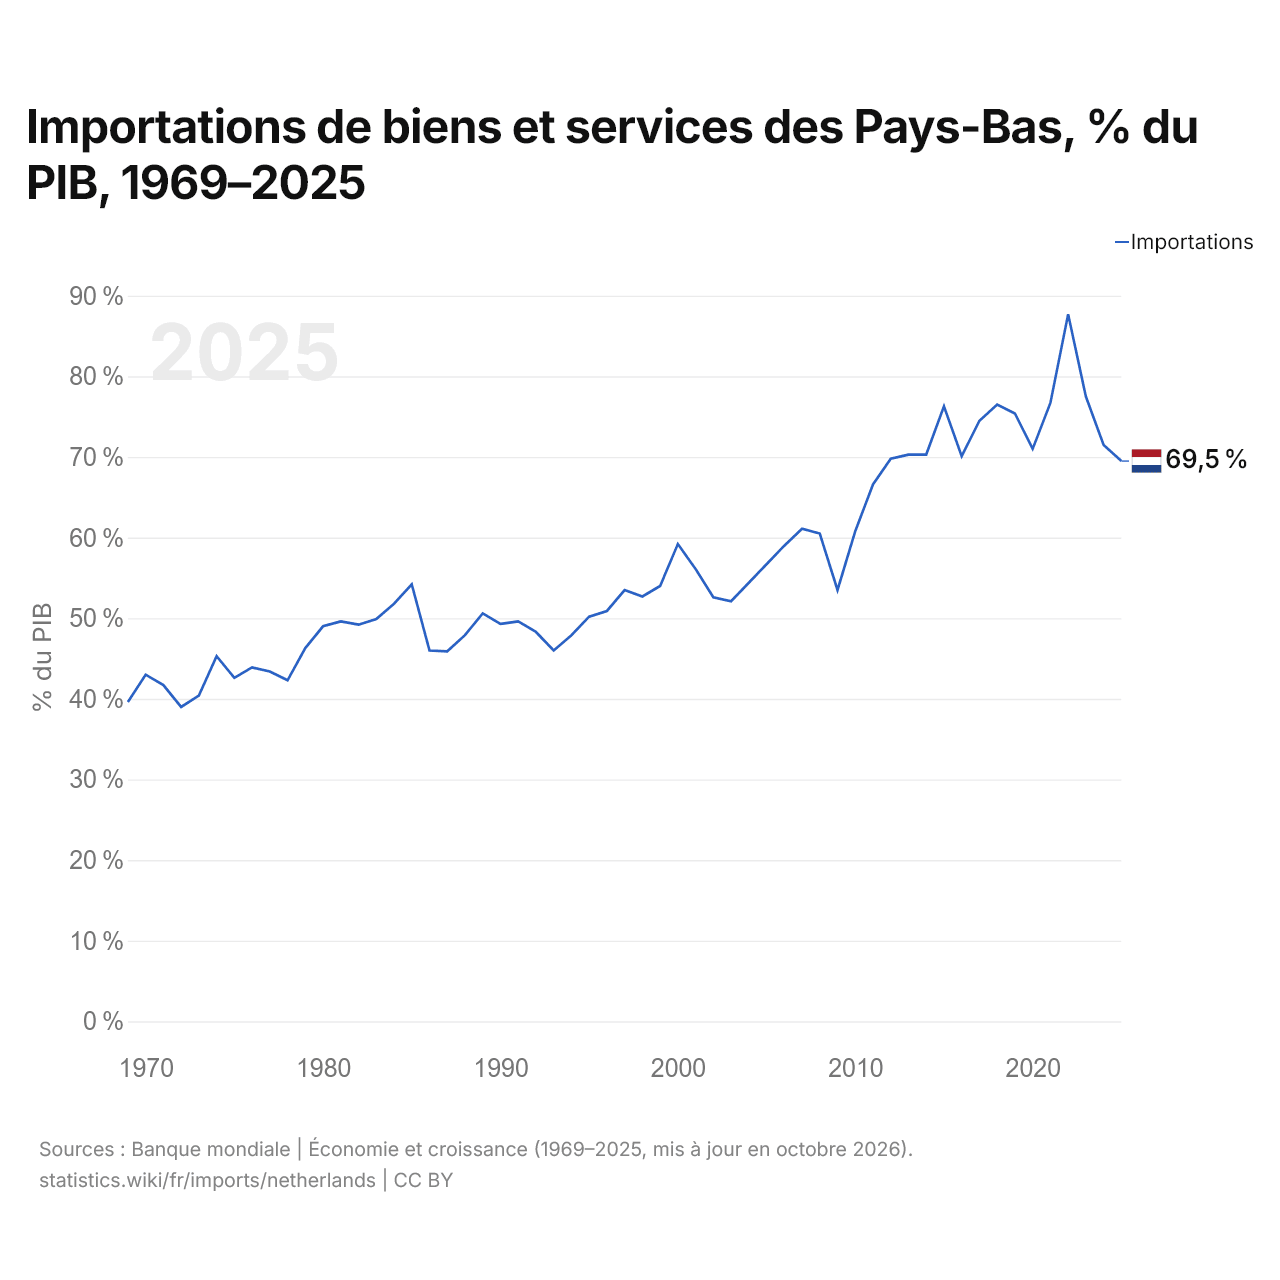
En 2025, les importations de biens et services des Pays-Bas équivalaient à 69,5 % de leur PIB, contre 39,6 % en 1969. La part la plus élevée a été de 87,7 %, en 2022.
Comparer les importations des Pays-Bas avec celles d'autres pays
Sources :
- TradeMap (2001–2025, mis à jour en octobre 2026)
- Banque mondiale | Économie et croissance (1967–2025, mis à jour en octobre 2026)
Creative Commons Attribution (CC BY) : vous pouvez copier, partager, adapter et réutiliser ce contenu, y compris à des fins commerciales, à condition de citer statistics.wiki et d’indiquer les modifications apportées. Les sources citées ci-dessus peuvent avoir leurs propres conditions de licence.