
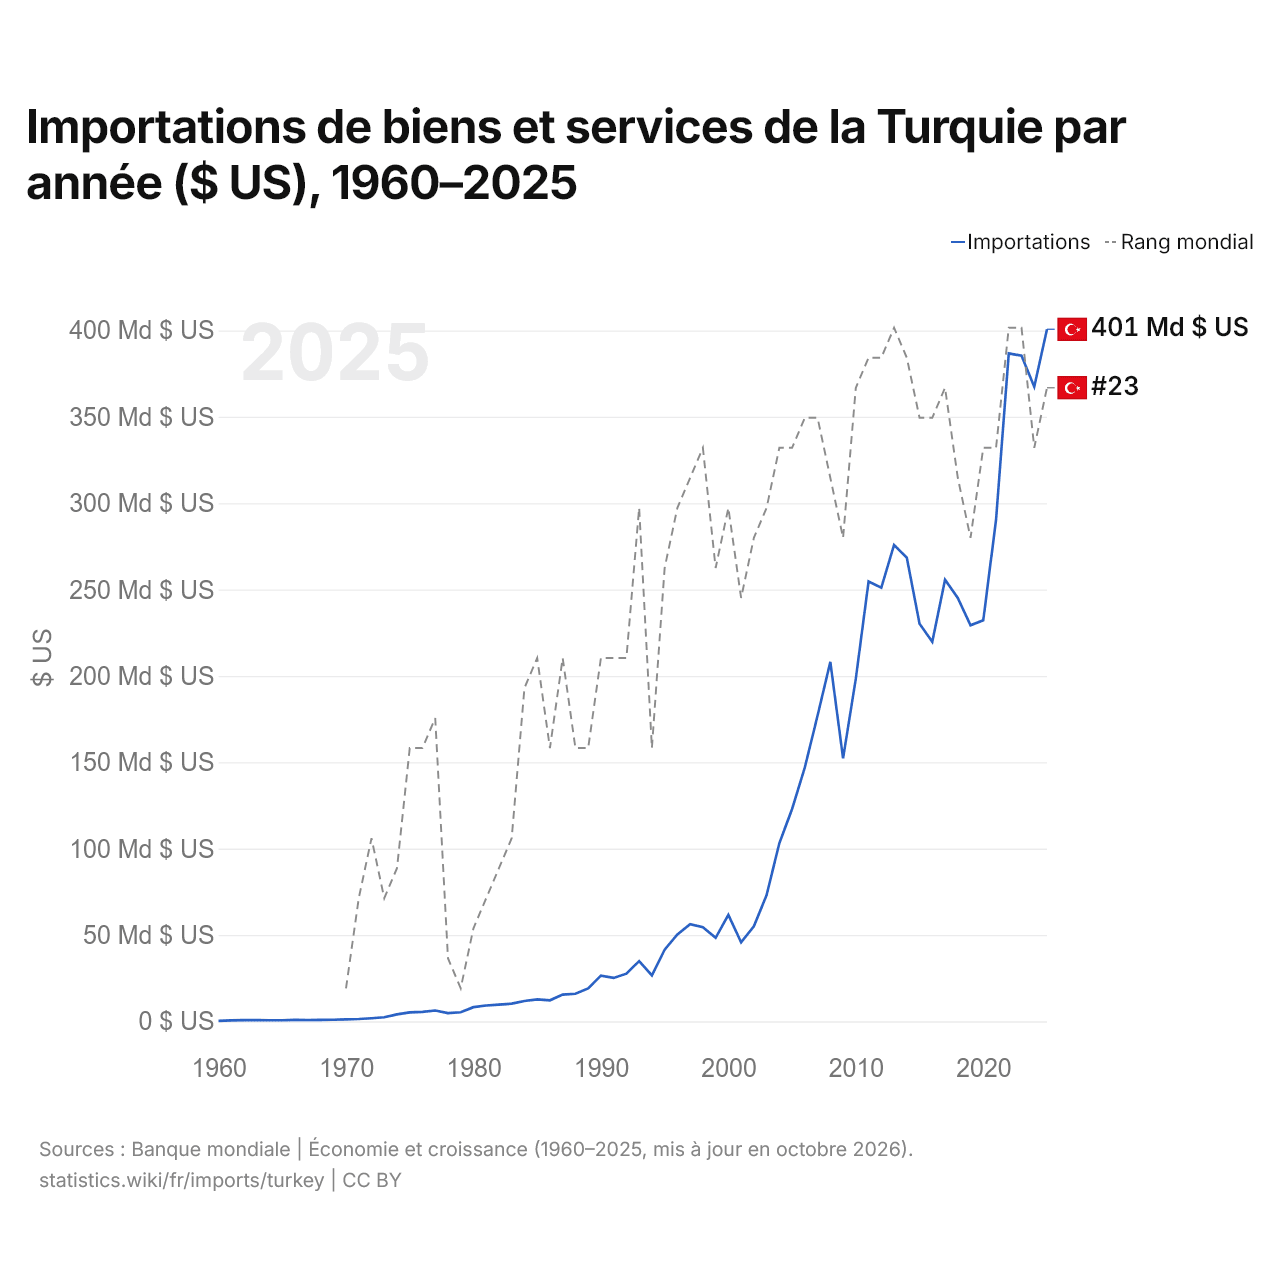
Importations de biens et services de la Turquie par année ($ US), 1960–2025
| Année | $ US | Rang mondial |
|---|---|---|
| Importations | Rang mondial | |
| 2025 | 400 679 511 057 $ US | #23 |
| 2024 | 367 379 077 169 $ US | #25 |
| 2023 | 385 393 330 659 $ US | #21 |
| 2022 | 386 711 092 837 $ US | #21 |
| 2021 | 290 243 026 943 $ US | #25 |
| 2020 | 232 192 230 751 $ US | #25 |
| 2019 | 229 253 569 686 $ US | #28 |
| 2018 | 245 157 569 263 $ US | #26 |
| 2017 | 255 673 681 716 $ US | #23 |
| 2016 | 219 776 888 914 $ US | #24 |
| 2015 | 230 161 663 399 $ US | #24 |
| 2014 | 268 468 454 798 $ US | #22 |
| 2013 | 275 806 251 707 $ US | #21 |
| 2012 | 251 096 117 263 $ US | #22 |
| 2011 | 254 618 813 879 $ US | #22 |
| 2010 | 198 401 861 132 $ US | #23 |
| 2009 | 152 234 991 548 $ US | #28 |
| 2008 | 208 120 647 288 $ US | #26 |
| 2007 | 177 062 270 987 $ US | #24 |
| 2006 | 147 024 766 163 $ US | #24 |
| 2005 | 122 961 373 358 $ US | #25 |
| 2004 | 103 109 391 408 $ US | #25 |
| 2003 | 73 087 556 675 $ US | #27 |
| 2002 | 54 987 639 146 $ US | #28 |
| 2001 | 45 792 581 438 $ US | #30 |
| 2000 | 61 657 012 663 $ US | #27 |
| 1999 | 48 346 453 175 $ US | #29 |
| 1998 | 54 441 094 414 $ US | #25 |
| 1997 | 56 251 261 318 $ US | #26 |
| 1996 | 50 297 738 468 $ US | #27 |
| 1995 | 41 468 208 092 $ US | #29 |
| 1994 | 26 631 422 878 $ US | #35 |
| 1993 | 34 898 334 092 $ US | #27 |
| 1992 | 27 596 929 569 $ US | #32 |
| 1991 | 25 124 448 706 $ US | #32 |
| 1990 | 26 482 062 093 $ US | #32 |
| 1989 | 19 048 020 735 $ US | #35 |
| 1988 | 15 951 195 499 $ US | #35 |
| 1987 | 15 482 730 455 $ US | #32 |
| 1986 | 12 184 888 889 $ US | #35 |
| 1985 | 12 751 532 567 $ US | #32 |
| 1984 | 11 791 825 613 $ US | #33 |
| 1983 | 10 233 333 333 $ US | #38 |
| 1982 | 9 666 257 669 $ US | #39 |
| 1981 | 9 185 585 586 $ US | #40 |
| 1980 | 8 209 210 526 $ US | #41 |
| 1979 | 5 270 967 742 $ US | #43 |
| 1978 | 4 804 166 667 $ US | #42 |
| 1977 | 6 283 333 333 $ US | #34 |
| 1976 | 5 487 500 000 $ US | #35 |
| 1975 | 5 171 428 571 $ US | #35 |
| 1974 | 3 992 857 143 $ US | #39 |
| 1973 | 2 364 285 714 $ US | #40 |
| 1972 | 1 764 285 714 $ US | #38 |
| 1971 | 1 333 333 333 $ US | #40 |
| 1970 | 1 136 363 636 $ US | #43 |
| 1969 | 922 222 222 $ US | - |
| 1968 | 888 888 889 $ US | - |
| 1967 | 777 777 778 $ US | - |
| 1966 | 800 000 000 $ US | - |
| 1965 | 644 444 444 $ US | - |
| 1964 | 611 111 111 $ US | - |
| 1963 | 722 222 222 $ US | - |
| 1962 | 711 111 111 $ US | - |
| 1961 | 544 444 444 $ US | - |
| 1960 | 277 777 778 $ US | - |
En 2025, les importations de biens et services de la Turquie s'élevaient à 401 milliards de dollars, contre 278 millions de dollars en 1960. Elles se classaient au 23e rang mondial, en hausse par rapport au 25e rang en 2024. Leur meilleur rang a été le 21e, occupé pour la dernière fois en 2023.
En 2025, les importations de biens et services de la Turquie étaient les 9es plus élevées de 44 pays situés en Asie. En 2025, les importations de la Turquie dépassaient ses exportations de 3,76 milliards de dollars, soit un déficit commercial. Le commerce de la Turquie, exportations et importations réunies, équivalait à 49,9 % de son PIB en 2025, au 135e rang mondial.
Importations de biens de la Turquie par catégorie, 2025
Importations de biens, 2025: 365 Md $US
En 2025, la première catégorie des importations de biens de la Turquie était « machines, électronique et véhicules », avec 33,7 %, suivie de « pétrole, gaz, minerais et autres matières premières », avec 20,1 %.
Origines des importations de biens de la Turquie : les 10 premières, 2025
| Rang | Pays | Importations de biens | Part | |
|---|---|---|---|---|
| 1 |
 Chine |
49,6 Md $US | 13,6 % | vs Chine |
| 2 |
 Russie |
42,4 Md $US | 11,6 % | vs Russie |
| 3 |
 Allemagne |
30,1 Md $US | 8,24 % | vs Allemagne |
| 4 |
 États-Unis |
18,1 Md $US | 4,95 % | vs USA |
| 5 |
 Suisse |
15,8 Md $US | 4,31 % | vs Suisse |
| 6 |
 Italie |
15,7 Md $US | 4,31 % | vs Italie |
| 7 |
 France |
12,9 Md $US | 3,52 % | vs France |
| 8 |
 Corée du Sud |
10,3 Md $US | 2,81 % | vs Corée du Sud |
| 9 |
 Espagne |
10,2 Md $US | 2,78 % | vs Espagne |
| 10 |
 EAU |
9,67 Md $US | 2,65 % | |
| Autres partenaires et non précisés | 151 Md $US | 41,3 % |
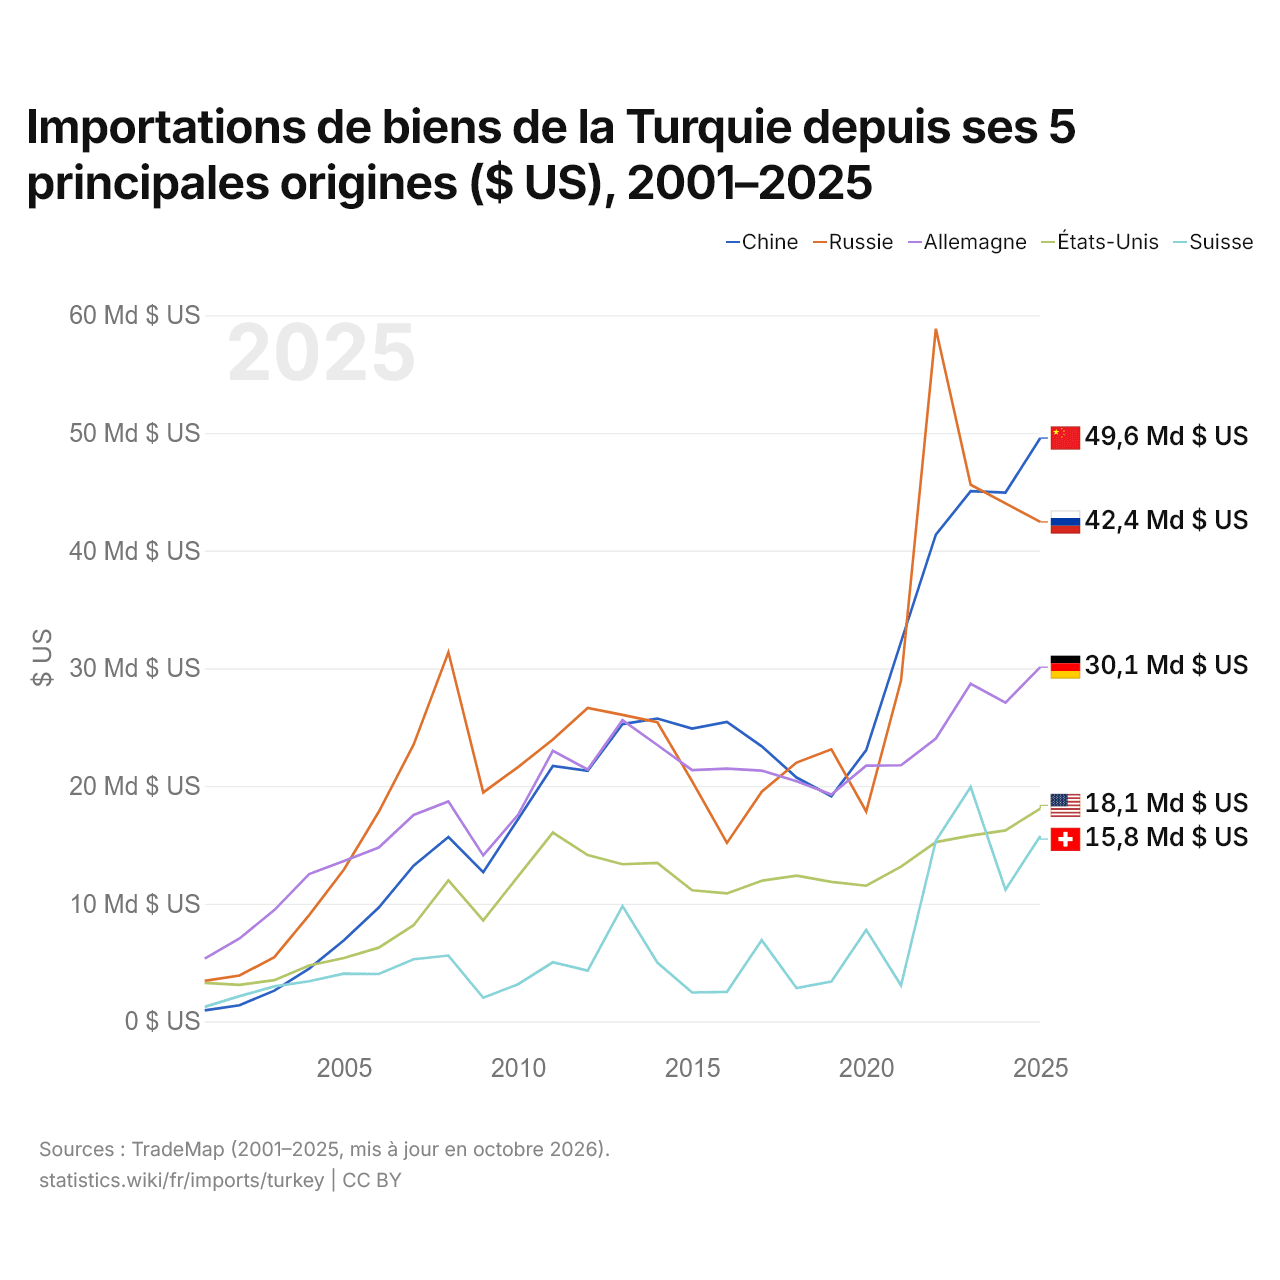
Importations de biens de la Turquie depuis ses 5 principales origines ($ US), 2001–2025
| Année | $ US | ||||
|---|---|---|---|---|---|
| Chine | Russie | Allemagne | États-Unis | Suisse | |
| 2025 | 49 569 142 000 $ US | 42 437 246 000 $ US | 30 100 604 000 $ US | 18 079 636 000 $ US | 15 750 179 000 $ US |
| 2024 | 44 930 563 000 $ US | 44 018 616 000 $ US | 27 084 551 000 $ US | 16 227 487 000 $ US | 11 186 125 000 $ US |
| 2023 | 45 047 968 000 $ US | 45 599 587 000 $ US | 28 687 775 000 $ US | 15 779 725 000 $ US | 19 914 079 000 $ US |
| 2022 | 41 353 932 000 $ US | 58 853 499 000 $ US | 24 032 738 000 $ US | 15 228 578 000 $ US | 15 342 734 000 $ US |
| 2021 | 32 239 211 000 $ US | 28 959 030 000 $ US | 21 757 477 000 $ US | 13 148 129 000 $ US | 3 057 872 000 $ US |
| 2020 | 23 040 812 000 $ US | 17 829 236 000 $ US | 21 732 800 000 $ US | 11 525 182 000 $ US | 7 771 743 000 $ US |
| 2019 | 19 127 972 000 $ US | 23 116 867 000 $ US | 19 279 082 000 $ US | 11 847 481 000 $ US | 3 377 053 000 $ US |
| 2018 | 20 719 061 000 $ US | 21 989 574 000 $ US | 20 407 294 000 $ US | 12 377 681 000 $ US | 2 818 664 000 $ US |
| 2017 | 23 370 620 000 $ US | 19 514 094 000 $ US | 21 301 869 000 $ US | 11 951 744 000 $ US | 6 903 610 000 $ US |
| 2016 | 25 440 454 000 $ US | 15 160 961 000 $ US | 21 473 789 000 $ US | 10 867 491 000 $ US | 2 506 215 000 $ US |
| 2015 | 24 873 457 000 $ US | 20 401 756 000 $ US | 21 351 883 000 $ US | 11 141 465 000 $ US | 2 449 606 000 $ US |
| 2014 | 25 732 865 000 $ US | 25 411 700 000 $ US | 23 482 150 000 $ US | 13 465 362 000 $ US | 4 997 706 000 $ US |
| 2013 | 25 260 751 000 $ US | 26 046 541 000 $ US | 25 598 452 000 $ US | 13 350 844 000 $ US | 9 800 066 000 $ US |
| 2012 | 21 295 242 000 $ US | 26 625 286 000 $ US | 21 400 614 000 $ US | 14 130 625 000 $ US | 4 307 344 000 $ US |
| 2011 | 21 693 336 000 $ US | 23 952 914 000 $ US | 22 985 567 000 $ US | 16 042 073 000 $ US | 5 021 487 000 $ US |
| 2010 | 17 180 806 000 $ US | 21 600 641 000 $ US | 17 549 112 000 $ US | 12 322 789 000 $ US | 3 155 726 000 $ US |
| 2009 | 12 676 573 000 $ US | 19 450 086 000 $ US | 14 096 963 000 $ US | 8 575 892 000 $ US | 2 001 886 000 $ US |
| 2008 | 15 658 210 000 $ US | 31 364 477 000 $ US | 18 687 197 000 $ US | 11 977 015 000 $ US | 5 591 781 000 $ US |
| 2007 | 13 234 092 000 $ US | 23 508 494 000 $ US | 17 539 955 000 $ US | 8 166 788 000 $ US | 5 272 608 000 $ US |
| 2006 | 9 669 100 000 $ US | 17 806 239 000 $ US | 14 765 650 000 $ US | 6 260 881 000 $ US | 4 020 723 000 $ US |
| 2005 | 6 885 164 000 $ US | 12 905 620 000 $ US | 13 631 605 000 $ US | 5 375 593 000 $ US | 4 057 390 000 $ US |
| 2004 | 4 476 076 000 $ US | 9 033 138 000 $ US | 12 513 824 000 $ US | 4 745 221 000 $ US | 3 406 966 000 $ US |
| 2003 | 2 610 298 000 $ US | 5 451 315 000 $ US | 9 451 840 000 $ US | 3 496 592 000 $ US | 2 970 129 000 $ US |
| 2002 | 1 368 314 000 $ US | 3 891 721 000 $ US | 7 039 905 000 $ US | 3 099 466 000 $ US | 2 142 789 000 $ US |
| 2001 | 925 620 000 $ US | 3 435 673 000 $ US | 5 335 443 000 $ US | 3 261 380 000 $ US | 1 227 422 000 $ US |
En 2025, les importations de biens s'élevaient à 49,6 milliards de dollars en provenance de la Chine, 42,4 milliards de dollars en provenance de la Russie, 30,1 milliards de dollars en provenance de l'Allemagne, 18,1 milliards de dollars en provenance des États-Unis et 15,8 milliards de dollars en provenance de la Suisse. Le premier rang des cinq fournisseurs de la Turquie est occupé par la Chine depuis 2024.
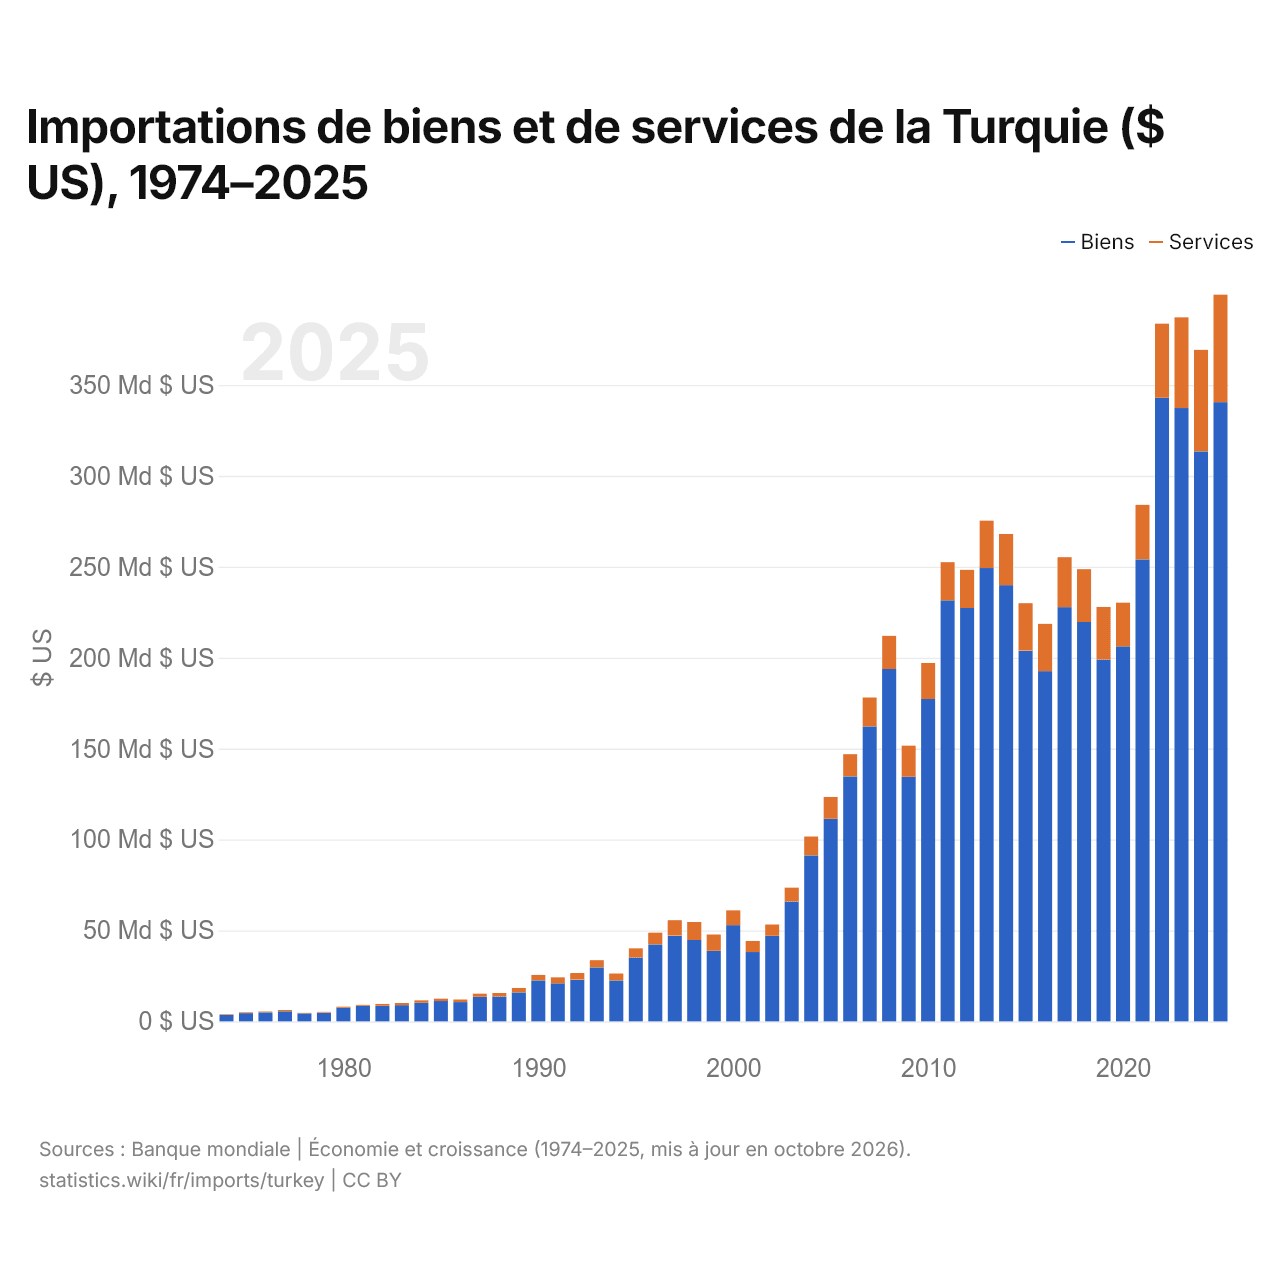
Importations de biens et de services de la Turquie ($ US), 1974–2025
| Année | $ US | |
|---|---|---|
| Biens | Services | |
| 2025 | 340 531 000 000 $ US | 59 101 000 000 $ US |
| 2024 | 313 440 000 000 $ US | 55 820 000 000 $ US |
| 2023 | 337 273 000 000 $ US | 49 860 000 000 $ US |
| 2022 | 342 937 000 000 $ US | 40 762 000 000 $ US |
| 2021 | 253 992 000 000 $ US | 30 025 000 000 $ US |
| 2020 | 206 254 000 000 $ US | 23 959 000 000 $ US |
| 2019 | 198 982 000 000 $ US | 28 898 000 000 $ US |
| 2018 | 219 636 000 000 $ US | 29 054 000 000 $ US |
| 2017 | 227 789 000 000 $ US | 27 487 000 000 $ US |
| 2016 | 192 568 000 000 $ US | 26 002 000 000 $ US |
| 2015 | 203 872 000 000 $ US | 26 081 000 000 $ US |
| 2014 | 239 866 000 000 $ US | 28 164 000 000 $ US |
| 2013 | 249 282 000 000 $ US | 26 082 000 000 $ US |
| 2012 | 227 315 000 000 $ US | 20 982 000 000 $ US |
| 2011 | 231 552 000 000 $ US | 20 967 000 000 $ US |
| 2010 | 177 317 000 000 $ US | 19 704 000 000 $ US |
| 2009 | 134 494 000 000 $ US | 17 090 000 000 $ US |
| 2008 | 193 823 000 000 $ US | 18 204 000 000 $ US |
| 2007 | 162 210 000 000 $ US | 15 914 000 000 $ US |
| 2006 | 134 672 000 000 $ US | 12 189 000 000 $ US |
| 2005 | 111 445 000 000 $ US | 11 950 000 000 $ US |
| 2004 | 91 271 000 000 $ US | 10 353 000 000 $ US |
| 2003 | 65 883 000 000 $ US | 7 636 000 000 $ US |
| 2002 | 47 109 000 000 $ US | 6 146 000 000 $ US |
| 2001 | 38 092 000 000 $ US | 6 098 000 000 $ US |
| 2000 | 52 882 000 000 $ US | 8 153 000 000 $ US |
| 1999 | 38 802 000 000 $ US | 8 949 000 000 $ US |
| 1998 | 44 779 000 000 $ US | 9 858 000 000 $ US |
| 1997 | 47 158 000 000 $ US | 8 506 000 000 $ US |
| 1996 | 42 331 000 000 $ US | 6 426 000 000 $ US |
| 1995 | 35 089 000 000 $ US | 5 024 000 000 $ US |
| 1994 | 22 524 000 000 $ US | 3 782 000 000 $ US |
| 1993 | 29 655 000 000 $ US | 3 948 000 000 $ US |
| 1992 | 22 942 000 000 $ US | 3 625 000 000 $ US |
| 1991 | 20 947 000 000 $ US | 3 218 000 000 $ US |
| 1990 | 22 453 000 000 $ US | 3 071 000 000 $ US |
| 1989 | 15 891 000 000 $ US | 2 465 000 000 $ US |
| 1988 | 13 636 000 000 $ US | 1 925 000 000 $ US |
| 1987 | 13 484 000 000 $ US | 1 695 000 000 $ US |
| 1986 | 10 580 000 000 $ US | 1 428 000 000 $ US |
| 1985 | 11 162 000 000 $ US | 1 333 000 000 $ US |
| 1984 | 10 237 000 000 $ US | 1 296 000 000 $ US |
| 1983 | 8 895 000 000 $ US | 1 166 000 000 $ US |
| 1982 | 8 518 000 000 $ US | 1 031 000 000 $ US |
| 1981 | 8 567 000 000 $ US | 468 000 000 $ US |
| 1980 | 7 513 000 000 $ US | 569 000 000 $ US |
| 1979 | 4 815 000 000 $ US | 367 000 000 $ US |
| 1978 | 4 369 000 000 $ US | 310 000 000 $ US |
| 1977 | 5 506 000 000 $ US | 687 000 000 $ US |
| 1976 | 4 872 000 000 $ US | 517 000 000 $ US |
| 1975 | 4 502 000 000 $ US | 436 000 000 $ US |
| 1974 | 3 589 000 000 $ US | 366 000 000 $ US |
En 2025, les importations de biens de la Turquie s'élevaient à 341 milliards de dollars et celles de services à 59,1 milliards de dollars ; les services représentaient 14,8 % du total, contre 9,3 % en 1974.
La Turquie dans le classement mondial des importations, 2025
| Rang | Pays | Importations | Part mondiale | |
|---|---|---|---|---|
| 20 |
EAU
|
482 Md $US (2023) | 1,59 % | |
| 21 |
 Vietnam |
474 Md $US | 1,41 % | vs Vietnam |
| 22 |
 Australie |
407 Md $US | 1,21 % | vs Australie |
| 23 |
 Turquie |
401 Md $US | 1,19 % | |
| 24 |
 Brésil |
398 Md $US | 1,18 % | vs Brésil |
| 25 |
Russie
|
397 Md $US | 1,18 % | vs Russie |
| 26 |
 Thaïlande |
388 Md $US | 1,15 % | vs Thaïlande |
Importations de biens et services de la Turquie, % du PIB, 1960–2025
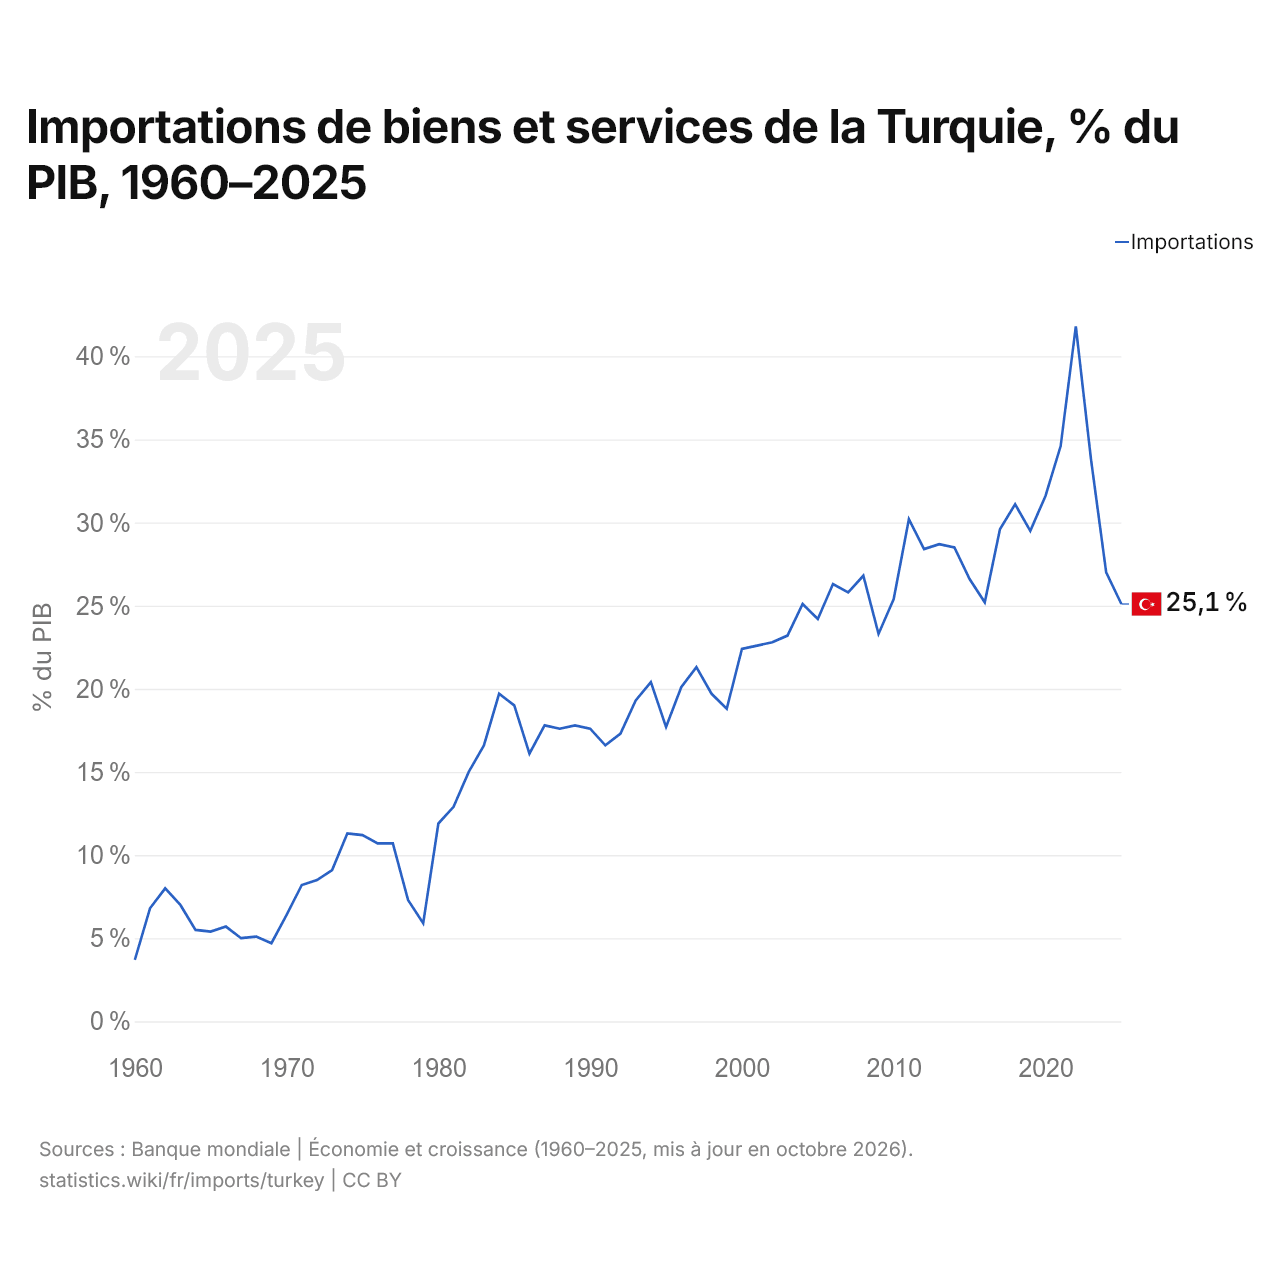
En 2025, les importations de biens et services de la Turquie équivalaient à 25,1 % de son PIB, contre 3,7 % en 1960. La part la plus élevée a été de 41,8 %, en 2022.
Comparer les importations de la Turquie avec celles d'autres pays
Sources :
- TradeMap (2001–2025, mis à jour en octobre 2026)
- Banque mondiale | Économie et croissance (1960–2025, mis à jour en octobre 2026)
Creative Commons Attribution (CC BY) : vous pouvez copier, partager, adapter et réutiliser ce contenu, y compris à des fins commerciales, à condition de citer statistics.wiki et d’indiquer les modifications apportées. Les sources citées ci-dessus peuvent avoir leurs propres conditions de licence.