
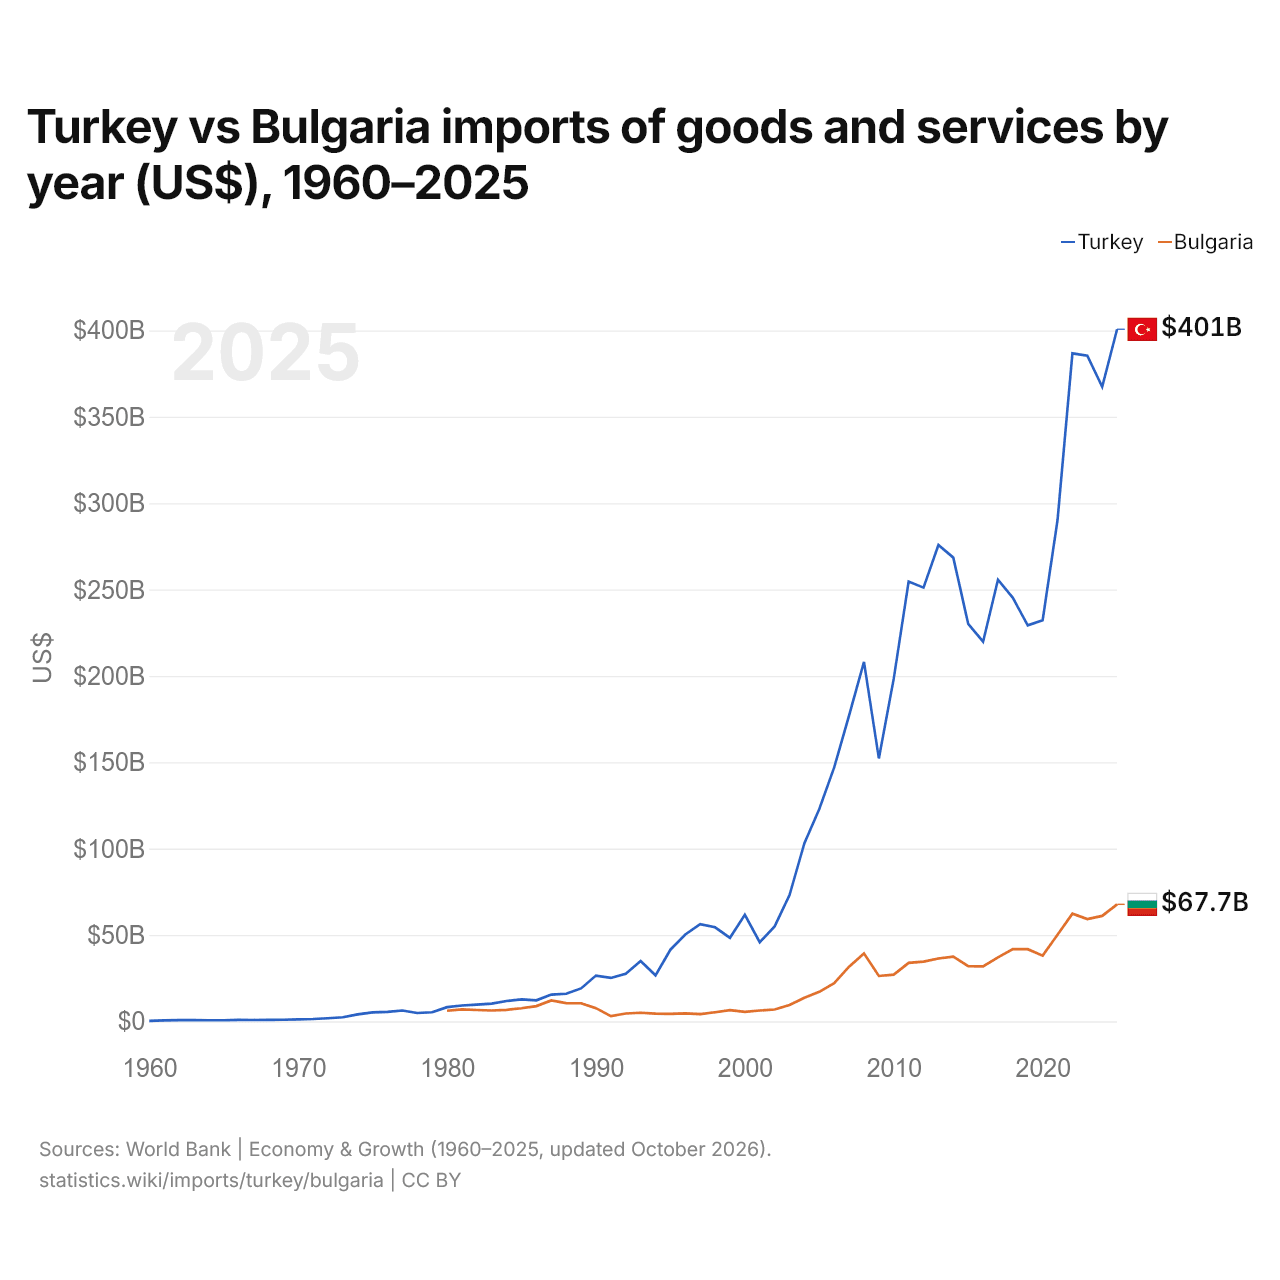
Turquie vs Bulgarie : importations de biens et services par année ($ US), 1960–2025
| Année | $ US | |
|---|---|---|
 Turquie |
 Bulgarie |
|
| 2025 | 400 679 511 057 $ US | 67 710 937 458 $ US |
| 2024 | 367 379 077 169 $ US | 61 045 719 079 $ US |
| 2023 | 385 393 330 659 $ US | 59 170 791 456 $ US |
| 2022 | 386 711 092 837 $ US | 62 330 614 856 $ US |
| 2021 | 290 243 026 943 $ US | 50 091 113 311 $ US |
| 2020 | 232 192 230 751 $ US | 38 028 750 956 $ US |
| 2019 | 229 253 569 686 $ US | 41 764 330 853 $ US |
| 2018 | 245 157 569 263 $ US | 41 807 171 882 $ US |
| 2017 | 255 673 681 716 $ US | 37 066 822 041 $ US |
| 2016 | 219 776 888 914 $ US | 31 790 083 605 $ US |
| 2015 | 230 161 663 399 $ US | 31 958 895 177 $ US |
| 2014 | 268 468 454 798 $ US | 37 502 678 291 $ US |
| 2013 | 275 806 251 707 $ US | 36 353 430 968 $ US |
| 2012 | 251 096 117 263 $ US | 34 548 290 470 $ US |
| 2011 | 254 618 813 879 $ US | 33 820 213 314 $ US |
| 2010 | 198 401 861 132 $ US | 27 009 762 883 $ US |
| 2009 | 152 234 991 548 $ US | 26 259 726 919 $ US |
| 2008 | 208 120 647 288 $ US | 39 343 107 071 $ US |
| 2007 | 177 062 270 987 $ US | 31 626 685 276 $ US |
| 2006 | 147 024 766 163 $ US | 22 028 593 152 $ US |
| 2005 | 122 961 373 358 $ US | 17 081 160 934 $ US |
| 2004 | 103 109 391 408 $ US | 13 630 779 782 $ US |
| 2003 | 73 087 556 675 $ US | 9 430 486 363 $ US |
| 2002 | 54 987 639 146 $ US | 6 827 674 436 $ US |
| 2001 | 45 792 581 438 $ US | 6 269 411 766 $ US |
| 2000 | 61 657 012 663 $ US | 5 500 922 374 $ US |
| 1999 | 48 346 453 175 $ US | 6 454 110 049 $ US |
| 1998 | 54 441 094 414 $ US | 5 276 749 273 $ US |
| 1997 | 56 251 261 318 $ US | 4 174 456 098 $ US |
| 1996 | 50 297 738 468 $ US | 4 589 177 002 $ US |
| 1995 | 41 468 208 092 $ US | 4 353 677 534 $ US |
| 1994 | 26 631 422 878 $ US | 4 434 462 644 $ US |
| 1993 | 34 898 334 092 $ US | 4 964 818 636 $ US |
| 1992 | 27 596 929 569 $ US | 4 554 255 739 $ US |
| 1991 | 25 124 448 706 $ US | 2 990 743 200 $ US |
| 1990 | 26 482 062 093 $ US | 7 612 050 672 $ US |
| 1989 | 19 048 020 735 $ US | 10 472 822 408 $ US |
| 1988 | 15 951 195 499 $ US | 10 557 563 242 $ US |
| 1987 | 15 482 730 455 $ US | 12 117 632 822 $ US |
| 1986 | 12 184 888 889 $ US | 8 808 016 665 $ US |
| 1985 | 12 751 532 567 $ US | 7 587 659 599 $ US |
| 1984 | 11 791 825 613 $ US | 6 659 194 204 $ US |
| 1983 | 10 233 333 333 $ US | 6 264 983 781 $ US |
| 1982 | 9 666 257 669 $ US | 6 578 066 374 $ US |
| 1981 | 9 185 585 586 $ US | 6 924 020 230 $ US |
| 1980 | 8 209 210 526 $ US | 6 150 465 274 $ US |
| 1979 | 5 270 967 742 $ US | - |
| 1978 | 4 804 166 667 $ US | - |
| 1977 | 6 283 333 333 $ US | - |
| 1976 | 5 487 500 000 $ US | - |
| 1975 | 5 171 428 571 $ US | - |
| 1974 | 3 992 857 143 $ US | - |
| 1973 | 2 364 285 714 $ US | - |
| 1972 | 1 764 285 714 $ US | - |
| 1971 | 1 333 333 333 $ US | - |
| 1970 | 1 136 363 636 $ US | - |
| 1969 | 922 222 222 $ US | - |
| 1968 | 888 888 889 $ US | - |
| 1967 | 777 777 778 $ US | - |
| 1966 | 800 000 000 $ US | - |
| 1965 | 644 444 444 $ US | - |
| 1964 | 611 111 111 $ US | - |
| 1963 | 722 222 222 $ US | - |
| 1962 | 711 111 111 $ US | - |
| 1961 | 544 444 444 $ US | - |
| 1960 | 277 777 778 $ US | - |
En 2025, les importations de biens et services de la Turquie s'élevaient à 401 milliards de dollars et celles de la Bulgarie à 67,7 milliards de dollars : celles de la Turquie étaient 5,9 fois plus élevées. En 1980, les importations de la Turquie étaient supérieures de 33 % : 8,21 milliards de dollars pour la Turquie et 6,15 milliards de dollars pour la Bulgarie.
Les importations de biens et services de la Turquie sont supérieures à celles de la Bulgarie chaque année depuis 1980.
Turquie vs Bulgarie : chiffres des importations
|
Turquie
|
Bulgarie
|
|
|---|---|---|
| Importations | 401 Md $US (2025) | 67,7 Md $US (2025) |
| Rang mondial | 23/174 | 58/174 |
| Part mondiale | 1,19 % | 0,2 % |
| % du PIB | 25,1 % | 51,8 % |
| Première catégorie de biens | Machines, électronique et véhicules (33,7 %, 2025) | Machines, électronique et véhicules (31,2 %, 2025) |
| Première origine des biens | Chine (13,6 %, 2025) | Allemagne (11 %, 2025) |
Comparer les importations de 2 pays au choix
Sources :
- Banque mondiale | Économie et croissance (1960–2025, mis à jour en octobre 2026)
- TradeMap (2001–2025, mis à jour en octobre 2026)
Creative Commons Attribution (CC BY) : vous pouvez copier, partager, adapter et réutiliser ce contenu, y compris à des fins commerciales, à condition de citer statistics.wiki et d’indiquer les modifications apportées. Les sources citées ci-dessus peuvent avoir leurs propres conditions de licence.