
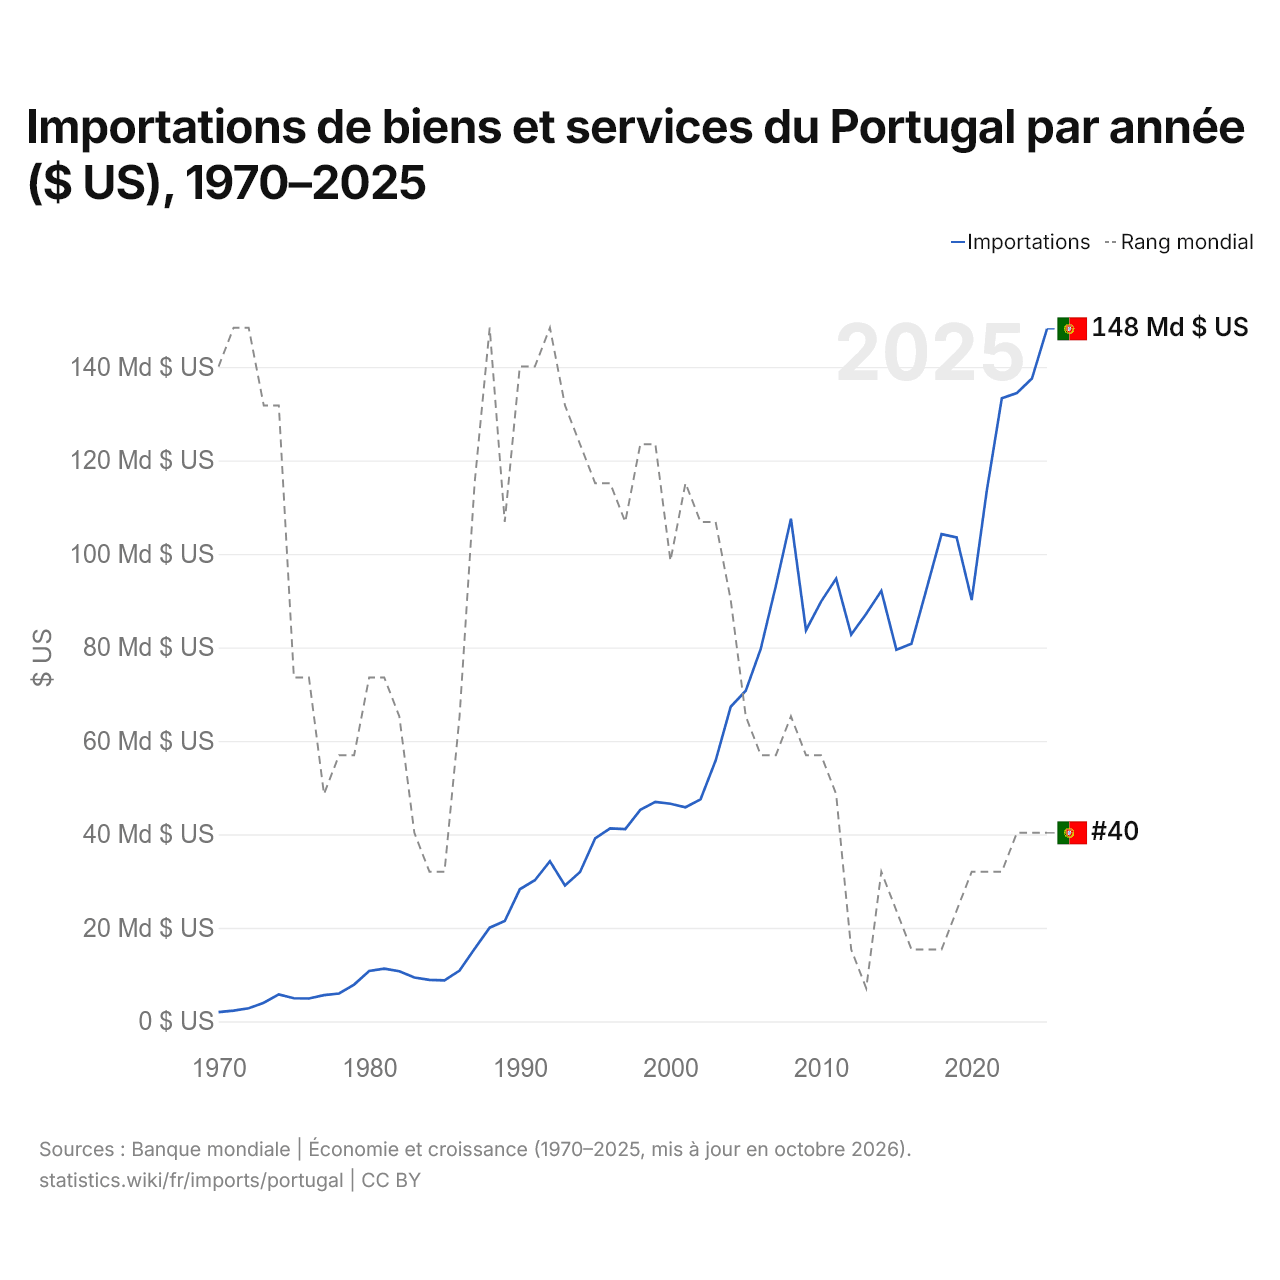
Importations de biens et services du Portugal par année ($ US), 1970–2025
| Année | $ US | Rang mondial |
|---|---|---|
| Importations | Rang mondial | |
| 2025 | 148 156 593 238 $ US | #40 |
| 2024 | 137 513 069 104 $ US | #40 |
| 2023 | 134 411 585 081 $ US | #40 |
| 2022 | 133 285 364 419 $ US | #41 |
| 2021 | 113 497 070 631 $ US | #41 |
| 2020 | 90 131 397 408 $ US | #41 |
| 2019 | 103 532 874 929 $ US | #42 |
| 2018 | 104 240 636 748 $ US | #43 |
| 2017 | 92 464 542 115 $ US | #43 |
| 2016 | 80 804 179 611 $ US | #43 |
| 2015 | 79 509 937 177 $ US | #42 |
| 2014 | 92 113 305 018 $ US | #41 |
| 2013 | 87 194 990 738 $ US | #44 |
| 2012 | 82 755 123 140 $ US | #43 |
| 2011 | 94 725 068 832 $ US | #39 |
| 2010 | 89 801 905 968 $ US | #38 |
| 2009 | 83 673 807 857 $ US | #38 |
| 2008 | 107 512 515 975 $ US | #37 |
| 2007 | 93 196 905 901 $ US | #38 |
| 2006 | 79 723 354 569 $ US | #38 |
| 2005 | 70 735 904 961 $ US | #37 |
| 2004 | 67 301 751 547 $ US | #34 |
| 2003 | 55 799 780 174 $ US | #32 |
| 2002 | 47 495 078 930 $ US | #32 |
| 2001 | 45 789 575 479 $ US | #31 |
| 2000 | 46 550 613 708 $ US | #33 |
| 1999 | 46 950 345 046 $ US | #30 |
| 1998 | 45 239 506 901 $ US | #30 |
| 1997 | 41 132 256 146 $ US | #32 |
| 1996 | 41 278 931 635 $ US | #31 |
| 1995 | 39 151 232 586 $ US | #31 |
| 1994 | 31 944 022 947 $ US | #30 |
| 1993 | 29 049 311 807 $ US | #29 |
| 1992 | 34 266 584 497 $ US | #27 |
| 1991 | 30 177 947 829 $ US | #28 |
| 1990 | 28 247 582 618 $ US | #28 |
| 1989 | 21 452 554 113 $ US | #32 |
| 1988 | 20 038 610 028 $ US | #27 |
| 1987 | 15 532 868 934 $ US | #31 |
| 1986 | 10 858 608 766 $ US | #37 |
| 1985 | 8 751 378 986 $ US | #41 |
| 1984 | 8 884 931 526 $ US | #41 |
| 1983 | 9 363 968 512 $ US | #40 |
| 1982 | 10 708 695 762 $ US | #37 |
| 1981 | 11 270 547 231 $ US | #36 |
| 1980 | 10 783 476 171 $ US | #36 |
| 1979 | 7 863 475 410 $ US | #38 |
| 1978 | 5 958 549 270 $ US | #38 |
| 1977 | 5 594 295 443 $ US | #39 |
| 1976 | 4 891 100 796 $ US | #36 |
| 1975 | 4 943 349 020 $ US | #36 |
| 1974 | 5 759 928 966 $ US | #29 |
| 1973 | 3 968 323 794 $ US | #29 |
| 1972 | 2 797 946 627 $ US | #27 |
| 1971 | 2 302 600 707 $ US | #27 |
| 1970 | 1 954 344 491 $ US | #28 |
En 2025, les importations de biens et services du Portugal s'élevaient à 148 milliards de dollars, contre 1,95 milliard de dollars en 1970. Elles se classaient au 40e rang mondial, un rang qu'elles occupent depuis 2023. Leur meilleur rang a été le 27e, occupé pour la dernière fois en 1992.
En 2025, les importations de biens et services du Portugal étaient les 20es plus élevées de 41 pays situés en Europe. En 2025, les exportations du Portugal dépassaient ses importations de 3,18 milliards de dollars, soit un excédent commercial. Le commerce du Portugal, exportations et importations réunies, équivalait à 86,4 % de son PIB en 2025, au 77e rang mondial.
Importations de biens du Portugal par catégorie, 2025
Importations de biens, 2025: 126 Md $US
En 2025, la première catégorie des importations de biens du Portugal était « machines, électronique et véhicules », avec 34,0 %, suivie de « produits chimiques, pharmaceutiques et plastiques », avec 16,8 %.
Origines des importations de biens du Portugal : les 10 premières, 2025
| Rang | Pays | Importations de biens | Part | |
|---|---|---|---|---|
| 1 |
 Espagne |
41,4 Md $US | 32,8 % | vs Espagne |
| 2 |
 Allemagne |
14,9 Md $US | 11,9 % | |
| 3 |
 France |
9,18 Md $US | 7,28 % | vs France |
| 4 |
 Pays-Bas |
7,53 Md $US | 5,98 % | vs Pays-Bas |
| 5 |
 Chine |
6,62 Md $US | 5,25 % | |
| 6 |
 Italie |
6,35 Md $US | 5,04 % | vs Italie |
| 7 |
 Belgique |
4,18 Md $US | 3,32 % | vs Belgique |
| 8 |
 Irlande |
3,63 Md $US | 2,88 % | vs Irlande |
| 9 |
 Brésil |
3,04 Md $US | 2,41 % | vs Brésil |
| 10 |
 États-Unis |
2,71 Md $US | 2,15 % | |
| Autres partenaires et non précisés | 26,5 Md $US | 21 % |
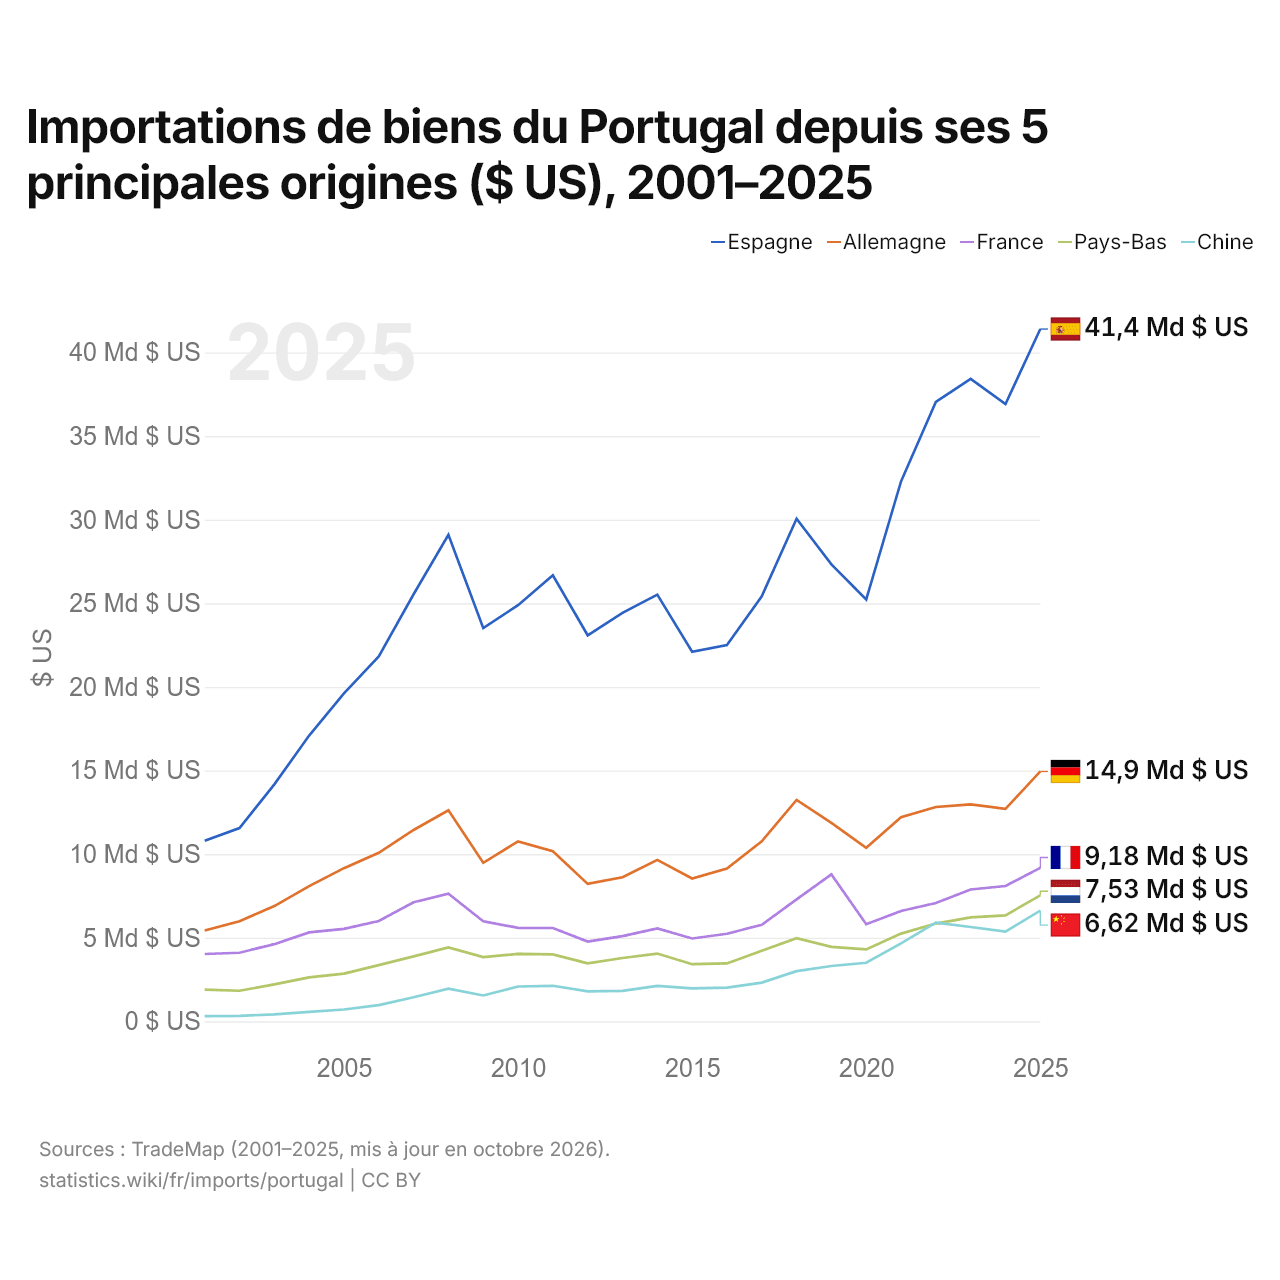
Importations de biens du Portugal depuis ses 5 principales origines ($ US), 2001–2025
| Année | $ US | ||||
|---|---|---|---|---|---|
| Espagne | Allemagne | France | Pays-Bas | Chine | |
| 2025 | 41 402 312 000 $ US | 14 944 605 000 $ US | 9 177 206 000 $ US | 7 534 891 000 $ US | 6 623 982 000 $ US |
| 2024 | 36 913 363 000 $ US | 12 707 140 000 $ US | 8 095 718 000 $ US | 6 334 911 000 $ US | 5 369 202 000 $ US |
| 2023 | 38 425 091 000 $ US | 12 974 217 000 $ US | 7 884 191 000 $ US | 6 218 092 000 $ US | 5 644 251 000 $ US |
| 2022 | 37 037 887 000 $ US | 12 816 833 000 $ US | 7 071 377 000 $ US | 5 846 046 000 $ US | 5 904 238 000 $ US |
| 2021 | 32 288 592 000 $ US | 12 210 776 000 $ US | 6 593 957 000 $ US | 5 245 019 000 $ US | 4 664 977 000 $ US |
| 2020 | 25 230 363 000 $ US | 10 379 500 000 $ US | 5 809 187 000 $ US | 4 302 146 000 $ US | 3 503 361 000 $ US |
| 2019 | 27 325 132 000 $ US | 11 871 966 000 $ US | 8 789 598 000 $ US | 4 450 509 000 $ US | 3 306 270 000 $ US |
| 2018 | 30 059 800 000 $ US | 13 241 094 000 $ US | 7 292 741 000 $ US | 4 968 938 000 $ US | 3 002 831 000 $ US |
| 2017 | 25 424 361 000 $ US | 10 761 725 000 $ US | 5 770 487 000 $ US | 4 226 342 000 $ US | 2 318 106 000 $ US |
| 2016 | 22 508 078 000 $ US | 9 130 899 000 $ US | 5 234 801 000 $ US | 3 465 025 000 $ US | 2 012 900 000 $ US |
| 2015 | 22 100 896 000 $ US | 8 542 151 000 $ US | 4 954 536 000 $ US | 3 418 520 000 $ US | 1 971 045 000 $ US |
| 2014 | 25 516 988 000 $ US | 9 654 866 000 $ US | 5 552 049 000 $ US | 4 053 499 000 $ US | 2 123 608 000 $ US |
| 2013 | 24 427 597 000 $ US | 8 615 532 000 $ US | 5 092 558 000 $ US | 3 784 649 000 $ US | 1 819 906 000 $ US |
| 2012 | 23 086 446 000 $ US | 8 220 118 000 $ US | 4 773 466 000 $ US | 3 470 445 000 $ US | 1 789 521 000 $ US |
| 2011 | 26 674 916 000 $ US | 10 173 847 000 $ US | 5 581 717 000 $ US | 4 005 251 000 $ US | 2 124 873 000 $ US |
| 2010 | 24 886 916 000 $ US | 10 761 952 000 $ US | 5 589 804 000 $ US | 4 033 788 000 $ US | 2 081 980 000 $ US |
| 2009 | 23 516 768 000 $ US | 9 478 357 000 $ US | 5 982 242 000 $ US | 3 842 609 000 $ US | 1 548 055 000 $ US |
| 2008 | 29 095 116 000 $ US | 12 621 539 000 $ US | 7 633 032 000 $ US | 4 420 567 000 $ US | 1 956 539 000 $ US |
| 2007 | 25 540 697 000 $ US | 11 443 989 000 $ US | 7 124 238 000 $ US | 3 884 432 000 $ US | 1 438 798 000 $ US |
| 2006 | 21 822 729 000 $ US | 10 076 740 000 $ US | 6 000 465 000 $ US | 3 359 849 000 $ US | 966 470 000 $ US |
| 2005 | 19 615 728 000 $ US | 9 160 672 000 $ US | 5 532 335 000 $ US | 2 853 629 000 $ US | 705 430 000 $ US |
| 2004 | 17 092 701 000 $ US | 8 086 331 000 $ US | 5 318 685 000 $ US | 2 631 325 000 $ US | 570 120 000 $ US |
| 2003 | 14 168 717 000 $ US | 6 893 636 000 $ US | 4 615 906 000 $ US | 2 211 570 000 $ US | 419 777 000 $ US |
| 2002 | 11 561 924 000 $ US | 5 988 495 000 $ US | 4 098 688 000 $ US | 1 827 805 000 $ US | 324 891 000 $ US |
| 2001 | 10 804 534 000 $ US | 5 434 156 000 $ US | 4 029 116 000 $ US | 1 899 804 000 $ US | 314 080 000 $ US |
En 2025, les importations de biens s'élevaient à 41,4 milliards de dollars en provenance de l'Espagne, 14,9 milliards de dollars en provenance de l'Allemagne, 9,18 milliards de dollars en provenance de la France, 7,53 milliards de dollars en provenance des Pays-Bas et 6,62 milliards de dollars en provenance de la Chine. Le premier rang des cinq fournisseurs du Portugal est occupé par l'Espagne chaque année depuis 2001. Le changement le plus récent dans leur ordre remonte à 2023, quand les importations du Portugal en provenance des Pays-Bas ont dépassé celles en provenance de la Chine.
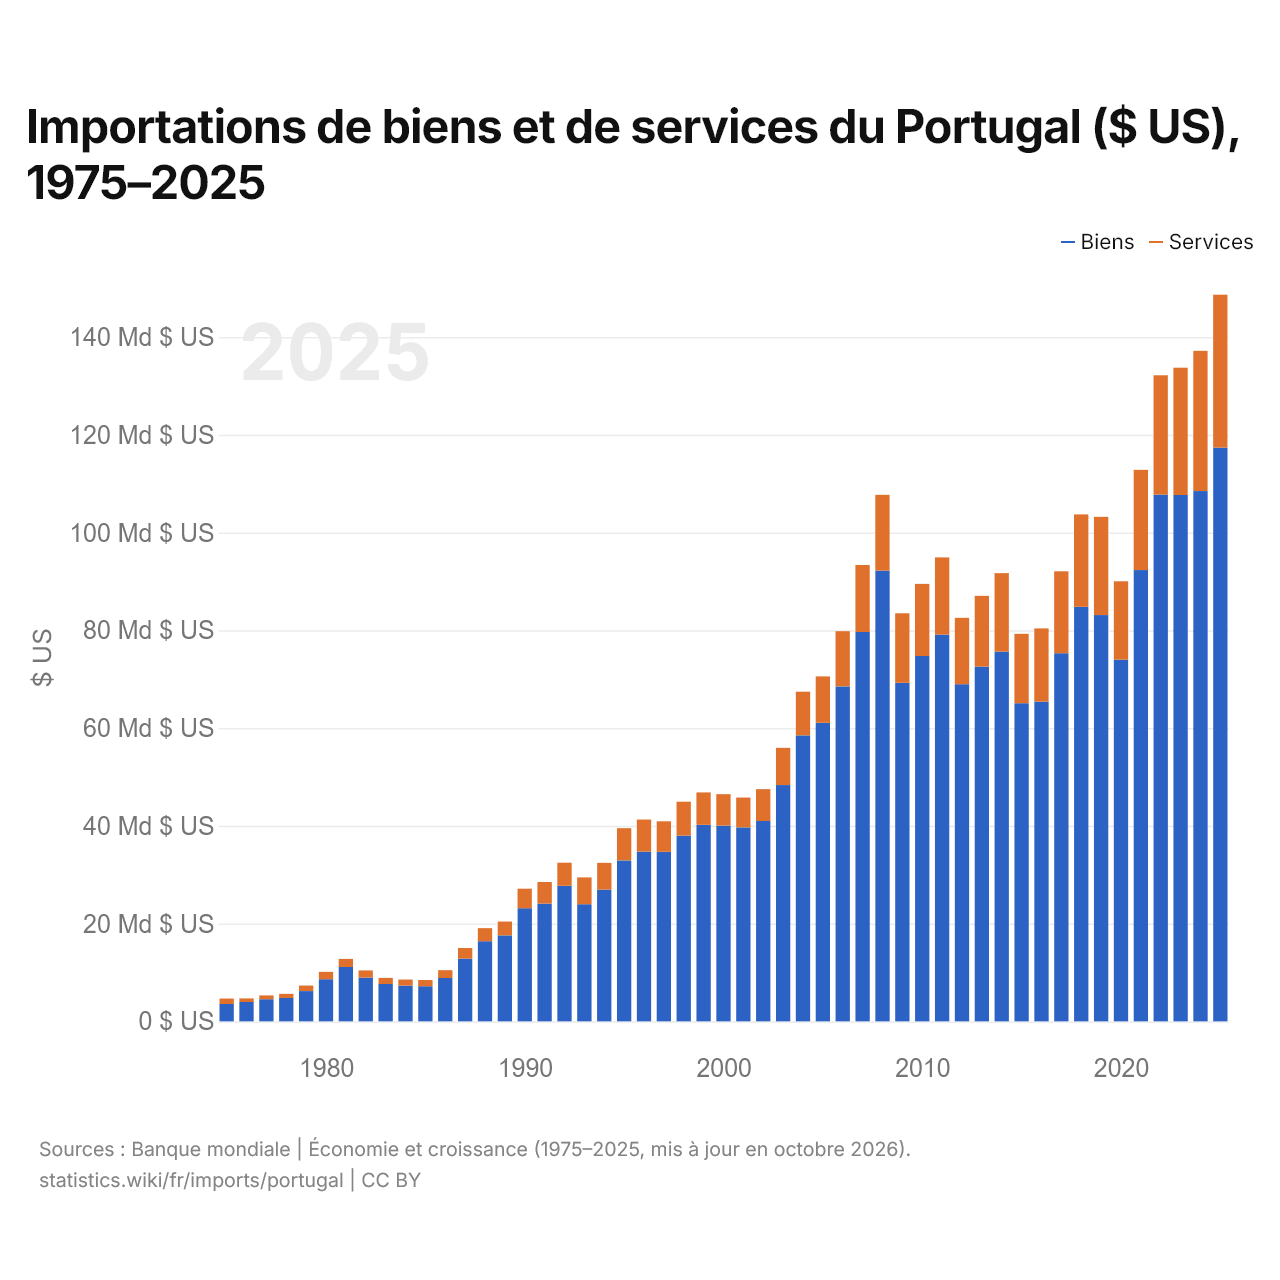
Importations de biens et de services du Portugal ($ US), 1975–2025
| Année | $ US | |
|---|---|---|
| Biens | Services | |
| 2025 | 117 375 732 963 $ US | 31 301 185 810 $ US |
| 2024 | 108 488 723 548 $ US | 28 692 456 508 $ US |
| 2023 | 107 691 795 691 $ US | 26 029 779 660 $ US |
| 2022 | 107 747 805 161 $ US | 24 445 432 883 $ US |
| 2021 | 92 328 186 431 $ US | 20 515 482 725 $ US |
| 2020 | 74 002 455 385 $ US | 16 033 679 048 $ US |
| 2019 | 83 124 852 588 $ US | 20 092 509 511 $ US |
| 2018 | 84 823 794 507 $ US | 18 884 012 680 $ US |
| 2017 | 75 328 797 670 $ US | 16 745 606 383 $ US |
| 2016 | 65 418 689 104 $ US | 14 975 101 693 $ US |
| 2015 | 65 081 974 321 $ US | 14 198 145 370 $ US |
| 2014 | 75 632 559 800 $ US | 16 077 819 356 $ US |
| 2013 | 72 576 021 059 $ US | 14 480 713 294 $ US |
| 2012 | 68 976 872 164 $ US | 13 593 565 912 $ US |
| 2011 | 79 107 457 031 $ US | 15 809 763 793 $ US |
| 2010 | 74 742 407 953 $ US | 14 757 498 483 $ US |
| 2009 | 69 267 518 437 $ US | 14 217 353 721 $ US |
| 2008 | 92 224 603 797 $ US | 15 506 245 499 $ US |
| 2007 | 79 677 143 955 $ US | 13 699 808 687 $ US |
| 2006 | 68 515 828 634 $ US | 11 302 344 212 $ US |
| 2005 | 61 096 450 338 $ US | 9 483 144 254 $ US |
| 2004 | 58 499 146 094 $ US | 8 938 470 526 $ US |
| 2003 | 48 341 163 580 $ US | 7 619 178 160 $ US |
| 2002 | 40 988 197 209 $ US | 6 510 032 001 $ US |
| 2001 | 39 680 687 182 $ US | 6 106 488 804 $ US |
| 2000 | 40 060 675 051 $ US | 6 419 158 182 $ US |
| 1999 | 40 223 982 019 $ US | 6 605 476 613 $ US |
| 1998 | 38 003 635 517 $ US | 6 940 379 226 $ US |
| 1997 | 34 690 193 041 $ US | 6 246 475 796 $ US |
| 1996 | 34 744 714 351 $ US | 6 545 587 977 $ US |
| 1995 | 32 917 190 823 $ US | 6 596 296 950 $ US |
| 1994 | 26 945 070 700 $ US | 5 481 348 314 $ US |
| 1993 | 23 951 637 129 $ US | 5 491 430 314 $ US |
| 1992 | 27 735 130 293 $ US | 4 731 715 471 $ US |
| 1991 | 24 079 176 461 $ US | 4 419 524 449 $ US |
| 1990 | 23 141 438 690 $ US | 4 004 693 556 $ US |
| 1989 | 17 585 037 843 $ US | 2 830 300 355 $ US |
| 1988 | 16 391 968 365 $ US | 2 668 372 782 $ US |
| 1987 | 12 847 203 746 $ US | 2 156 514 378 $ US |
| 1986 | 8 875 997 007 $ US | 1 585 423 667 $ US |
| 1985 | 7 178 781 813 $ US | 1 268 727 119 $ US |
| 1984 | 7 297 230 847 $ US | 1 243 526 871 $ US |
| 1983 | 7 631 289 448 $ US | 1 253 814 895 $ US |
| 1982 | 8 953 412 015 $ US | 1 461 873 969 $ US |
| 1981 | 11 132 171 276 $ US | 1 638 660 574 $ US |
| 1980 | 8 611 178 776 $ US | 1 524 574 171 $ US |
| 1979 | 6 182 965 550 $ US | 1 127 591 447 $ US |
| 1978 | 4 783 064 984 $ US | 848 788 384 $ US |
| 1977 | 4 528 216 141 $ US | 784 987 396 $ US |
| 1976 | 3 960 337 156 $ US | 730 432 918 $ US |
| 1975 | 3 544 383 136 $ US | 1 109 878 169 $ US |
En 2025, les importations de biens du Portugal s'élevaient à 117 milliards de dollars et celles de services à 31,3 milliards de dollars ; les services représentaient 21,1 % du total, contre 23,8 % en 1975.
Le Portugal dans le classement mondial des importations, 2025
| Rang | Pays | Importations | Part mondiale | |
|---|---|---|---|---|
| 37 |
 Hongrie |
168 Md $US | 0,5 % | vs Hongrie |
| 38 |
 Luxembourg |
161 Md $US | 0,48 % | |
| 39 |
 Israël |
155 Md $US | 0,46 % | vs Israël |
| 40 |
 Portugal |
148 Md $US | 0,44 % | |
| 41 |
 Slovaquie |
132 Md $US | 0,39 % | |
| 42 |
 Finlande |
130 Md $US | 0,39 % | |
| 43 |
 Afrique du Sud |
126 Md $US | 0,37 % |
Importations de biens et services du Portugal, % du PIB, 1970–2025
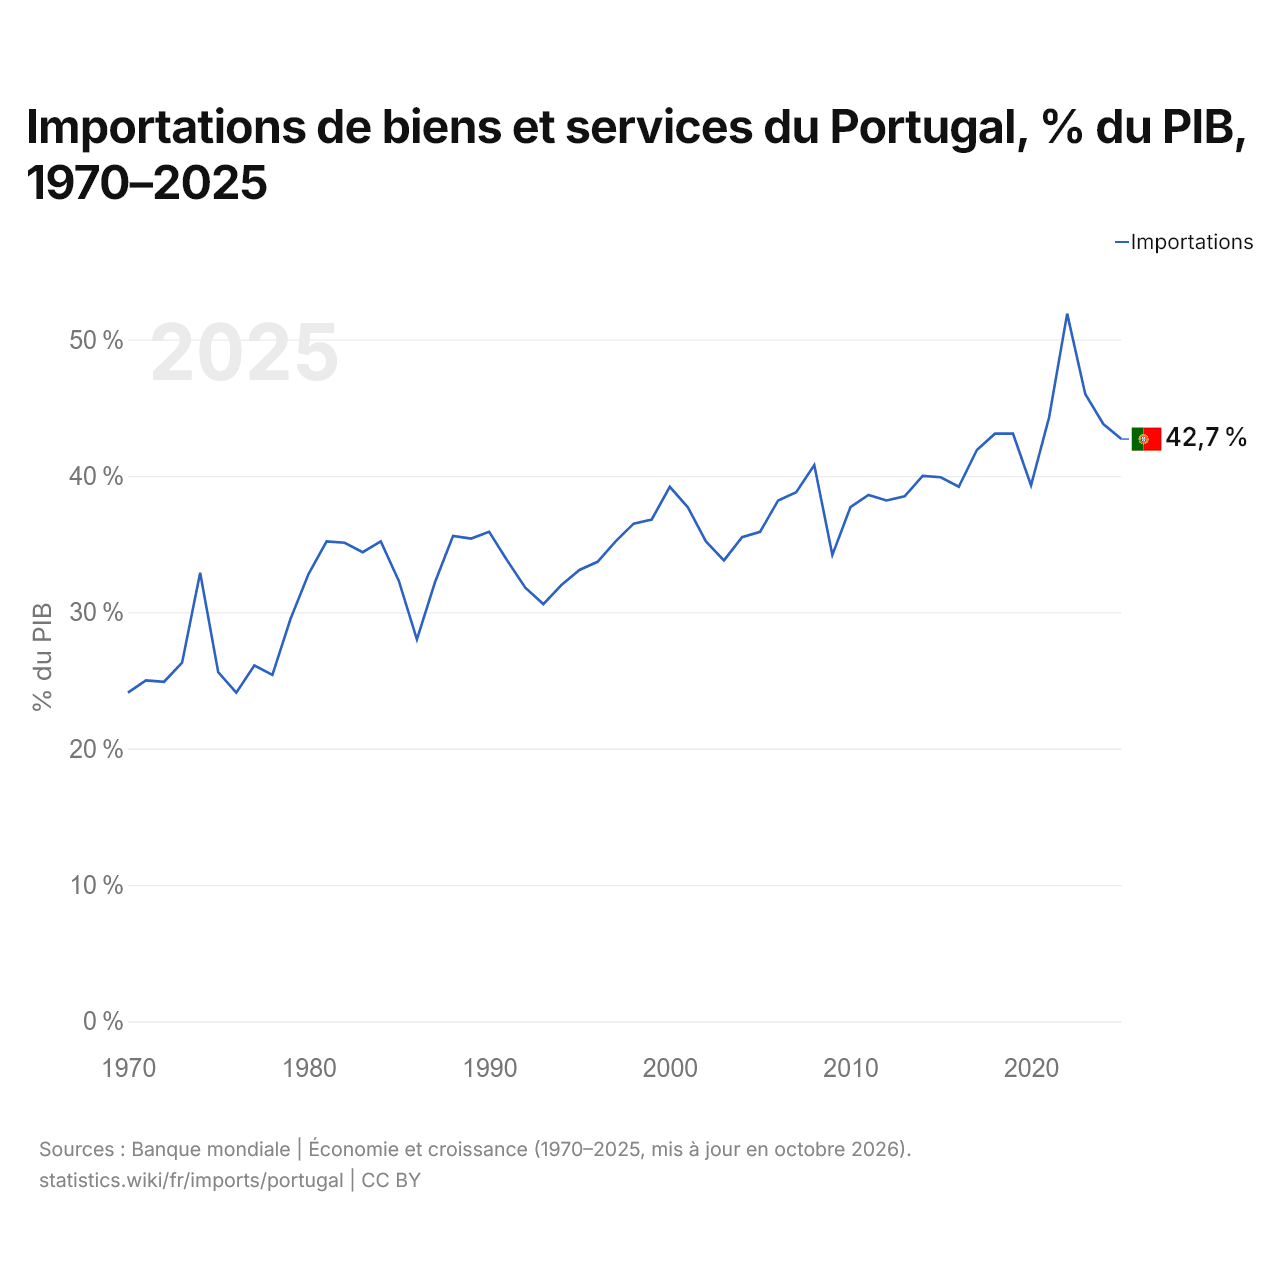
En 2025, les importations de biens et services du Portugal équivalaient à 42,7 % de son PIB, contre 24,1 % en 1970. La part la plus élevée a été de 51,9 %, en 2022.
Comparer les importations du Portugal avec celles d'autres pays
Sources :
- TradeMap (2001–2025, mis à jour en octobre 2026)
- Banque mondiale | Économie et croissance (1970–2025, mis à jour en octobre 2026)
Creative Commons Attribution (CC BY) : vous pouvez copier, partager, adapter et réutiliser ce contenu, y compris à des fins commerciales, à condition de citer statistics.wiki et d’indiquer les modifications apportées. Les sources citées ci-dessus peuvent avoir leurs propres conditions de licence.