
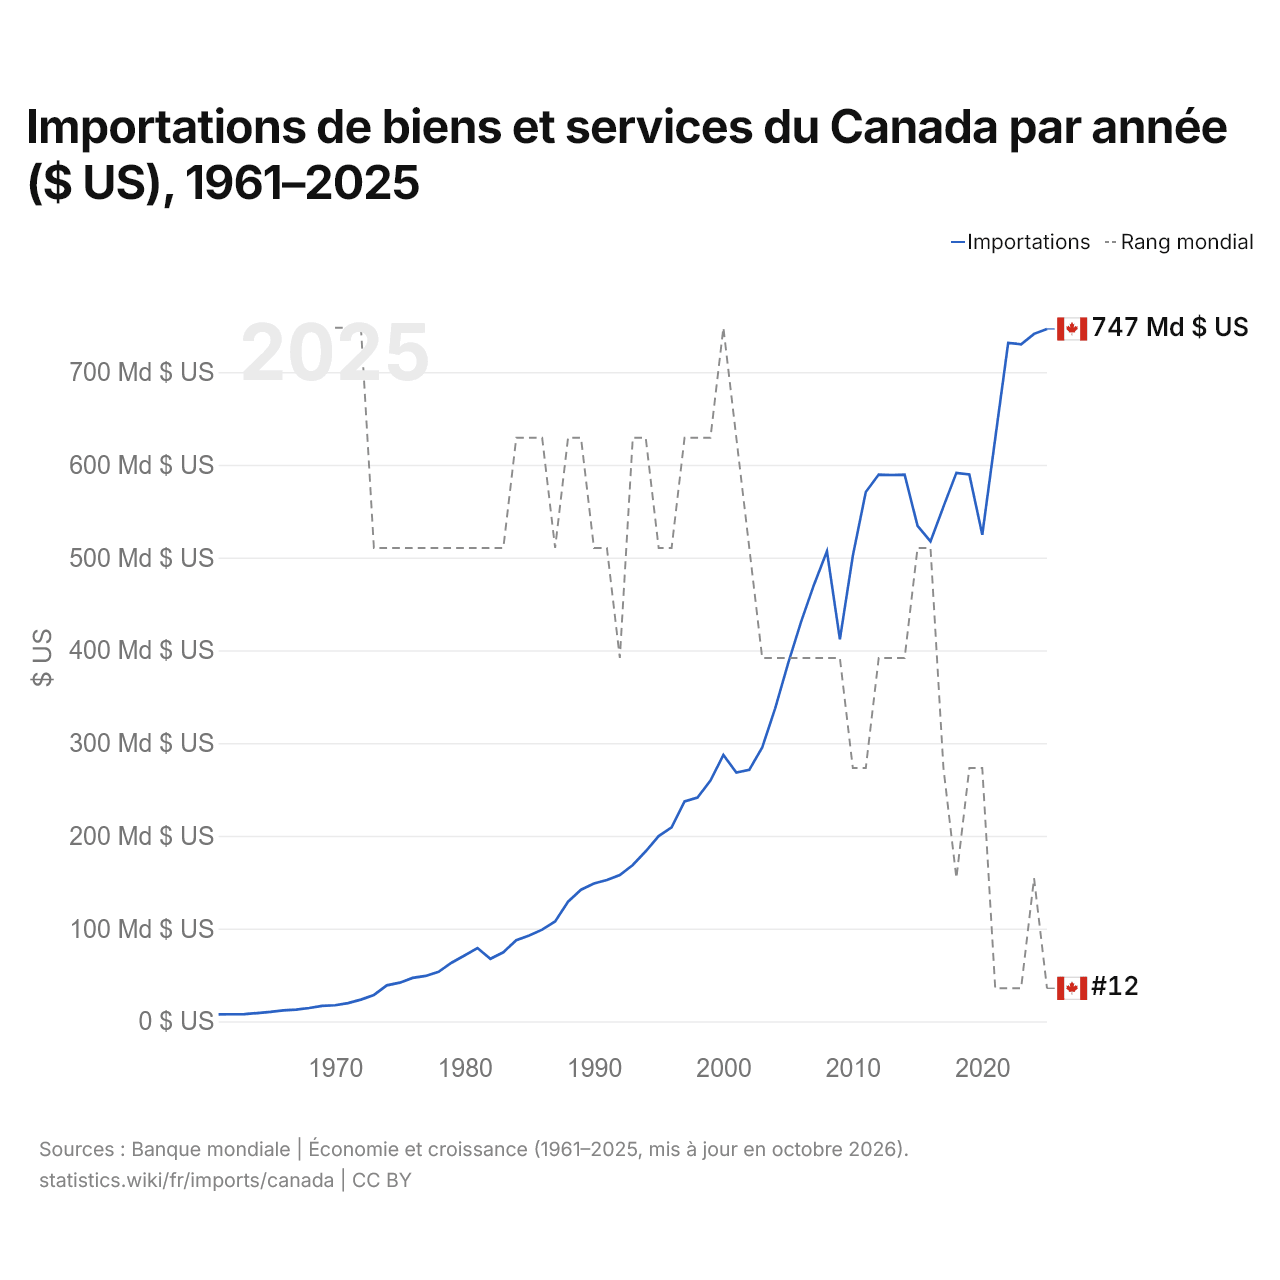
Importations de biens et services du Canada par année ($ US), 1961–2025
| Année | $ US | Rang mondial |
|---|---|---|
| Importations | Rang mondial | |
| 2025 | 746 500 089 837 $ US | #12 |
| 2024 | 741 233 987 716 $ US | #11 |
| 2023 | 729 991 623 300 $ US | #12 |
| 2022 | 731 290 006 744 $ US | #12 |
| 2021 | 628 388 638 999 $ US | #12 |
| 2020 | 524 572 641 557 $ US | #10 |
| 2019 | 589 706 748 631 $ US | #10 |
| 2018 | 591 347 645 767 $ US | #11 |
| 2017 | 554 922 650 425 $ US | #10 |
| 2016 | 517 396 012 626 $ US | #8 |
| 2015 | 534 115 083 556 $ US | #8 |
| 2014 | 589 434 433 378 $ US | #9 |
| 2013 | 589 048 627 265 $ US | #9 |
| 2012 | 589 511 490 952 $ US | #9 |
| 2011 | 570 642 753 938 $ US | #10 |
| 2010 | 502 035 342 677 $ US | #10 |
| 2009 | 411 817 863 704 $ US | #9 |
| 2008 | 506 718 837 863 $ US | #9 |
| 2007 | 470 813 704 497 $ US | #9 |
| 2006 | 430 736 071 932 $ US | #9 |
| 2005 | 385 981 185 014 $ US | #9 |
| 2004 | 337 418 139 892 $ US | #9 |
| 2003 | 295 296 552 709 $ US | #9 |
| 2002 | 271 159 115 529 $ US | #8 |
| 2001 | 268 281 895 661 $ US | #7 |
| 2000 | 287 155 747 088 $ US | #6 |
| 1999 | 259 518 745 373 $ US | #7 |
| 1998 | 241 249 747 219 $ US | #7 |
| 1997 | 237 129 134 768 $ US | #7 |
| 1996 | 209 119 911 991 $ US | #8 |
| 1995 | 199 747 158 263 $ US | #8 |
| 1994 | 183 320 152 314 $ US | #7 |
| 1993 | 168 552 050 229 $ US | #7 |
| 1992 | 157 743 857 036 $ US | #9 |
| 1991 | 152 336 562 800 $ US | #8 |
| 1990 | 148 543 023 654 $ US | #8 |
| 1989 | 141 918 074 324 $ US | #7 |
| 1988 | 128 938 815 308 $ US | #7 |
| 1987 | 107 690 045 249 $ US | #8 |
| 1986 | 98 835 552 357 $ US | #7 |
| 1985 | 92 626 876 602 $ US | #7 |
| 1984 | 87 539 186 163 $ US | #7 |
| 1983 | 74 471 762 415 $ US | #8 |
| 1982 | 67 407 797 682 $ US | #8 |
| 1981 | 79 017 432 647 $ US | #8 |
| 1980 | 70 921 142 662 $ US | #8 |
| 1979 | 63 191 053 440 $ US | #8 |
| 1978 | 53 336 547 734 $ US | #8 |
| 1977 | 48 954 395 863 $ US | #8 |
| 1976 | 46 807 302 231 $ US | #8 |
| 1975 | 41 679 119 151 $ US | #8 |
| 1974 | 38 774 028 630 $ US | #8 |
| 1973 | 28 460 153 985 $ US | #8 |
| 1972 | 23 413 476 109 $ US | #6 |
| 1971 | 19 613 784 908 $ US | #6 |
| 1970 | 17 327 973 969 $ US | #6 |
| 1969 | 16 708 226 654 $ US | - |
| 1968 | 14 340 936 627 $ US | - |
| 1967 | 12 634 558 505 $ US | - |
| 1966 | 11 787 616 836 $ US | - |
| 1965 | 10 166 208 353 $ US | - |
| 1964 | 8 918 902 585 $ US | - |
| 1963 | 7 854 369 043 $ US | - |
| 1962 | 7 594 733 340 $ US | - |
| 1961 | 7 480 255 449 $ US | - |
En 2025, les importations de biens et services du Canada s'élevaient à 747 milliards de dollars, contre 7,48 milliards de dollars en 1961. Elles se classaient au 12e rang mondial, en baisse par rapport au 11e rang en 2024. Leur meilleur rang a été le 6e, occupé pour la dernière fois en 2000.
En 2025, les importations de biens et services du Canada étaient les plus faibles des deux pays situés en Amérique du Nord. En 2025, les importations du Canada dépassaient ses exportations de 19,6 milliards de dollars, soit un déficit commercial. Le commerce du Canada, exportations et importations réunies, équivalait à 63,5 % de son PIB en 2025, au 112e rang mondial.
Importations de biens du Canada par catégorie, 2025
Importations de biens, 2025: 564 Md $US
En 2025, la première catégorie des importations de biens du Canada était « machines, électronique et véhicules », avec 45,2 %, suivie de « produits chimiques, pharmaceutiques et plastiques », avec 11,5 %.
Origines des importations de biens du Canada : les 10 premières, 2025
| Rang | Pays | Importations de biens | Part | |
|---|---|---|---|---|
| 1 |
 États-Unis |
259 Md $US | 45,9 % | vs USA |
| 2 |
 Chine |
64,8 Md $US | 11,5 % | vs Chine |
| 3 |
 Mexique |
38,2 Md $US | 6,77 % | vs Mexique |
| 4 |
 Allemagne |
18,0 Md $US | 3,18 % | vs Allemagne |
| 5 |
 Japon |
15,1 Md $US | 2,67 % | vs Japon |
| 6 |
 Vietnam |
13,8 Md $US | 2,44 % | vs Vietnam |
| 7 |
 Corée du Sud |
12,4 Md $US | 2,19 % | vs Corée du Sud |
| 8 |
 Italie |
9,76 Md $US | 1,73 % | vs Italie |
| 9 |
 Brésil |
8,30 Md $US | 1,47 % | vs Brésil |
| 10 |
 Suisse |
7,40 Md $US | 1,31 % | vs Suisse |
| Autres partenaires et non précisés | 117 Md $US | 20,8 % |
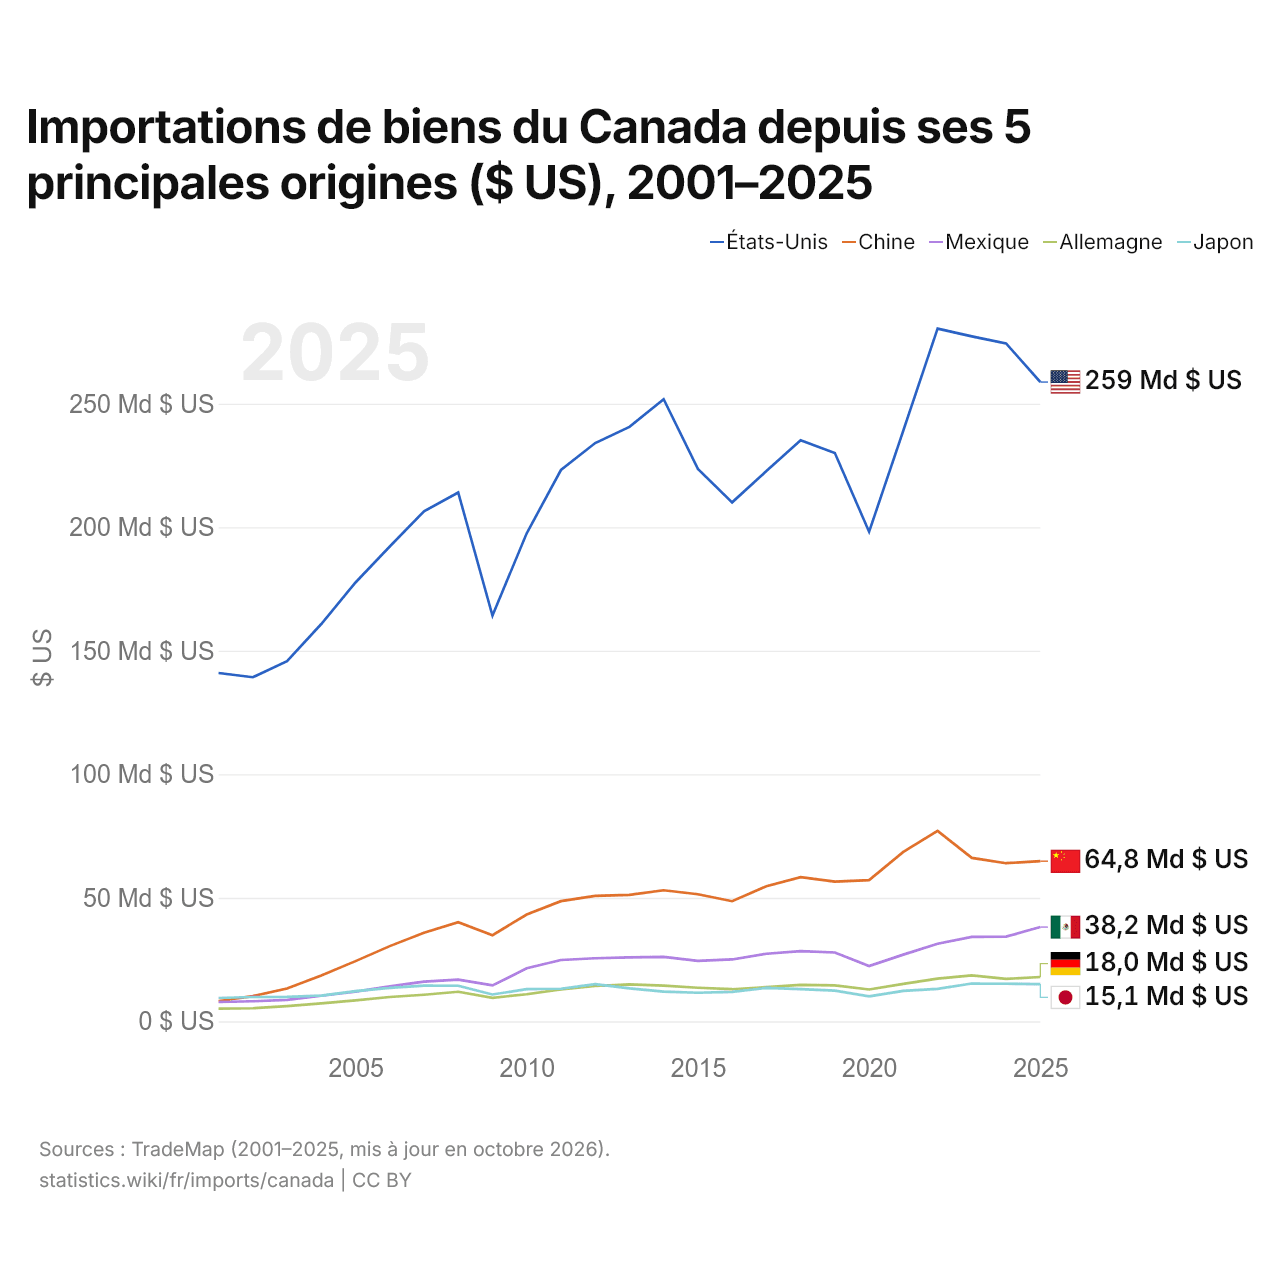
Importations de biens du Canada depuis ses 5 principales origines ($ US), 2001–2025
| Année | $ US | ||||
|---|---|---|---|---|---|
| États-Unis | Chine | Mexique | Allemagne | Japon | |
| 2025 | 258 775 055 000 $ US | 64 824 485 000 $ US | 38 152 673 000 $ US | 17 956 733 000 $ US | 15 070 903 000 $ US |
| 2024 | 274 400 049 000 $ US | 64 006 553 000 $ US | 34 292 830 000 $ US | 17 178 291 000 $ US | 15 228 499 000 $ US |
| 2023 | 277 238 741 000 $ US | 66 139 693 000 $ US | 34 194 179 000 $ US | 18 573 921 000 $ US | 15 310 978 000 $ US |
| 2022 | 280 373 715 000 $ US | 77 054 920 000 $ US | 31 388 372 000 $ US | 17 299 128 000 $ US | 13 148 135 000 $ US |
| 2021 | 239 142 015 000 $ US | 68 592 641 000 $ US | 27 007 646 000 $ US | 15 146 970 000 $ US | 12 329 779 000 $ US |
| 2020 | 198 153 091 000 $ US | 57 178 795 000 $ US | 22 354 189 000 $ US | 12 886 233 000 $ US | 10 102 570 000 $ US |
| 2019 | 230 056 369 000 $ US | 56 538 916 000 $ US | 27 877 842 000 $ US | 14 568 062 000 $ US | 12 419 114 000 $ US |
| 2018 | 235 165 895 000 $ US | 58 337 435 000 $ US | 28 421 850 000 $ US | 14 735 865 000 $ US | 13 004 113 000 $ US |
| 2017 | 222 713 812 000 $ US | 54 686 882 000 $ US | 27 362 561 000 $ US | 13 865 064 000 $ US | 13 508 337 000 $ US |
| 2016 | 210 063 508 000 $ US | 48 614 669 000 $ US | 25 050 323 000 $ US | 13 004 141 000 $ US | 11 927 760 000 $ US |
| 2015 | 223 612 805 000 $ US | 51 459 684 000 $ US | 24 449 877 000 $ US | 13 601 473 000 $ US | 11 579 535 000 $ US |
| 2014 | 251 814 356 000 $ US | 53 066 196 000 $ US | 26 070 727 000 $ US | 14 436 100 000 $ US | 12 046 255 000 $ US |
| 2013 | 240 614 339 000 $ US | 51 209 845 000 $ US | 25 919 404 000 $ US | 14 955 469 000 $ US | 13 342 175 000 $ US |
| 2012 | 234 075 807 000 $ US | 50 764 772 000 $ US | 25 535 745 000 $ US | 14 310 175 000 $ US | 15 038 601 000 $ US |
| 2011 | 223 172 493 000 $ US | 48 653 536 000 $ US | 24 813 963 000 $ US | 12 921 002 000 $ US | 13 193 768 000 $ US |
| 2010 | 197 547 489 000 $ US | 43 240 160 000 $ US | 21 465 147 000 $ US | 10 961 191 000 $ US | 13 054 187 000 $ US |
| 2009 | 164 245 761 000 $ US | 34 872 191 000 $ US | 14 531 603 000 $ US | 9 515 792 000 $ US | 10 860 575 000 $ US |
| 2008 | 214 046 444 000 $ US | 40 152 203 000 $ US | 16 857 734 000 $ US | 11 975 258 000 $ US | 14 404 327 000 $ US |
| 2007 | 206 439 119 000 $ US | 35 824 735 000 $ US | 16 050 279 000 $ US | 10 752 358 000 $ US | 14 447 453 000 $ US |
| 2006 | 192 177 944 000 $ US | 30 443 272 000 $ US | 14 131 524 000 $ US | 9 849 533 000 $ US | 13 521 424 000 $ US |
| 2005 | 177 635 571 000 $ US | 24 369 378 000 $ US | 12 049 995 000 $ US | 8 480 681 000 $ US | 12 220 229 000 $ US |
| 2004 | 160 827 007 000 $ US | 18 549 053 000 $ US | 10 339 013 000 $ US | 7 253 190 000 $ US | 10 400 000 000 $ US |
| 2003 | 145 755 351 000 $ US | 13 288 636 000 $ US | 8 717 560 000 $ US | 6 182 421 000 $ US | 9 882 956 000 $ US |
| 2002 | 139 278 667 000 $ US | 10 201 969 000 $ US | 8 123 440 000 $ US | 5 286 882 000 $ US | 9 834 672 000 $ US |
| 2001 | 140 999 710 000 $ US | 8 218 605 000 $ US | 7 830 572 000 $ US | 5 167 147 000 $ US | 9 457 044 000 $ US |
En 2025, les importations de biens s'élevaient à 259 milliards de dollars en provenance des États-Unis, 64,8 milliards de dollars en provenance de la Chine, 38,2 milliards de dollars en provenance du Mexique, 18 milliards de dollars en provenance de l'Allemagne et 15,1 milliards de dollars en provenance du Japon. Le premier rang des cinq fournisseurs du Canada est occupé par les États-Unis chaque année depuis 2001. Le changement le plus récent dans leur ordre remonte à 2013, quand les importations du Canada en provenance de l'Allemagne ont dépassé celles en provenance du Japon.
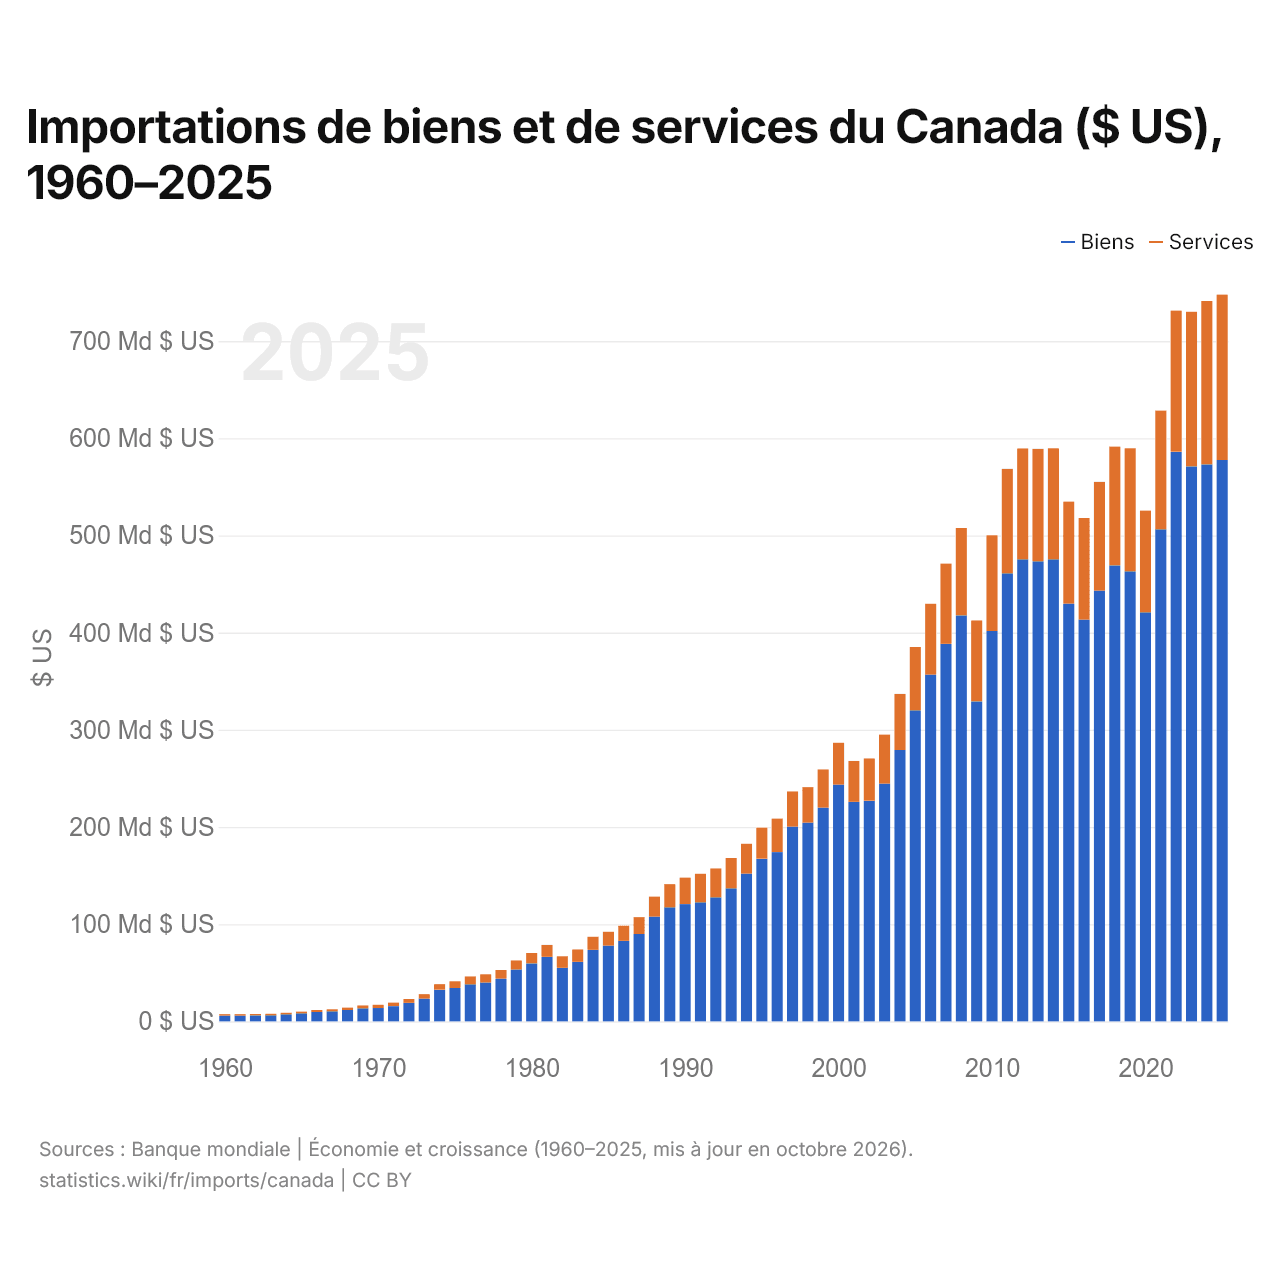
Importations de biens et de services du Canada ($ US), 1960–2025
| Année | $ US | |
|---|---|---|
| Biens | Services | |
| 2025 | 577 615 991 602 $ US | 170 111 193 941 $ US |
| 2024 | 573 028 834 803 $ US | 168 194 396 355 $ US |
| 2023 | 570 991 392 744 $ US | 159 059 069 587 $ US |
| 2022 | 586 117 550 208 $ US | 145 194 295 413 $ US |
| 2021 | 506 375 956 455 $ US | 122 083 469 425 $ US |
| 2020 | 420 834 199 766 $ US | 104 751 420 150 $ US |
| 2019 | 463 037 393 814 $ US | 126 628 927 209 $ US |
| 2018 | 469 161 032 559 $ US | 122 227 887 628 $ US |
| 2017 | 443 193 974 673 $ US | 111 907 891 782 $ US |
| 2016 | 413 307 338 379 $ US | 104 550 207 375 $ US |
| 2015 | 429 745 146 705 $ US | 104 975 888 755 $ US |
| 2014 | 475 387 395 798 $ US | 114 239 109 597 $ US |
| 2013 | 473 442 246 734 $ US | 115 622 359 688 $ US |
| 2012 | 475 455 180 194 $ US | 114 024 620 099 $ US |
| 2011 | 461 045 055 460 $ US | 107 414 566 548 $ US |
| 2010 | 401 725 653 271 $ US | 98 437 352 800 $ US |
| 2009 | 329 188 189 982 $ US | 83 248 040 464 $ US |
| 2008 | 417 650 072 904 $ US | 89 925 399 192 $ US |
| 2007 | 388 460 238 960 $ US | 82 582 819 572 $ US |
| 2006 | 356 733 639 849 $ US | 72 942 113 508 $ US |
| 2005 | 319 980 738 185 $ US | 65 194 728 778 $ US |
| 2004 | 279 223 472 586 $ US | 57 656 056 409 $ US |
| 2003 | 244 637 872 992 $ US | 50 432 044 985 $ US |
| 2002 | 226 966 700 130 $ US | 43 532 101 581 $ US |
| 2001 | 225 807 734 699 $ US | 42 123 325 539 $ US |
| 2000 | 243 653 094 238 $ US | 42 970 424 017 $ US |
| 1999 | 219 964 188 988 $ US | 39 187 897 180 $ US |
| 1998 | 204 404 842 828 $ US | 36 534 166 833 $ US |
| 1997 | 200 313 205 538 $ US | 36 213 460 700 $ US |
| 1996 | 174 132 082 952 $ US | 34 503 498 701 $ US |
| 1995 | 167 288 493 745 $ US | 31 973 786 675 $ US |
| 1994 | 151 925 132 007 $ US | 30 813 113 522 $ US |
| 1993 | 136 927 040 672 $ US | 31 109 007 636 $ US |
| 1992 | 127 557 726 668 $ US | 29 702 674 943 $ US |
| 1991 | 122 583 688 217 $ US | 29 193 137 796 $ US |
| 1990 | 120 638 310 120 $ US | 27 197 547 053 $ US |
| 1989 | 117 422 155 952 $ US | 23 798 201 274 $ US |
| 1988 | 107 834 838 208 $ US | 20 481 158 558 $ US |
| 1987 | 89 919 975 086 $ US | 17 218 783 846 $ US |
| 1986 | 82 835 322 907 $ US | 15 510 800 611 $ US |
| 1985 | 77 966 401 402 $ US | 14 184 487 323 $ US |
| 1984 | 73 595 366 983 $ US | 13 438 219 295 $ US |
| 1983 | 61 148 556 752 $ US | 12 792 202 454 $ US |
| 1982 | 55 108 492 485 $ US | 11 865 115 207 $ US |
| 1981 | 66 416 224 996 $ US | 12 196 218 261 $ US |
| 1980 | 59 592 867 406 $ US | 10 665 850 858 $ US |
| 1979 | 53 379 217 674 $ US | 9 231 600 402 $ US |
| 1978 | 43 876 493 061 $ US | 8 868 573 324 $ US |
| 1977 | 39 990 471 067 $ US | 8 405 548 920 $ US |
| 1976 | 38 143 380 409 $ US | 8 085 932 711 $ US |
| 1975 | 34 371 315 280 $ US | 6 797 257 573 $ US |
| 1974 | 32 518 068 548 $ US | 5 734 016 807 $ US |
| 1973 | 23 356 423 958 $ US | 4 577 909 482 $ US |
| 1972 | 19 025 774 581 $ US | 3 921 578 446 $ US |
| 1971 | 15 627 272 764 $ US | 3 590 257 701 $ US |
| 1970 | 13 692 389 079 $ US | 3 303 302 618 $ US |
| 1969 | 13 496 509 517 $ US | 2 898 502 568 $ US |
| 1968 | 11 736 291 482 $ US | 2 363 687 273 $ US |
| 1967 | 10 270 365 176 $ US | 2 163 054 642 $ US |
| 1966 | 9 642 204 358 $ US | 1 979 410 618 $ US |
| 1965 | 8 272 326 064 $ US | 1 756 544 345 $ US |
| 1964 | 7 180 772 609 $ US | 1 614 539 859 $ US |
| 1963 | 6 310 830 848 $ US | 1 439 419 690 $ US |
| 1962 | 6 070 867 668 $ US | 1 428 316 042 $ US |
| 1961 | 5 900 316 841 $ US | 1 489 953 450 $ US |
| 1960 | 5 912 923 434 $ US | 1 529 267 842 $ US |
En 2025, les importations de biens du Canada s'élevaient à 578 milliards de dollars et celles de services à 170 milliards de dollars ; les services représentaient 22,8 % du total, contre 20,5 % en 1960.
Le Canada dans le classement mondial des importations, 2025
| Rang | Pays | Importations | Part mondiale | |
|---|---|---|---|---|
| 9 |
 Singapour |
860 Md $US | 2,55 % | vs Singapour |
| 10 |
Italie
|
773 Md $US | 2,29 % | vs Italie |
| 11 |
Corée du Sud
|
760 Md $US | 2,25 % | vs Corée du Sud |
| 12 |
 Canada |
747 Md $US | 2,21 % | |
| 13 |
Mexique
|
738 Md $US | 2,19 % | vs Mexique |
| 14 |
Suisse
|
721 Md $US | 2,14 % | vs Suisse |
| 15 |
 Irlande |
721 Md $US | 2,14 % | vs Irlande |
Importations de biens et services du Canada, % du PIB, 1961–2025
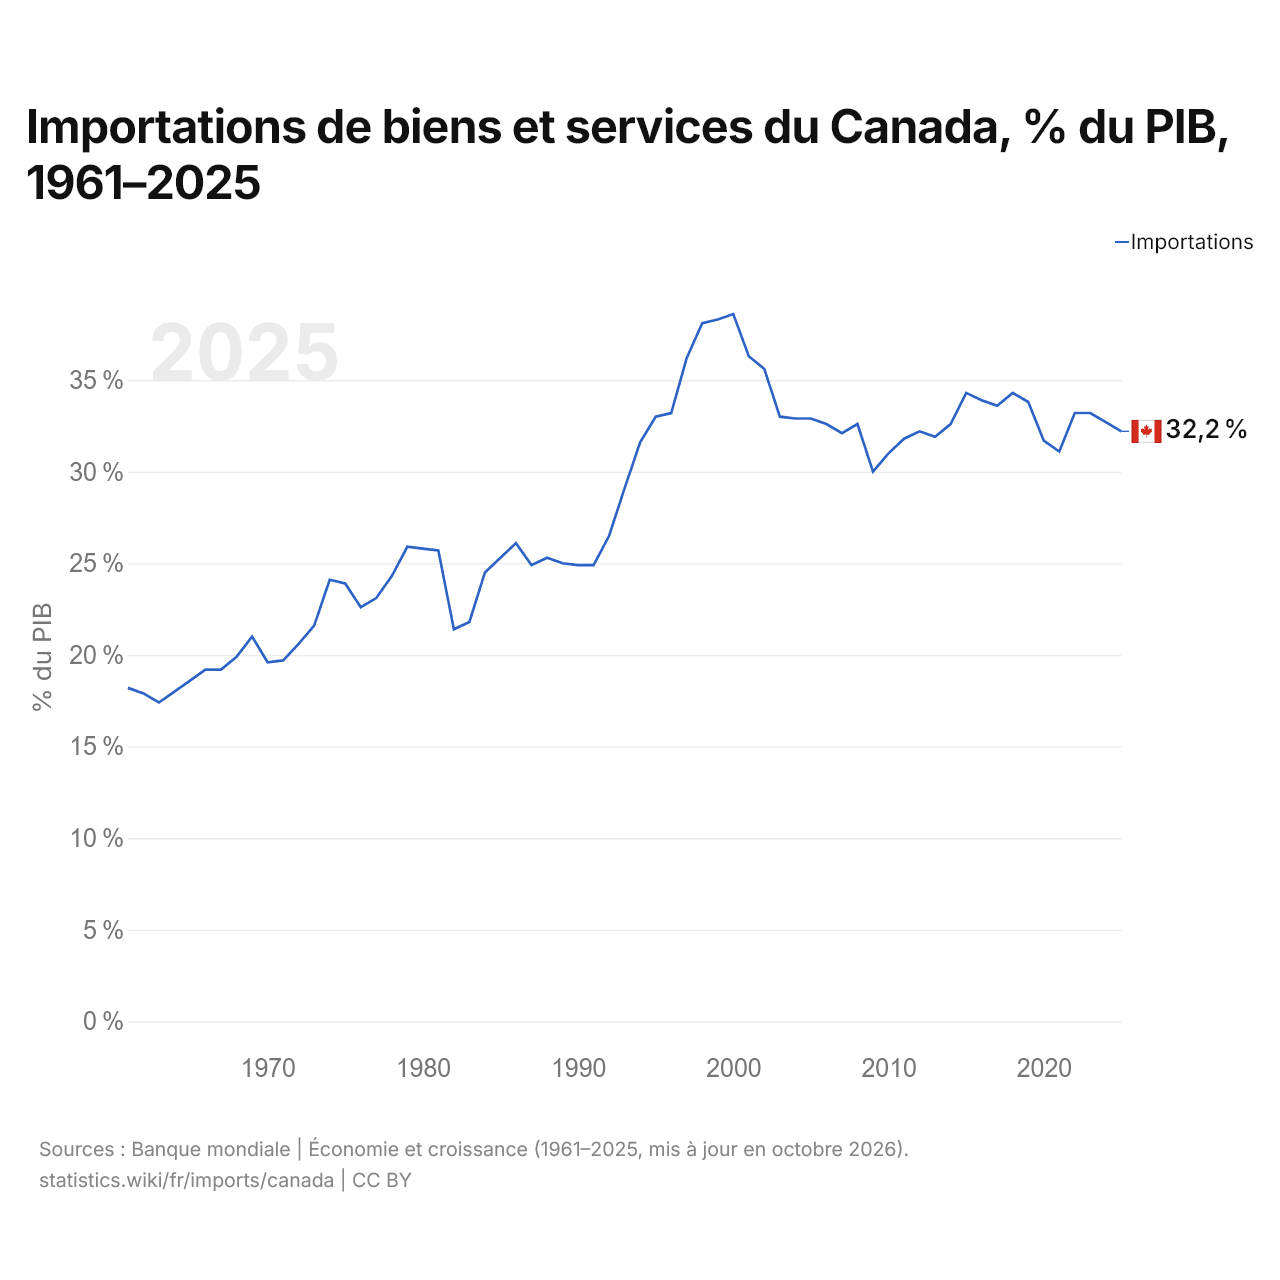
En 2025, les importations de biens et services du Canada équivalaient à 32,2 % de son PIB, contre 18,2 % en 1961. La part la plus élevée a été de 38,6 %, en 2000.
Comparer les importations du Canada avec celles d'autres pays
Sources :
- Banque mondiale | Économie et croissance (1960–2025, mis à jour en octobre 2026)
- TradeMap (2001–2025, mis à jour en octobre 2026)
Creative Commons Attribution (CC BY) : vous pouvez copier, partager, adapter et réutiliser ce contenu, y compris à des fins commerciales, à condition de citer statistics.wiki et d’indiquer les modifications apportées. Les sources citées ci-dessus peuvent avoir leurs propres conditions de licence.