
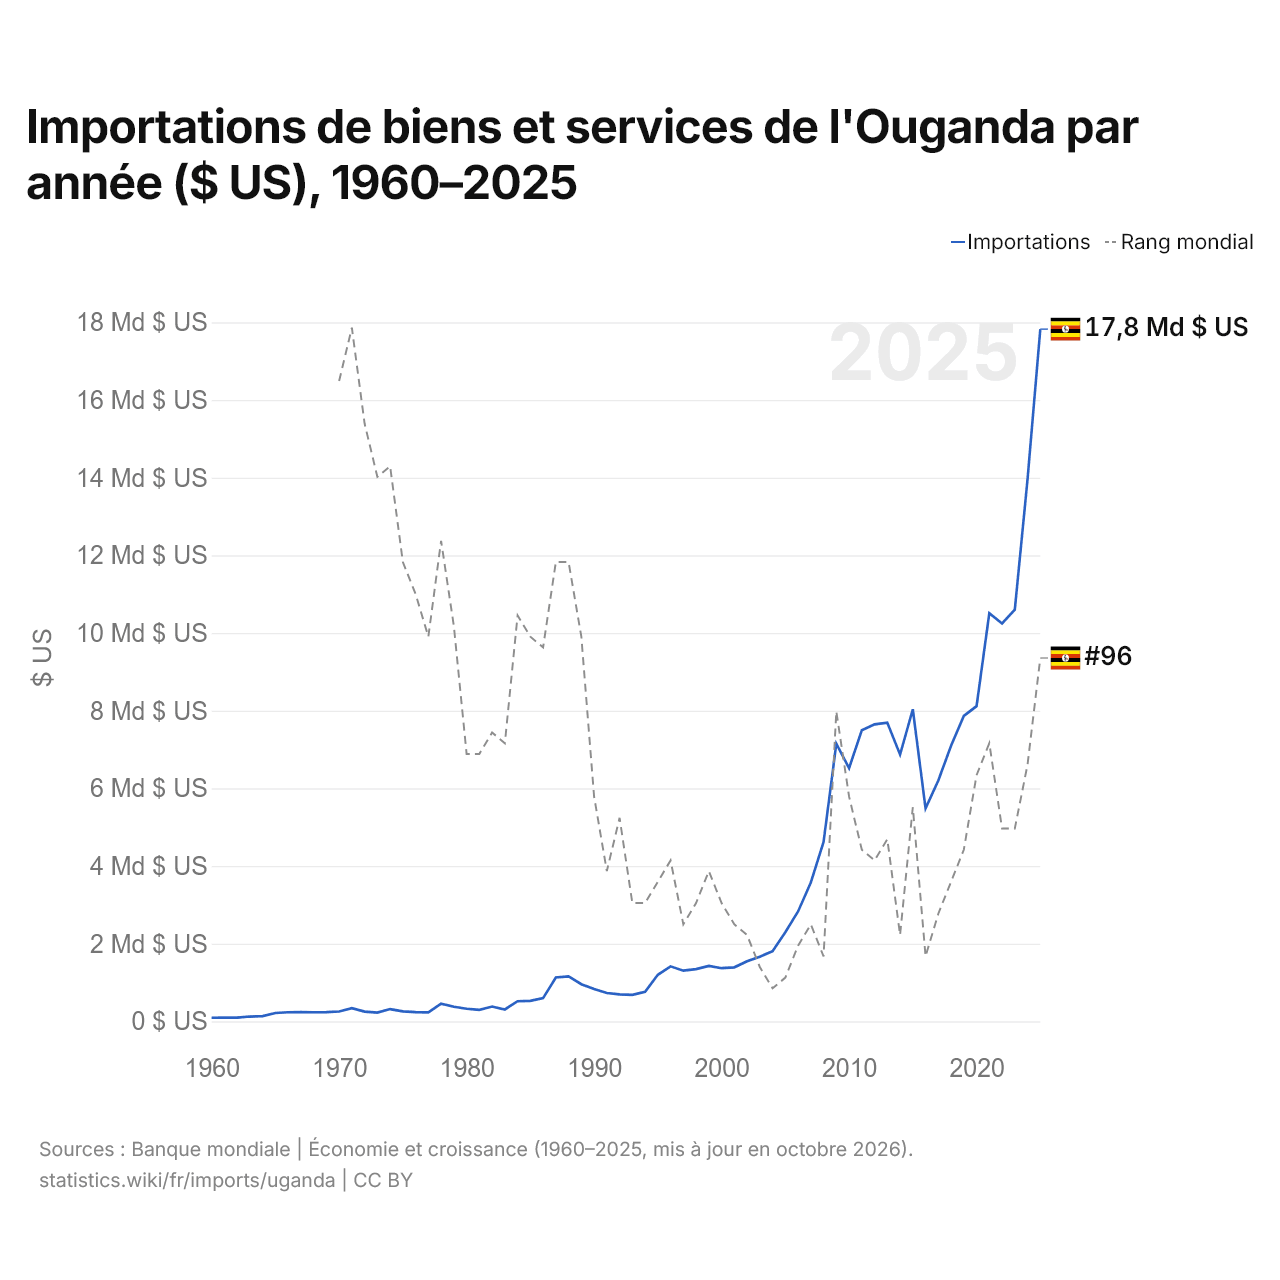
Importations de biens et services de l'Ouganda par année ($ US), 1960–2025
| Année | $ US | Rang mondial |
|---|---|---|
| Importations | Rang mondial | |
| 2025 | 17 826 764 688 $ US | #96 |
| 2024 | 13 960 593 894 $ US | #106 |
| 2023 | 10 602 364 862 $ US | #112 |
| 2022 | 10 244 593 521 $ US | #112 |
| 2021 | 10 510 437 146 $ US | #104 |
| 2020 | 8 116 375 577 $ US | #107 |
| 2019 | 7 866 761 702 $ US | #114 |
| 2018 | 7 096 219 372 $ US | #117 |
| 2017 | 6 202 981 526 $ US | #120 |
| 2016 | 5 485 150 866 $ US | #124 |
| 2015 | 8 035 899 288 $ US | #110 |
| 2014 | 6 870 189 627 $ US | #122 |
| 2013 | 7 690 477 050 $ US | #113 |
| 2012 | 7 648 498 556 $ US | #115 |
| 2011 | 7 497 355 183 $ US | #114 |
| 2010 | 6 520 260 385 $ US | #109 |
| 2009 | 7 148 939 024 $ US | #101 |
| 2008 | 4 617 770 608 $ US | #124 |
| 2007 | 3 577 000 118 $ US | #121 |
| 2006 | 2 829 448 599 $ US | #123 |
| 2005 | 2 292 674 584 $ US | #126 |
| 2004 | 1 807 281 866 $ US | #127 |
| 2003 | 1 664 868 876 $ US | #125 |
| 2002 | 1 548 626 997 $ US | #122 |
| 2001 | 1 390 734 599 $ US | #121 |
| 2000 | 1 368 560 402 $ US | #119 |
| 1999 | 1 426 046 617 $ US | #116 |
| 1998 | 1 343 623 399 $ US | #119 |
| 1997 | 1 303 961 977 $ US | #121 |
| 1996 | 1 415 906 250 $ US | #115 |
| 1995 | 1 199 003 460 $ US | #117 |
| 1994 | 762 125 449 $ US | #119 |
| 1993 | 682 002 410 $ US | #119 |
| 1992 | 694 106 644 $ US | #111 |
| 1991 | 728 713 355 $ US | #116 |
| 1990 | 833 711 479 $ US | #109 |
| 1989 | 954 685 692 $ US | #94 |
| 1988 | 1 157 116 667 $ US | #87 |
| 1987 | 1 131 228 162 $ US | #87 |
| 1986 | 597 834 914 $ US | #95 |
| 1985 | 528 247 561 $ US | #94 |
| 1984 | 517 947 171 $ US | #92 |
| 1983 | 305 666 667 $ US | #104 |
| 1982 | 381 500 000 $ US | #103 |
| 1981 | 295 000 000 $ US | #105 |
| 1980 | 324 000 000 $ US | #105 |
| 1979 | 375 000 000 $ US | #93 |
| 1978 | 456 521 739 $ US | #85 |
| 1977 | 229 000 000 $ US | #94 |
| 1976 | 235 100 000 $ US | #90 |
| 1975 | 257 555 556 $ US | #87 |
| 1974 | 315 796 977 $ US | #78 |
| 1973 | 223 858 657 $ US | #79 |
| 1972 | 250 174 997 $ US | #74 |
| 1971 | 339 493 210 $ US | #65 |
| 1970 | 253 394 932 $ US | #70 |
| 1969 | 237 715 246 $ US | - |
| 1968 | 234 635 307 $ US | - |
| 1967 | 235 895 282 $ US | - |
| 1966 | 234 355 313 $ US | - |
| 1965 | 215 455 691 $ US | - |
| 1964 | 136 093 399 $ US | - |
| 1963 | 123 298 894 $ US | - |
| 1962 | 96 334 175 $ US | - |
| 1961 | 95 593 893 $ US | - |
| 1960 | 92 315 052 $ US | - |
En 2025, les importations de biens et services de l'Ouganda s'élevaient à 17,8 milliards de dollars, contre 92,3 millions de dollars en 1960. Elles se classaient au 96e rang mondial, en hausse par rapport au 106e rang en 2024. Leur meilleur rang a été le 65e, occupé pour la dernière fois en 1971.
En 2025, les importations de biens et services de l'Ouganda étaient les 13es plus élevées de 50 pays situés en Afrique. En 2025, les importations de l'Ouganda dépassaient ses exportations de 4,54 milliards de dollars, soit un déficit commercial. Le commerce de l'Ouganda, exportations et importations réunies, équivalait à 50,2 % de son PIB en 2025, au 134e rang mondial.
Importations de biens de l'Ouganda par catégorie, 2025
Importations de biens, 2025: 18,9 Md $US
En 2025, la première catégorie des importations de biens de l'Ouganda était « métaux précieux, pierres précieuses, bijoux, montres, instruments de musique et art », avec 34,0 %, suivie de « machines, électronique et véhicules », avec 17,7 %.
Origines des importations de biens de l'Ouganda : les 10 premières, 2025
| Rang | Pays | Importations de biens | Part | |
|---|---|---|---|---|
| 1 |
 Chine |
3,33 Md $US | 17,7 % | |
| 2 |
 Tanzanie |
2,70 Md $US | 14,3 % | vs Tanzanie |
| 3 |
 Kenya |
1,62 Md $US | 8,58 % | vs Kenya |
| 4 |
 Inde |
1,48 Md $US | 7,87 % | |
| 5 |
 EAU |
1,13 Md $US | 6 % | |
| 6 |
 Afrique du Sud |
1,02 Md $US | 5,43 % | |
| 7 |
 Burkina Faso |
638 M $US | 3,39 % | vs Burkina Faso |
| 8 |
 Mozambique |
613 M $US | 3,25 % | |
| 9 |
 Japon |
539 M $US | 2,86 % | |
| 10 |
 Égypte |
491 M $US | 2,61 % | |
| Autres partenaires et non précisés | 5,29 Md $US | 28,1 % |
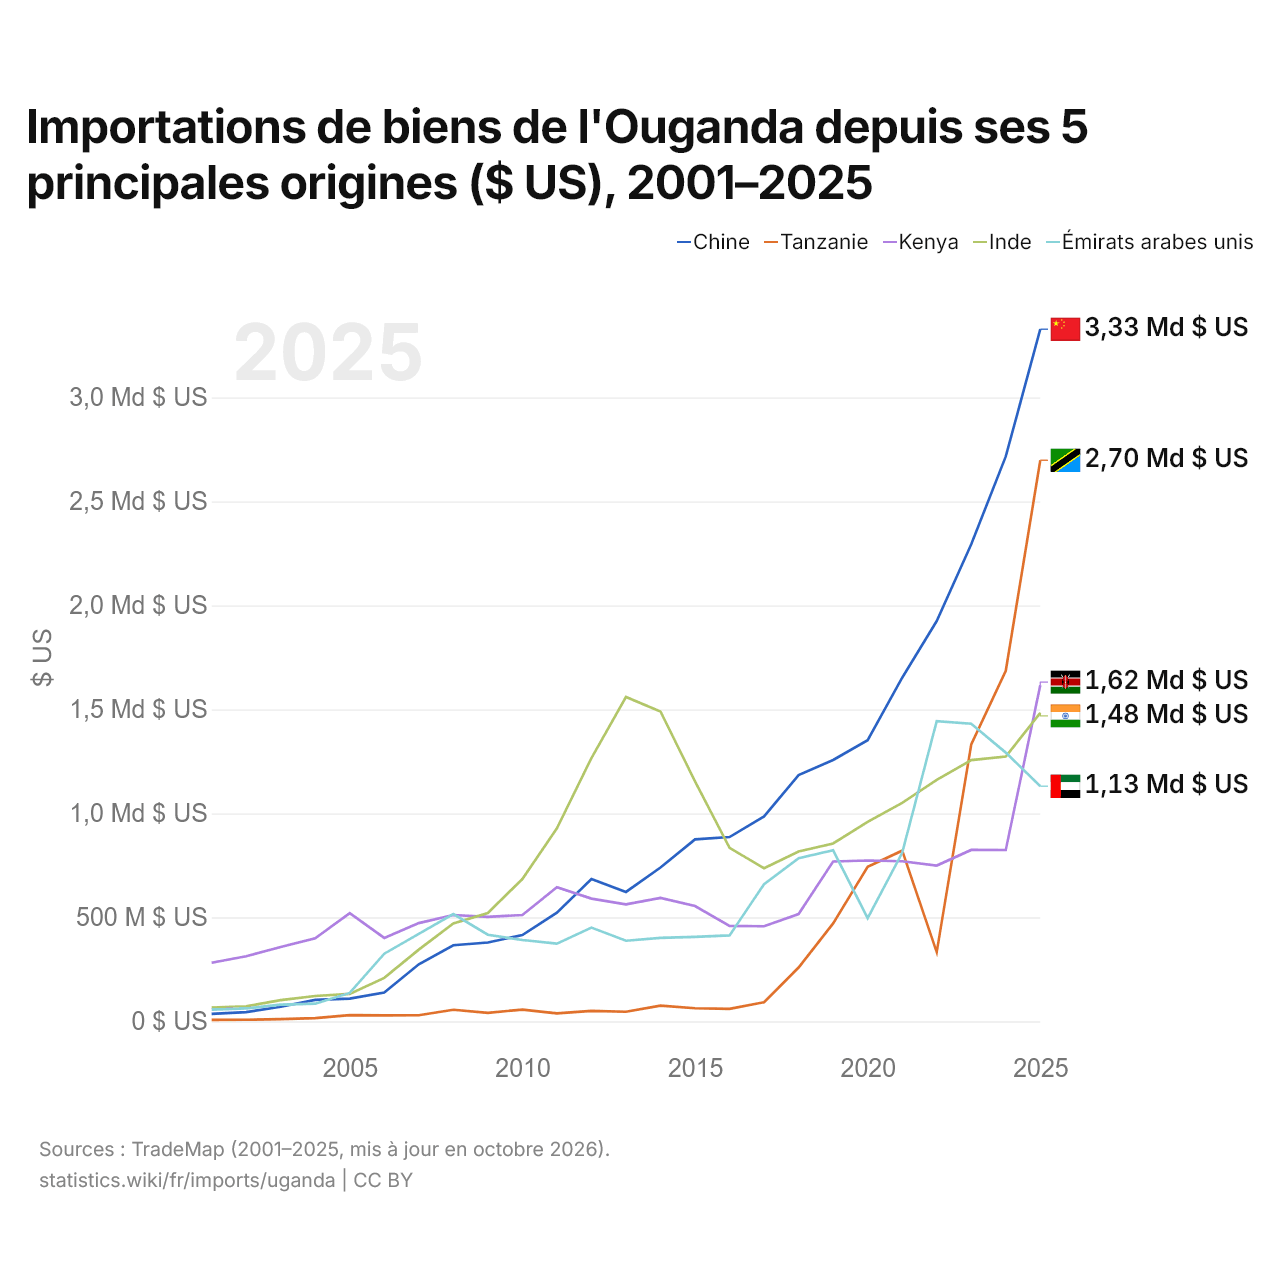
Importations de biens de l'Ouganda depuis ses 5 principales origines ($ US), 2001–2025
| Année | $ US | ||||
|---|---|---|---|---|---|
| Chine | Tanzanie | Kenya | Inde | Émirats arabes unis | |
| 2025 | 3 328 257 000 $ US | 2 698 058 000 $ US | 1 616 813 000 $ US | 1 483 352 000 $ US | 1 130 637 000 $ US |
| 2024 | 2 716 537 000 $ US | 1 685 453 000 $ US | 824 007 000 $ US | 1 273 578 000 $ US | 1 292 307 000 $ US |
| 2023 | 2 294 089 000 $ US | 1 331 244 000 $ US | 824 245 000 $ US | 1 255 899 000 $ US | 1 431 327 000 $ US |
| 2022 | 1 924 717 000 $ US | 332 846 000 $ US | 749 156 000 $ US | 1 161 109 000 $ US | 1 442 963 000 $ US |
| 2021 | 1 652 460 000 $ US | 820 734 000 $ US | 769 734 000 $ US | 1 050 830 000 $ US | 810 529 000 $ US |
| 2020 | 1 351 952 000 $ US | 743 682 000 $ US | 773 230 000 $ US | 959 110 000 $ US | 495 866 000 $ US |
| 2019 | 1 256 568 000 $ US | 470 934 000 $ US | 768 691 000 $ US | 855 088 000 $ US | 822 374 000 $ US |
| 2018 | 1 184 404 000 $ US | 258 759 000 $ US | 515 853 000 $ US | 816 923 000 $ US | 784 057 000 $ US |
| 2017 | 985 748 000 $ US | 91 794 000 $ US | 457 231 000 $ US | 736 246 000 $ US | 659 690 000 $ US |
| 2016 | 886 223 000 $ US | 59 685 000 $ US | 458 994 000 $ US | 834 545 000 $ US | 413 198 000 $ US |
| 2015 | 875 016 000 $ US | 62 890 000 $ US | 554 530 000 $ US | 1 153 940 000 $ US | 405 899 000 $ US |
| 2014 | 739 643 000 $ US | 75 721 000 $ US | 593 888 000 $ US | 1 490 195 000 $ US | 401 281 000 $ US |
| 2013 | 622 044 000 $ US | 45 931 000 $ US | 562 819 000 $ US | 1 559 857 000 $ US | 387 534 000 $ US |
| 2012 | 684 227 000 $ US | 49 970 000 $ US | 590 165 000 $ US | 1 266 181 000 $ US | 450 834 000 $ US |
| 2011 | 522 492 000 $ US | 37 972 000 $ US | 644 575 000 $ US | 928 081 000 $ US | 373 308 000 $ US |
| 2010 | 414 658 000 $ US | 56 528 000 $ US | 511 531 000 $ US | 684 410 000 $ US | 391 040 000 $ US |
| 2009 | 379 211 000 $ US | 40 798 000 $ US | 502 659 000 $ US | 521 084 000 $ US | 416 552 000 $ US |
| 2008 | 365 783 000 $ US | 55 483 000 $ US | 511 333 000 $ US | 470 490 000 $ US | 515 527 000 $ US |
| 2007 | 274 322 000 $ US | 29 197 000 $ US | 472 448 000 $ US | 344 971 000 $ US | 420 549 000 $ US |
| 2006 | 138 260 000 $ US | 28 709 000 $ US | 400 965 000 $ US | 208 987 000 $ US | 325 253 000 $ US |
| 2005 | 109 217 000 $ US | 30 093 000 $ US | 520 686 000 $ US | 131 813 000 $ US | 136 702 000 $ US |
| 2004 | 103 090 000 $ US | 15 779 000 $ US | 399 198 000 $ US | 121 773 000 $ US | 84 881 000 $ US |
| 2003 | 70 248 000 $ US | 10 789 000 $ US | 357 327 000 $ US | 102 160 000 $ US | 80 441 000 $ US |
| 2002 | 44 046 000 $ US | 7 510 000 $ US | 312 871 000 $ US | 71 913 000 $ US | 61 918 000 $ US |
| 2001 | 36 227 000 $ US | 6 652 000 $ US | 281 486 000 $ US | 66 555 000 $ US | 56 258 000 $ US |
En 2025, les importations de biens s'élevaient à 3,33 milliards de dollars en provenance de la Chine, 2,7 milliards de dollars en provenance de la Tanzanie, 1,62 milliard de dollars en provenance du Kenya, 1,48 milliard de dollars en provenance de l'Inde et 1,13 milliard de dollars en provenance des Émirats arabes unis. Le premier rang des cinq fournisseurs de l'Ouganda est occupé par la Chine depuis 2016. Le changement le plus récent dans leur ordre remonte à 2025, quand les importations de l'Ouganda en provenance du Kenya ont dépassé celles en provenance de l'Inde.
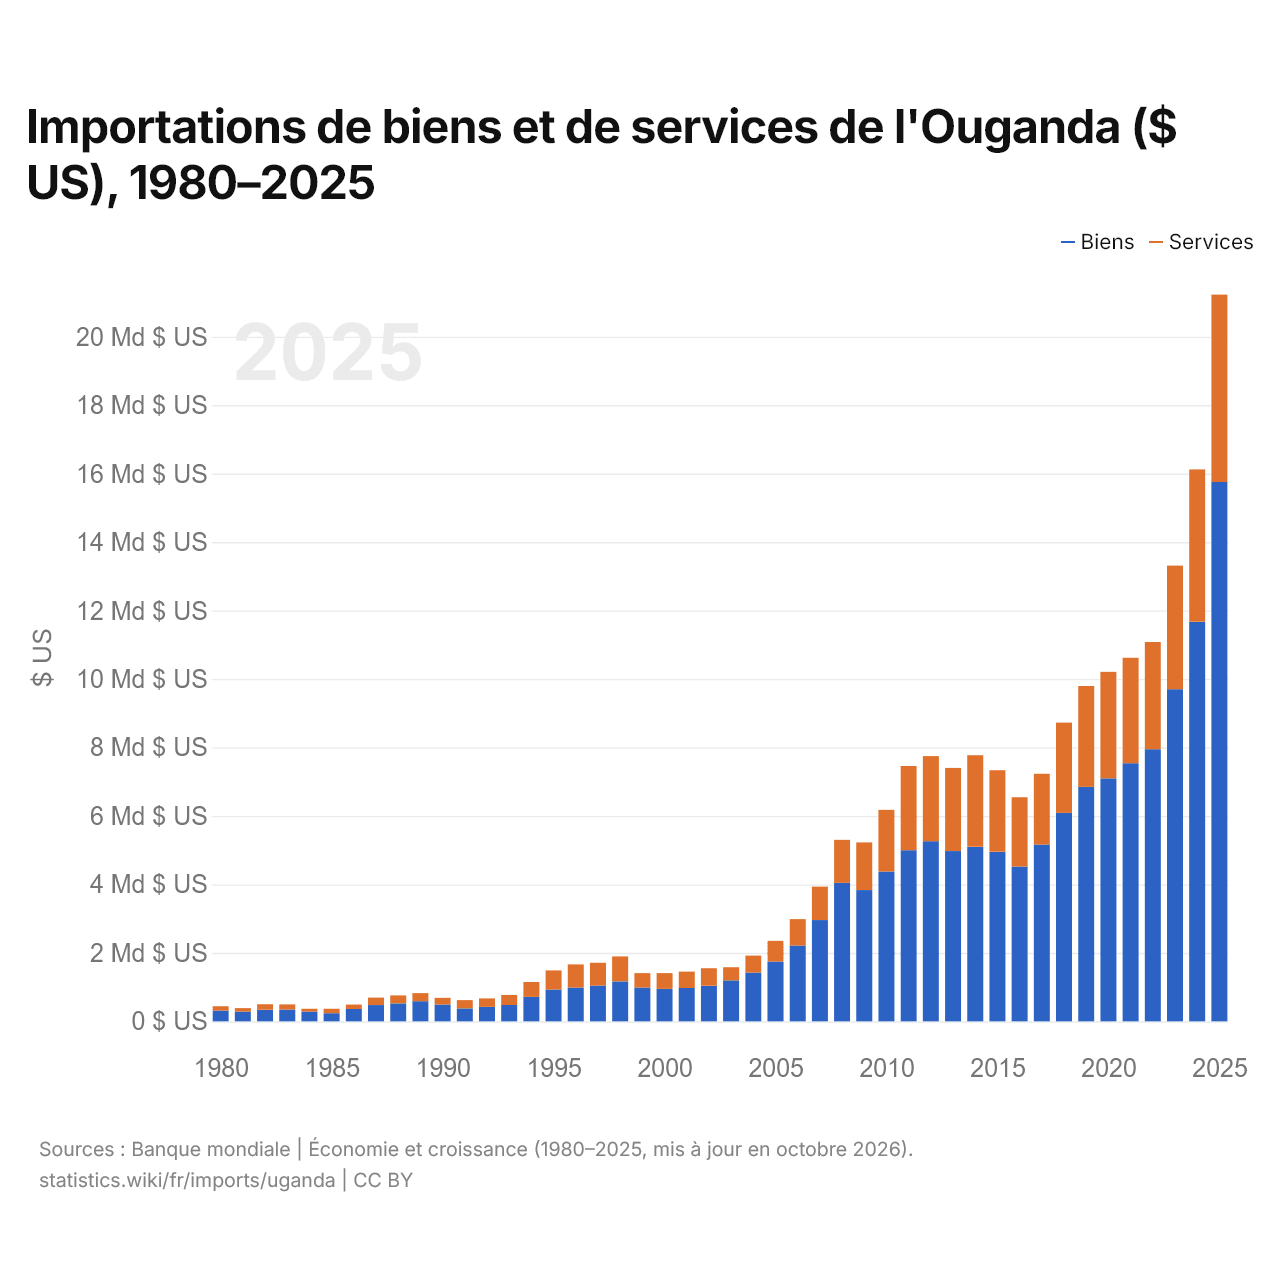
Importations de biens et de services de l'Ouganda ($ US), 1980–2025
| Année | $ US | |
|---|---|---|
| Biens | Services | |
| 2025 | 15 754 346 614 $ US | 5 471 847 455 $ US |
| 2024 | 11 674 103 403 $ US | 4 448 633 144 $ US |
| 2023 | 9 702 018 235 $ US | 3 610 627 289 $ US |
| 2022 | 7 947 236 322 $ US | 3 131 704 135 $ US |
| 2021 | 7 540 267 931 $ US | 3 079 721 010 $ US |
| 2020 | 7 098 121 798 $ US | 3 110 554 743 $ US |
| 2019 | 6 849 591 451 $ US | 2 944 808 942 $ US |
| 2018 | 6 089 658 328 $ US | 2 635 193 744 $ US |
| 2017 | 5 164 346 928 $ US | 2 067 053 621 $ US |
| 2016 | 4 518 348 322 $ US | 2 026 340 694 $ US |
| 2015 | 4 955 391 275 $ US | 2 378 314 839 $ US |
| 2014 | 5 099 616 713 $ US | 2 674 915 469 $ US |
| 2013 | 4 974 117 846 $ US | 2 427 639 999 $ US |
| 2012 | 5 261 545 011 $ US | 2 484 758 758 $ US |
| 2011 | 4 996 718 344 $ US | 2 462 864 296 $ US |
| 2010 | 4 375 690 952 $ US | 1 802 656 722 $ US |
| 2009 | 3 835 242 750 $ US | 1 392 951 691 $ US |
| 2008 | 4 042 765 531 $ US | 1 257 398 772 $ US |
| 2007 | 2 958 178 296 $ US | 977 237 682 $ US |
| 2006 | 2 215 576 096 $ US | 770 481 332 $ US |
| 2005 | 1 745 567 084 $ US | 604 522 090 $ US |
| 2004 | 1 426 754 848 $ US | 492 535 519 $ US |
| 2003 | 1 197 471 518 $ US | 381 212 892 $ US |
| 2002 | 1 040 755 111 $ US | 508 060 612 $ US |
| 2001 | 975 442 664 $ US | 479 316 172 $ US |
| 2000 | 949 700 000 $ US | 458 800 000 $ US |
| 1999 | 989 100 000 $ US | 419 200 000 $ US |
| 1998 | 1 166 340 000 $ US | 728 100 000 $ US |
| 1997 | 1 042 550 000 $ US | 668 870 000 $ US |
| 1996 | 986 890 000 $ US | 674 610 000 $ US |
| 1995 | 926 810 000 $ US | 562 710 000 $ US |
| 1994 | 714 200 000 $ US | 436 300 000 $ US |
| 1993 | 478 300 000 $ US | 293 110 000 $ US |
| 1992 | 421 900 000 $ US | 247 700 000 $ US |
| 1991 | 377 100 000 $ US | 241 800 000 $ US |
| 1990 | 491 000 000 $ US | 195 300 000 $ US |
| 1989 | 588 300 000 $ US | 237 200 000 $ US |
| 1988 | 523 500 000 $ US | 235 200 000 $ US |
| 1987 | 475 600 000 $ US | 218 200 000 $ US |
| 1986 | 360 900 000 $ US | 130 500 000 $ US |
| 1985 | 238 300 000 $ US | 129 900 000 $ US |
| 1984 | 286 800 000 $ US | 82 300 000 $ US |
| 1983 | 342 500 000 $ US | 150 000 000 $ US |
| 1982 | 337 600 000 $ US | 160 400 000 $ US |
| 1981 | 284 300 000 $ US | 100 400 000 $ US |
| 1980 | 317 600 000 $ US | 123 400 000 $ US |
En 2025, les importations de biens de l'Ouganda s'élevaient à 15,8 milliards de dollars et celles de services à 5,47 milliards de dollars ; les services représentaient 25,8 % du total, contre 28,0 % en 1980.
L'Ouganda dans le classement mondial des importations, 2025
| Rang | Pays | Importations | Part mondiale | |
|---|---|---|---|---|
| 93 |
 Paraguay |
19,4 Md $US | 0,06 % | |
| 94 |
 Uruguay |
19,3 Md $US | 0,06 % | |
| 95 |
Tanzanie
|
18,0 Md $US | 0,05 % | vs Tanzanie |
| 96 |
 Ouganda |
17,8 Md $US | 0,05 % | |
| 97 |
 Guinée |
17,6 Md $US | 0,05 % | |
| 98 |
 Bosnie-Herzégovine |
17,6 Md $US | 0,05 % | |
| 99 |
 Islande |
16,3 Md $US | 0,05 % |
Importations de biens et services de l'Ouganda, % du PIB, 1960–2025
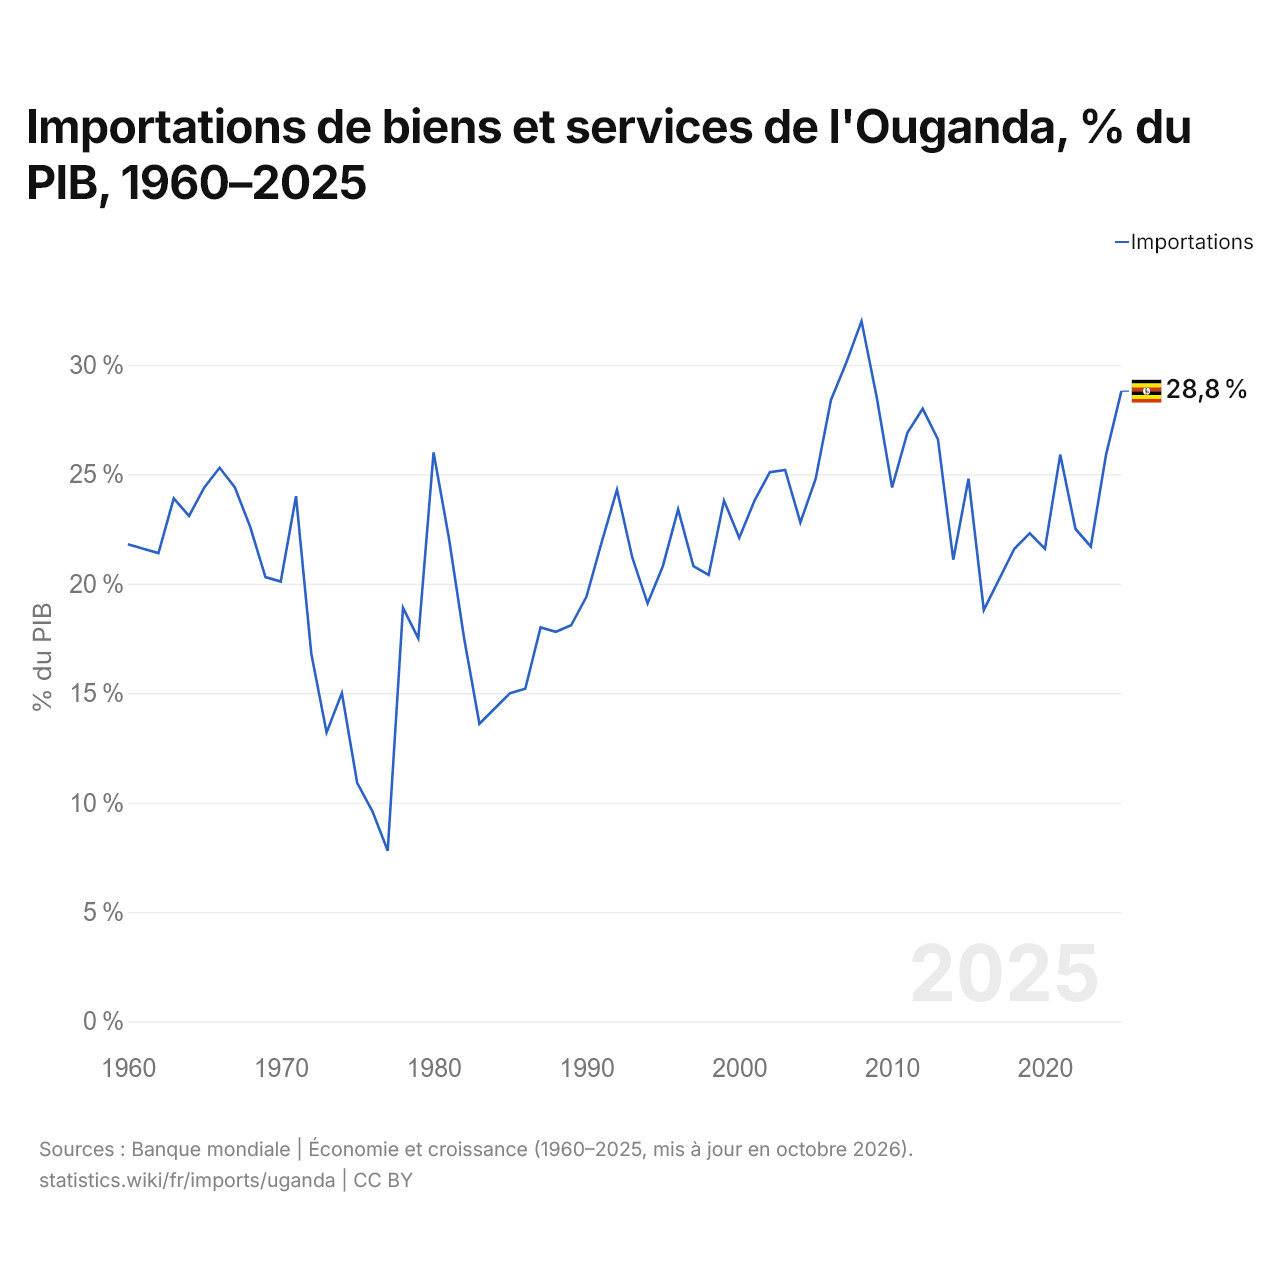
En 2025, les importations de biens et services de l'Ouganda équivalaient à 28,8 % de son PIB, contre 21,8 % en 1960. La part la plus élevée a été de 32,0 %, en 2008.
Comparer les importations de l'Ouganda avec celles d'autres pays
Sources :
- Banque mondiale | Économie et croissance (1960–2025, mis à jour en octobre 2026)
- TradeMap (2001–2025, mis à jour en octobre 2026)
Creative Commons Attribution (CC BY) : vous pouvez copier, partager, adapter et réutiliser ce contenu, y compris à des fins commerciales, à condition de citer statistics.wiki et d’indiquer les modifications apportées. Les sources citées ci-dessus peuvent avoir leurs propres conditions de licence.