
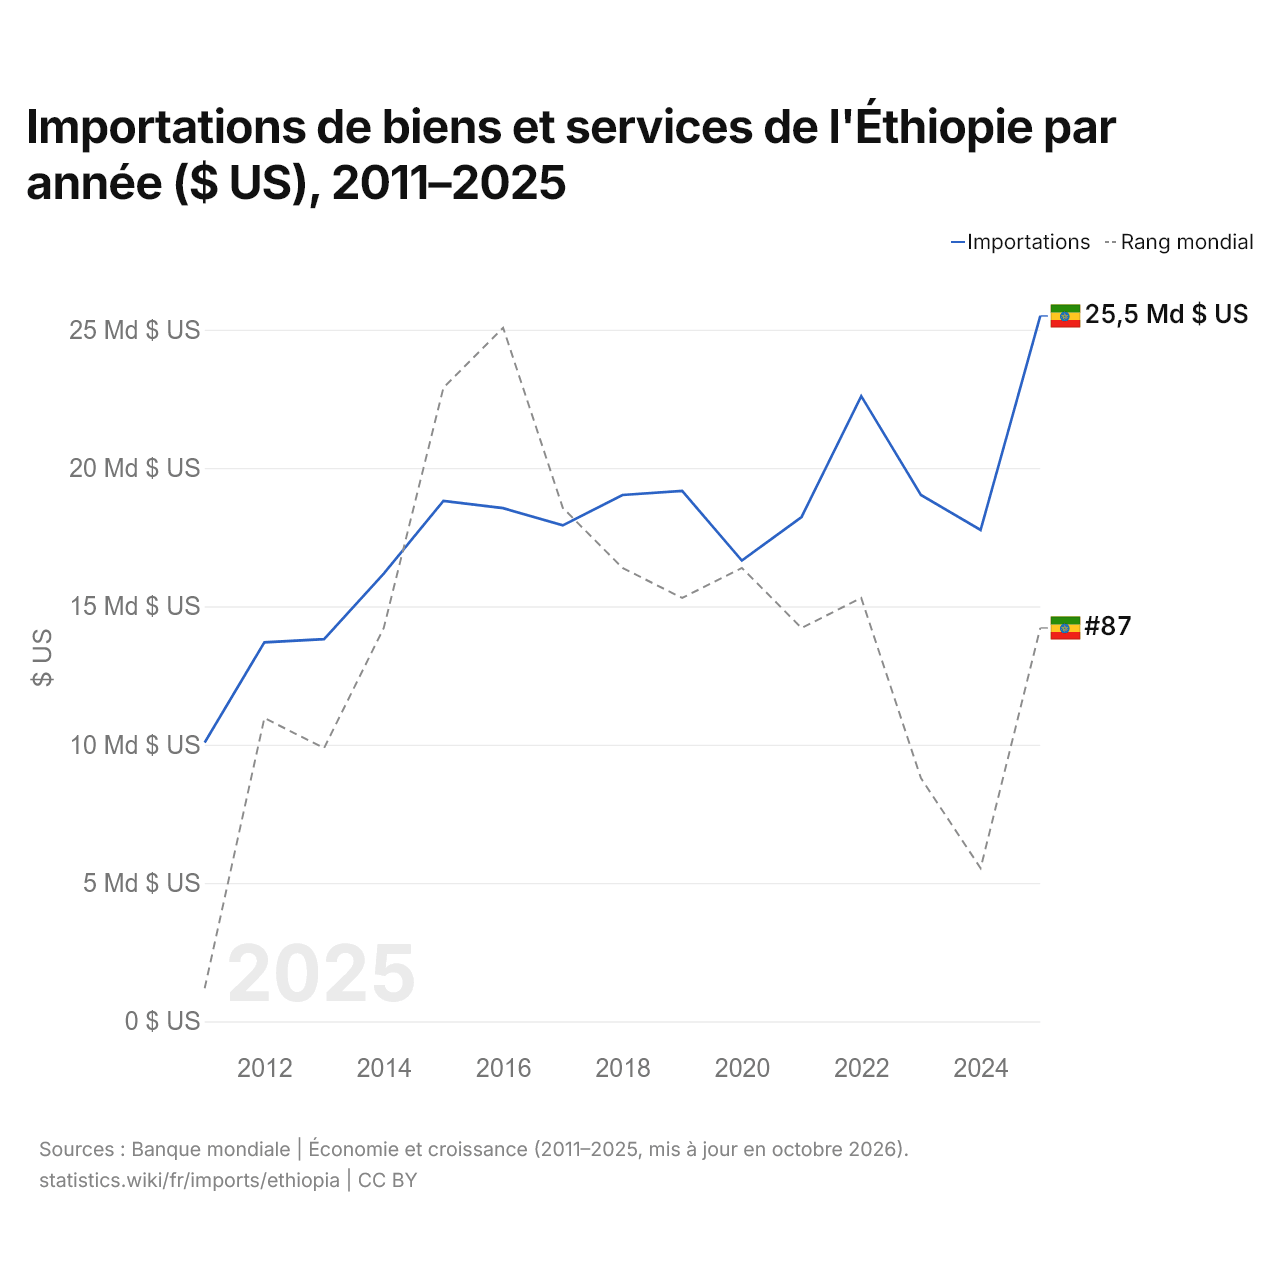
Importations de biens et services de l'Éthiopie par année ($ US), 2011–2025
| Année | $ US | Rang mondial |
|---|---|---|
| Importations | Rang mondial | |
| 2025 | 25 494 178 576 $ US | #87 |
| 2024 | 17 760 943 867 $ US | #95 |
| 2023 | 19 025 475 348 $ US | #92 |
| 2022 | 22 598 141 428 $ US | #86 |
| 2021 | 18 229 409 472 $ US | #87 |
| 2020 | 16 655 574 515 $ US | #85 |
| 2019 | 19 170 757 495 $ US | #86 |
| 2018 | 19 023 285 015 $ US | #85 |
| 2017 | 17 926 383 871 $ US | #83 |
| 2016 | 18 548 030 817 $ US | #77 |
| 2015 | 18 812 870 813 $ US | #79 |
| 2014 | 16 182 860 468 $ US | #87 |
| 2013 | 13 812 145 920 $ US | #91 |
| 2012 | 13 699 443 640 $ US | #90 |
| 2011 | 10 079 844 913 $ US | #99 |
En 2025, les importations de biens et services de l'Éthiopie s'élevaient à 25,5 milliards de dollars, contre 10,1 milliards de dollars en 2011. Elles se classaient au 87e rang mondial, en hausse par rapport au 95e rang en 2024. Leur meilleur rang a été le 77e, occupé pour la dernière fois en 2016.
En 2025, les importations de biens et services de l'Éthiopie étaient les 10es plus élevées de 50 pays situés en Afrique. En 2025, les importations de l'Éthiopie dépassaient ses exportations de 8,71 milliards de dollars, soit un déficit commercial. Le commerce de l'Éthiopie, exportations et importations réunies, équivalait à 33,5 % de son PIB en 2025, au 164e rang mondial.
Importations de biens de l'Éthiopie par catégorie
Importations de biens, 2023: 17,0 Md $US
La première catégorie des importations de biens de l'Éthiopie est « machines, électronique et véhicules », avec 30,4 %, suivie de « pétrole, gaz, minerais et autres matières premières », avec 24,8 %.
Origines des importations de biens de l'Éthiopie : les 10 premières
| Rang | Pays | Importations de biens | Part | |
|---|---|---|---|---|
| 1 |
 Chine |
5,57 Md $US | 32,7 % | |
| 2 |
 Inde |
1,64 Md $US | 9,61 % | vs Inde |
| 3 |
 Koweït |
1,33 Md $US | 7,79 % | |
| 4 |
 Arabie saoudite |
1,13 Md $US | 6,62 % | vs Arabie saoudite |
| 5 |
 États-Unis |
1,08 Md $US | 6,34 % | |
| 6 |
 Maroc |
676 M $US | 3,97 % | vs Maroc |
| 7 |
 Turquie |
619 M $US | 3,64 % | |
| 8 |
 EAU |
472 M $US | 2,77 % | |
| 9 |
 Égypte |
454 M $US | 2,67 % | vs Égypte |
| 10 |
 Japon |
382 M $US | 2,24 % | |
| Autres partenaires et non précisés | 3,69 Md $US | 21,7 % |
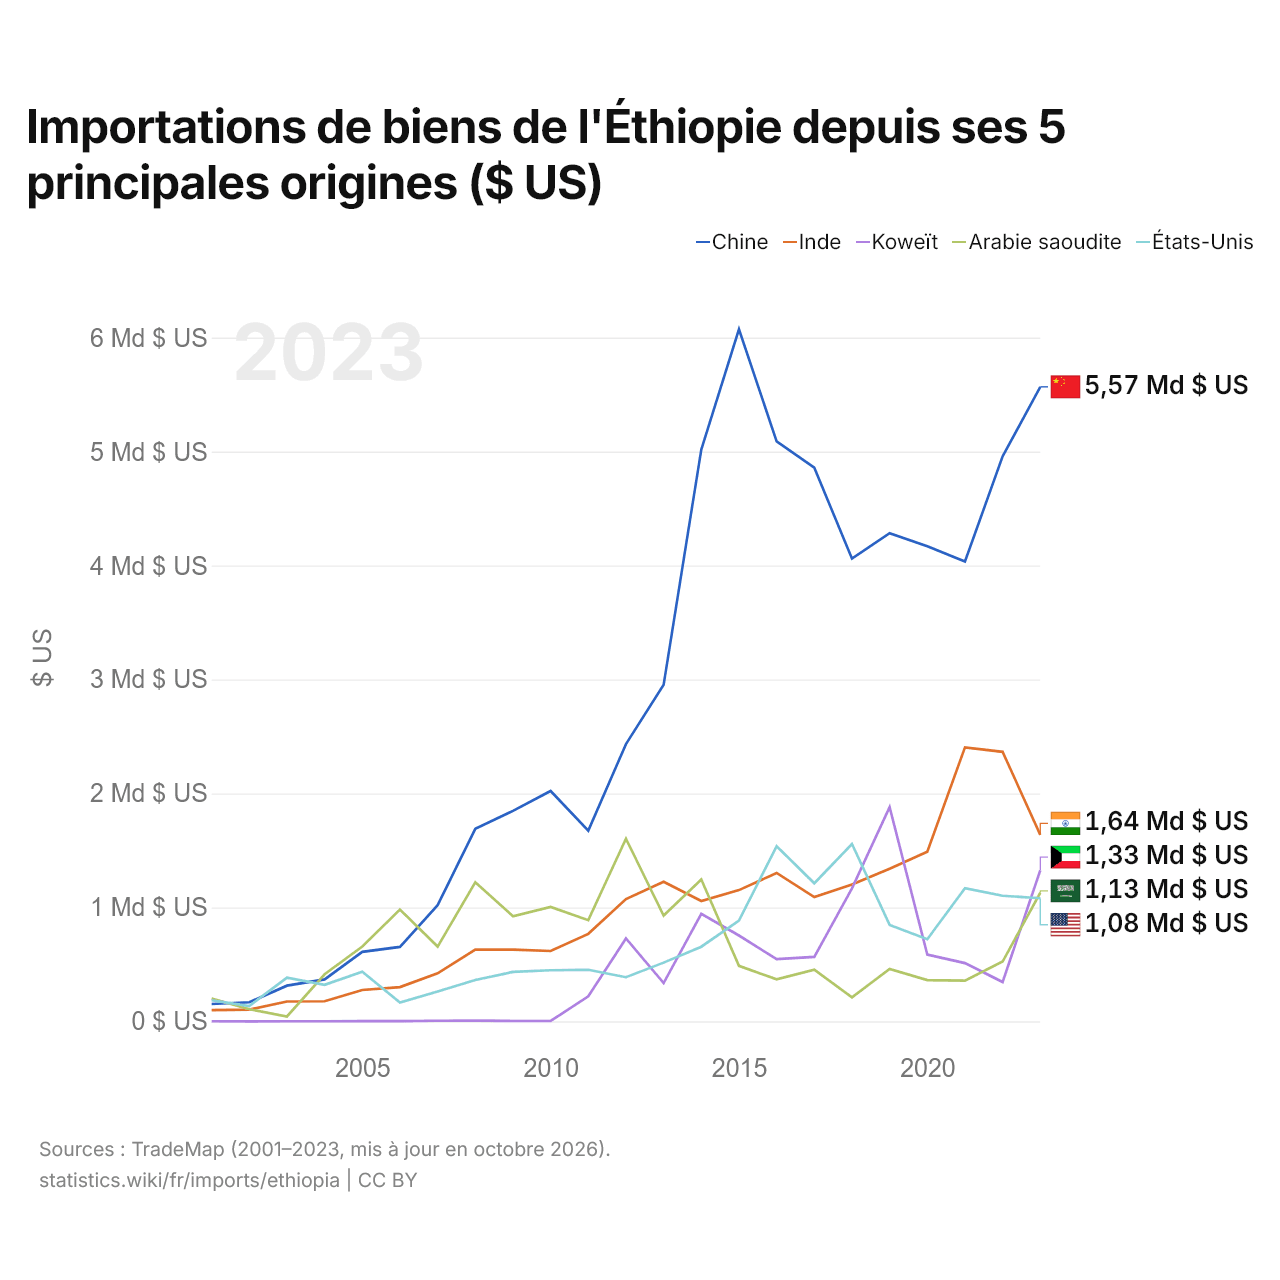
Importations de biens de l'Éthiopie depuis ses 5 principales origines ($ US)
| Année | $ US | ||||
|---|---|---|---|---|---|
| Chine | Inde | Koweït | Arabie saoudite | États-Unis | |
| 2023 | 5 567 885 000 $ US | 1 636 451 000 $ US | 1 326 334 000 $ US | 1 128 294 000 $ US | 1 080 026 000 $ US |
| 2022 | 4 957 722 000 $ US | 2 364 927 000 $ US | 344 835 000 $ US | 524 645 000 $ US | 1 102 365 000 $ US |
| 2021 | 4 035 057 000 $ US | 2 403 950 000 $ US | 511 139 000 $ US | 357 396 000 $ US | 1 168 345 000 $ US |
| 2020 | 4 169 613 000 $ US | 1 489 056 000 $ US | 585 872 000 $ US | 361 985 000 $ US | 720 487 000 $ US |
| 2019 | 4 283 703 000 $ US | 1 339 549 000 $ US | 1 880 358 000 $ US | 460 030 000 $ US | 846 154 000 $ US |
| 2018 | 4 060 679 000 $ US | 1 200 700 000 $ US | 1 167 388 000 $ US | 209 947 000 $ US | 1 556 646 000 $ US |
| 2017 | 4 858 471 000 $ US | 1 090 717 000 $ US | 565 457 000 $ US | 452 866 000 $ US | 1 211 235 000 $ US |
| 2016 | 5 088 933 000 $ US | 1 301 920 000 $ US | 545 696 000 $ US | 368 790 000 $ US | 1 536 832 000 $ US |
| 2015 | 6 073 161 000 $ US | 1 151 499 000 $ US | 753 143 000 $ US | 486 862 000 $ US | 884 023 000 $ US |
| 2014 | 5 018 119 000 $ US | 1 056 107 000 $ US | 942 538 000 $ US | 1 245 329 000 $ US | 654 989 000 $ US |
| 2013 | 2 952 993 000 $ US | 1 224 650 000 $ US | 335 855 000 $ US | 928 629 000 $ US | 515 162 000 $ US |
| 2012 | 2 432 872 000 $ US | 1 072 742 000 $ US | 727 405 000 $ US | 1 603 090 000 $ US | 386 954 000 $ US |
| 2011 | 1 673 884 000 $ US | 767 686 000 $ US | 219 763 000 $ US | 887 728 000 $ US | 452 912 000 $ US |
| 2010 | 2 021 718 000 $ US | 617 223 000 $ US | 3 001 000 $ US | 1 004 096 000 $ US | 448 438 000 $ US |
| 2009 | 1 847 108 000 $ US | 629 921 000 $ US | 3 138 000 $ US | 922 342 000 $ US | 434 019 000 $ US |
| 2008 | 1 688 878 000 $ US | 630 450 000 $ US | 6 050 000 $ US | 1 220 423 000 $ US | 362 180 000 $ US |
| 2007 | 1 019 906 000 $ US | 421 299 000 $ US | 4 965 000 $ US | 655 946 000 $ US | 262 029 000 $ US |
| 2006 | 653 259 000 $ US | 300 654 000 $ US | 1 551 000 $ US | 980 970 000 $ US | 164 903 000 $ US |
| 2005 | 610 085 000 $ US | 274 706 000 $ US | 1 533 000 $ US | 656 183 000 $ US | 435 589 000 $ US |
| 2004 | 367 756 000 $ US | 176 366 000 $ US | 389 000 $ US | 412 862 000 $ US | 320 279 000 $ US |
| 2003 | 313 072 000 $ US | 174 348 000 $ US | 399 000 $ US | 42 901 000 $ US | 383 992 000 $ US |
| 2002 | 167 435 000 $ US | 102 349 000 $ US | 251 000 $ US | 106 389 000 $ US | 134 442 000 $ US |
| 2001 | 152 070 000 $ US | 98 910 000 $ US | 1 077 000 $ US | 200 250 000 $ US | 185 292 000 $ US |
Les importations de biens s'élèvent à 5,57 milliards de dollars en provenance de la Chine (2023), 1,64 milliard de dollars en provenance de l'Inde (2023), 1,33 milliard de dollars en provenance du Koweït (2023), 1,13 milliard de dollars en provenance de l'Arabie saoudite (2023) et 1,08 milliard de dollars en provenance des États-Unis (2023). Le premier rang des cinq fournisseurs de l'Éthiopie est occupé par la Chine depuis 2007. Le changement le plus récent dans leur ordre remonte à 2023, quand les importations de l'Éthiopie en provenance du Koweït ont dépassé celles en provenance de l'Arabie saoudite.
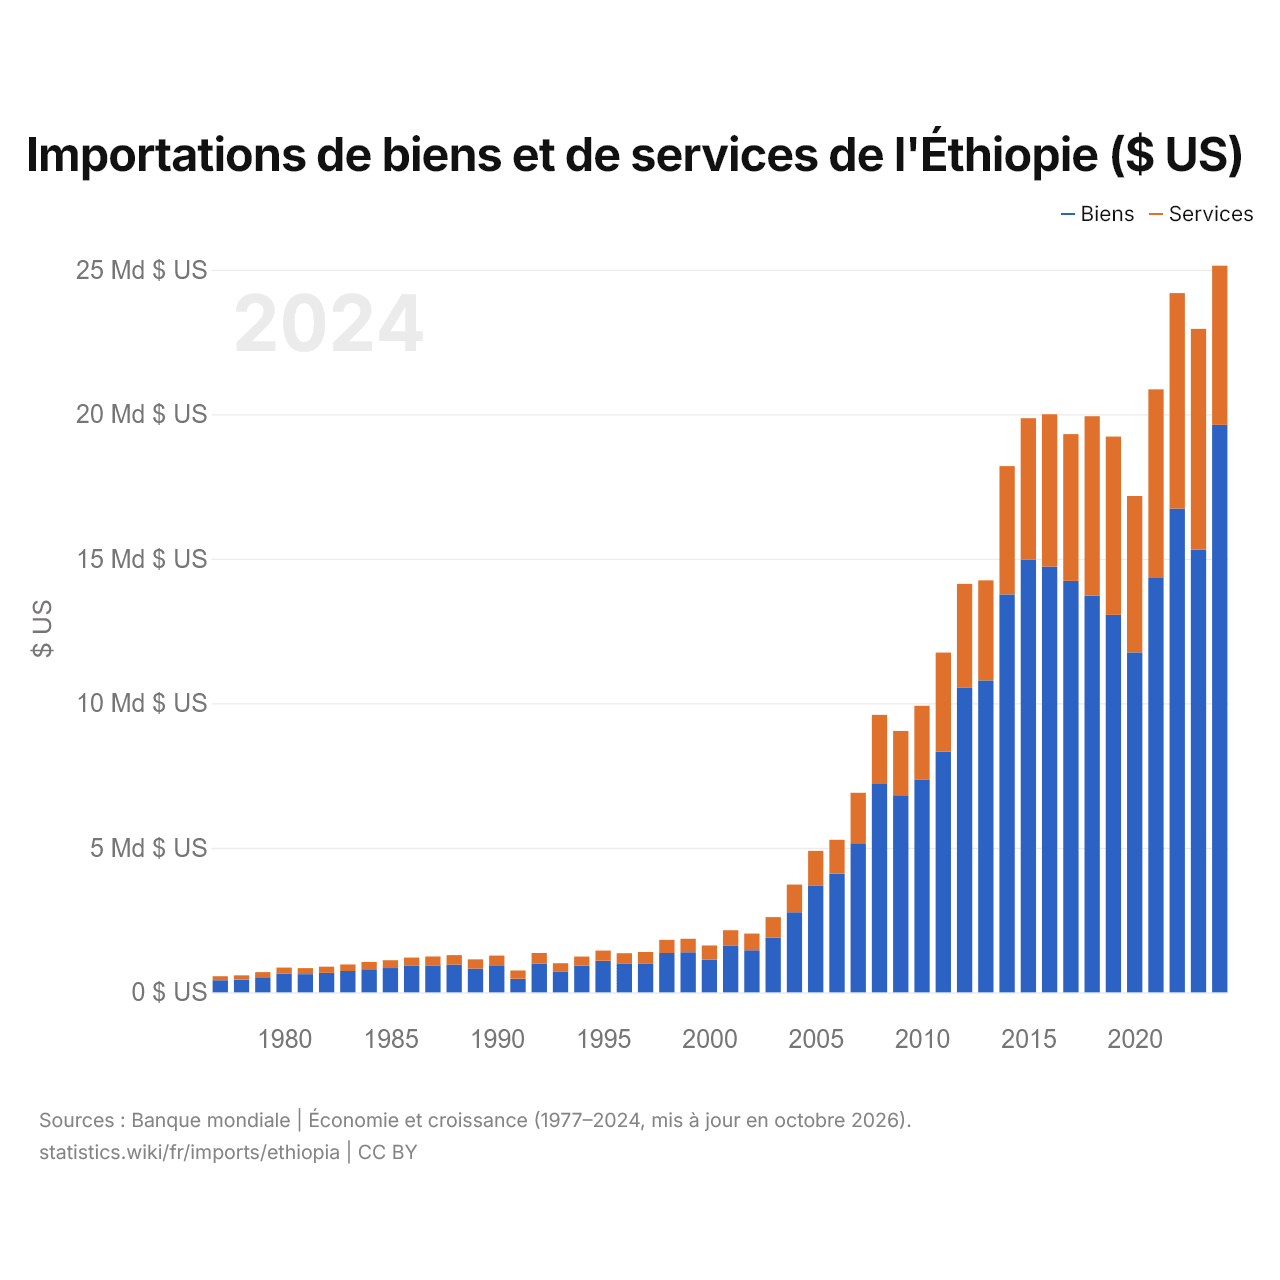
Importations de biens et de services de l'Éthiopie ($ US)
| Année | $ US | |
|---|---|---|
| Biens | Services | |
| 2024 | 19 631 900 695 $ US | 5 506 156 286 $ US |
| 2023 | 15 318 231 310 $ US | 7 633 267 994 $ US |
| 2022 | 16 735 042 473 $ US | 7 452 196 198 $ US |
| 2021 | 14 333 178 334 $ US | 6 526 048 194 $ US |
| 2020 | 11 762 035 599 $ US | 5 407 636 703 $ US |
| 2019 | 13 056 290 055 $ US | 6 170 926 072 $ US |
| 2018 | 13 725 751 702 $ US | 6 203 130 844 $ US |
| 2017 | 14 236 074 619 $ US | 5 074 361 081 $ US |
| 2016 | 14 728 090 322 $ US | 5 268 705 031 $ US |
| 2015 | 14 976 930 462 $ US | 4 883 862 669 $ US |
| 2014 | 13 768 140 261 $ US | 4 435 677 335 $ US |
| 2013 | 10 790 783 648 $ US | 3 460 458 450 $ US |
| 2012 | 10 547 290 512 $ US | 3 582 647 188 $ US |
| 2011 | 8 328 868 376 $ US | 3 425 697 837 $ US |
| 2010 | 7 364 532 216 $ US | 2 550 105 172 $ US |
| 2009 | 6 819 049 914 $ US | 2 223 796 381 $ US |
| 2008 | 7 206 330 459 $ US | 2 391 598 702 $ US |
| 2007 | 5 155 645 100 $ US | 1 748 881 495 $ US |
| 2006 | 4 105 569 045 $ US | 1 170 553 122 $ US |
| 2005 | 3 700 858 390 $ US | 1 193 830 180 $ US |
| 2004 | 2 768 484 390 $ US | 958 289 177 $ US |
| 2003 | 1 895 034 034 $ US | 708 671 637 $ US |
| 2002 | 1 454 996 526 $ US | 578 741 959 $ US |
| 2001 | 1 625 806 987 $ US | 521 522 803 $ US |
| 2000 | 1 131 380 361 $ US | 489 601 051 $ US |
| 1999 | 1 387 160 488 $ US | 466 315 813 $ US |
| 1998 | 1 359 792 497 $ US | 455 557 583 $ US |
| 1997 | 1 001 632 093 $ US | 394 227 785 $ US |
| 1996 | 1 002 801 348 $ US | 349 755 350 $ US |
| 1995 | 1 092 783 282 $ US | 352 843 234 $ US |
| 1994 | 925 650 167 $ US | 310 411 854 $ US |
| 1993 | 705 980 000 $ US | 299 020 000 $ US |
| 1992 | 992 746 763 $ US | 368 259 614 $ US |
| 1991 | 470 821 256 $ US | 284 347 826 $ US |
| 1990 | 912 077 295 $ US | 358 840 580 $ US |
| 1989 | 817 874 396 $ US | 323 381 643 $ US |
| 1988 | 956 038 647 $ US | 330 096 618 $ US |
| 1987 | 932 657 005 $ US | 307 681 159 $ US |
| 1986 | 932 560 386 $ US | 271 739 130 $ US |
| 1985 | 840 531 401 $ US | 270 772 947 $ US |
| 1984 | 798 357 488 $ US | 252 608 696 $ US |
| 1983 | 739 951 691 $ US | 224 830 918 $ US |
| 1982 | 675 217 392 $ US | 212 367 150 $ US |
| 1981 | 629 758 454 $ US | 206 570 048 $ US |
| 1980 | 649 613 527 $ US | 208 260 870 $ US |
| 1979 | 522 850 242 $ US | 175 265 701 $ US |
| 1978 | 436 473 430 $ US | 151 111 111 $ US |
| 1977 | 416 956 522 $ US | 139 468 599 $ US |
Les importations de biens de l'Éthiopie s'élèvent à 19,6 milliards de dollars (2024) et celles de services à 5,51 milliards de dollars ; les services représentent 21,9 % du total, contre 25,1 % en 1977.
L'Éthiopie dans le classement mondial des importations, 2025
| Rang | Pays | Importations | Part mondiale | |
|---|---|---|---|---|
| 84 |
 Ghana |
28,2 Md $US (2024) | 0,09 % | |
| 85 |
 Azerbaïdjan |
28,0 Md $US | 0,08 % | |
| 86 |
 Malte |
27,7 Md $US | 0,08 % | |
| 87 |
 Éthiopie |
25,5 Md $US | 0,08 % | |
| 88 |
 Sri Lanka |
24,9 Md $US | 0,07 % | |
| 89 |
 Côte d’Ivoire |
24,7 Md $US | 0,07 % | |
| 90 |
 Honduras |
22,4 Md $US | 0,07 % |
Importations de biens et services de l'Éthiopie, % du PIB, 2011–2025
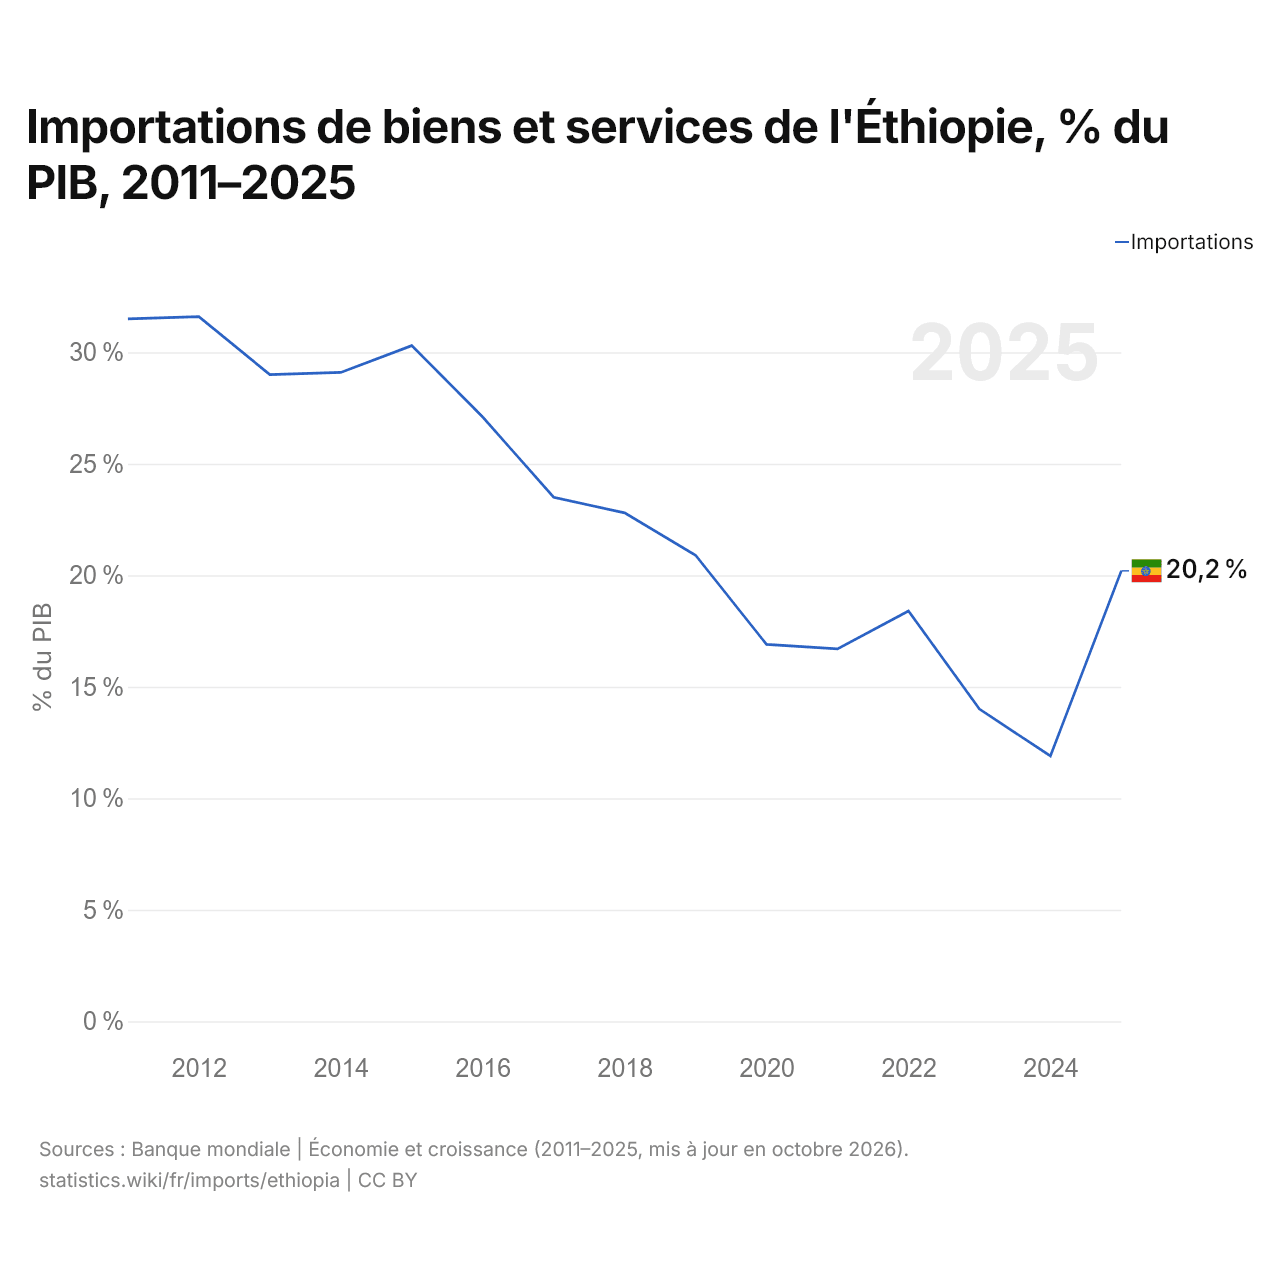
En 2025, les importations de biens et services de l'Éthiopie équivalaient à 20,2 % de son PIB, contre 31,5 % en 2011. La part la plus élevée a été de 31,6 %, en 2012.
Comparer les importations de l'Éthiopie avec celles d'autres pays
Sources :
- TradeMap (2001–2023, mis à jour en octobre 2026)
- Banque mondiale | Économie et croissance (1977–2025, mis à jour en octobre 2026)
Creative Commons Attribution (CC BY) : vous pouvez copier, partager, adapter et réutiliser ce contenu, y compris à des fins commerciales, à condition de citer statistics.wiki et d’indiquer les modifications apportées. Les sources citées ci-dessus peuvent avoir leurs propres conditions de licence.