
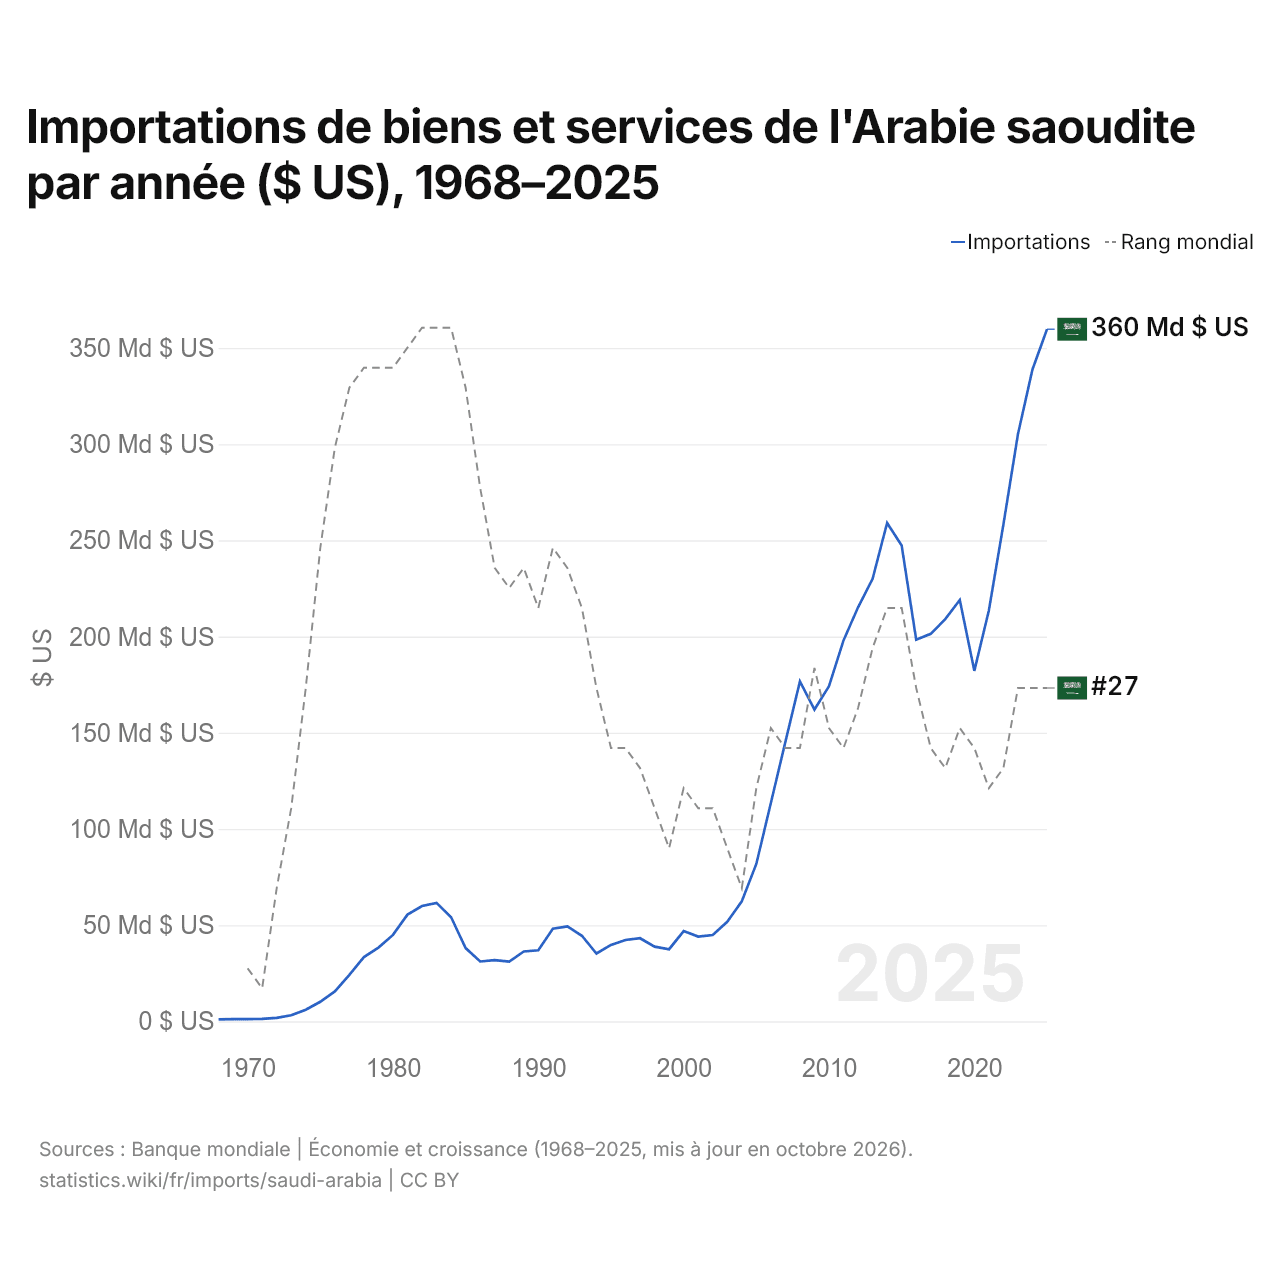
Importations de biens et services de l'Arabie saoudite par année ($ US), 1968–2025
| Année | $ US | Rang mondial |
|---|---|---|
| Importations | Rang mondial | |
| 2025 | 359 757 600 000 $ US | #27 |
| 2024 | 338 830 400 000 $ US | #27 |
| 2023 | 305 152 000 000 $ US | #27 |
| 2022 | 258 212 800 000 $ US | #31 |
| 2021 | 213 515 200 000 $ US | #32 |
| 2020 | 182 183 733 333 $ US | #30 |
| 2019 | 218 974 666 667 $ US | #29 |
| 2018 | 209 069 066 667 $ US | #31 |
| 2017 | 201 397 866 667 $ US | #30 |
| 2016 | 198 364 800 000 $ US | #27 |
| 2015 | 247 307 200 000 $ US | #23 |
| 2014 | 259 006 933 333 $ US | #23 |
| 2013 | 229 995 200 000 $ US | #25 |
| 2012 | 215 206 133 333 $ US | #28 |
| 2011 | 197 977 600 000 $ US | #30 |
| 2010 | 174 202 666 667 $ US | #29 |
| 2009 | 162 069 066 667 $ US | #26 |
| 2008 | 176 684 800 000 $ US | #30 |
| 2007 | 145 279 252 835 $ US | #30 |
| 2006 | 113 494 793 057 $ US | #29 |
| 2005 | 81 797 389 982 $ US | #32 |
| 2004 | 62 350 400 000 $ US | #37 |
| 2003 | 51 744 266 667 $ US | #35 |
| 2002 | 44 830 400 000 $ US | #33 |
| 2001 | 44 058 400 000 $ US | #33 |
| 2000 | 46 926 133 333 $ US | #32 |
| 1999 | 37 485 333 333 $ US | #35 |
| 1998 | 38 830 933 333 $ US | #33 |
| 1997 | 43 199 465 955 $ US | #31 |
| 1996 | 42 253 404 539 $ US | #30 |
| 1995 | 39 711 615 487 $ US | #30 |
| 1994 | 35 240 587 450 $ US | #27 |
| 1993 | 44 483 311 081 $ US | #23 |
| 1992 | 49 331 375 167 $ US | #21 |
| 1991 | 48 117 222 964 $ US | #20 |
| 1990 | 36 904 405 874 $ US | #23 |
| 1989 | 36 304 672 897 $ US | #21 |
| 1988 | 31 068 624 833 $ US | #22 |
| 1987 | 31 821 094 793 $ US | #21 |
| 1986 | 31 120 442 884 $ US | #17 |
| 1985 | 38 070 679 183 $ US | #12 |
| 1984 | 54 097 332 577 $ US | #9 |
| 1983 | 61 584 659 913 $ US | #9 |
| 1982 | 59 945 084 420 $ US | #9 |
| 1981 | 55 459 144 516 $ US | #10 |
| 1980 | 44 919 924 659 $ US | #11 |
| 1979 | 38 304 743 729 $ US | #11 |
| 1978 | 33 389 007 172 $ US | #11 |
| 1977 | 24 156 717 678 $ US | #12 |
| 1976 | 15 522 379 603 $ US | #15 |
| 1975 | 10 165 134 756 $ US | #20 |
| 1974 | 5 995 492 958 $ US | #27 |
| 1973 | 3 126 324 499 $ US | #33 |
| 1972 | 1 765 847 084 $ US | #37 |
| 1971 | 1 287 323 408 $ US | #42 |
| 1970 | 1 159 555 556 $ US | #41 |
| 1969 | 1 118 868 489 $ US | - |
| 1968 | 1 035 019 956 $ US | - |
En 2025, les importations de biens et services de l'Arabie saoudite s'élevaient à 360 milliards de dollars, contre 1,04 milliard de dollars en 1968. Elles se classaient au 27e rang mondial, un rang qu'elles occupent depuis 2023. Leur meilleur rang a été le 9e, occupé pour la dernière fois en 1984.
En 2025, les importations de biens et services de l'Arabie saoudite étaient les 11es plus élevées de 44 pays situés en Asie. En 2025, les exportations de l'Arabie saoudite dépassaient ses importations de 20,1 milliards de dollars, soit un excédent commercial. Le commerce de l'Arabie saoudite, exportations et importations réunies, équivalait à 57,9 % de son PIB en 2025, au 122e rang mondial.
Importations de biens de l'Arabie saoudite par catégorie, 2025
Importations de biens, 2025: 252 Md $US
En 2025, la première catégorie des importations de biens de l'Arabie saoudite était « machines, électronique et véhicules », avec 45,4 %, suivie de « produits chimiques, pharmaceutiques et plastiques », avec 10,1 %.
Origines des importations de biens de l'Arabie saoudite : les 10 premières, 2025
| Rang | Pays | Importations de biens | Part | |
|---|---|---|---|---|
| 1 |
 Chine |
69,0 Md $US | 27,4 % | vs Chine |
| 2 |
 États-Unis |
21,0 Md $US | 8,32 % | vs USA |
| 3 |
 EAU |
14,4 Md $US | 5,7 % | vs EAU |
| 4 |
 Inde |
12,1 Md $US | 4,8 % | vs Inde |
| 5 |
 Allemagne |
11,2 Md $US | 4,43 % | vs Allemagne |
| 6 |
 Japon |
10,2 Md $US | 4,04 % | vs Japon |
| 7 |
 Italie |
8,17 Md $US | 3,24 % | |
| 8 |
 France |
7,00 Md $US | 2,78 % | vs France |
| 9 |
 Suisse |
6,67 Md $US | 2,64 % | vs Suisse |
| 10 |
 Égypte |
6,60 Md $US | 2,62 % | vs Égypte |
| Autres partenaires et non précisés | 85,9 Md $US | 34,1 % |
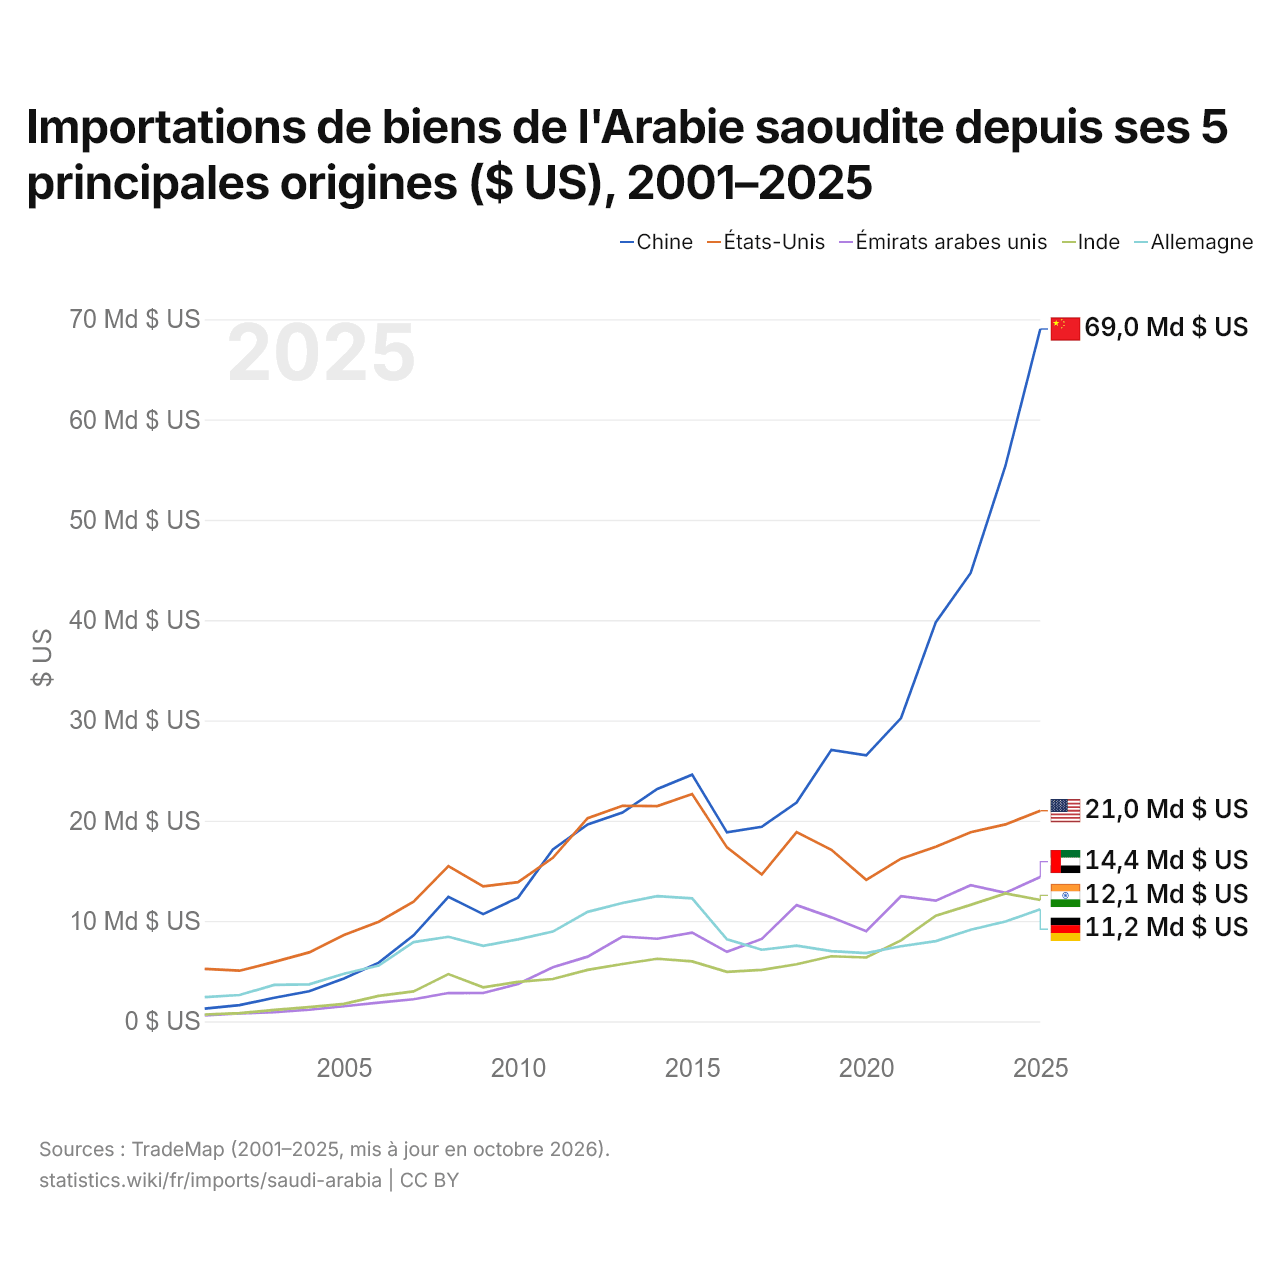
Importations de biens de l'Arabie saoudite depuis ses 5 principales origines ($ US), 2001–2025
| Année | $ US | ||||
|---|---|---|---|---|---|
| Chine | États-Unis | Émirats arabes unis | Inde | Allemagne | |
| 2025 | 69 025 950 000 $ US | 20 996 615 000 $ US | 14 388 409 000 $ US | 12 097 189 000 $ US | 11 173 881 000 $ US |
| 2024 | 55 393 521 000 $ US | 19 634 144 000 $ US | 12 818 311 000 $ US | 12 754 773 000 $ US | 9 947 983 000 $ US |
| 2023 | 44 699 573 000 $ US | 18 860 684 000 $ US | 13 566 152 000 $ US | 11 611 846 000 $ US | 9 134 203 000 $ US |
| 2022 | 39 800 511 000 $ US | 17 401 432 000 $ US | 12 027 614 000 $ US | 10 535 867 000 $ US | 8 000 118 000 $ US |
| 2021 | 30 234 933 000 $ US | 16 216 576 000 $ US | 12 471 997 000 $ US | 8 073 815 000 $ US | 7 491 415 000 $ US |
| 2020 | 26 509 227 000 $ US | 14 103 515 000 $ US | 8 980 437 000 $ US | 6 367 017 000 $ US | 6 809 087 000 $ US |
| 2019 | 27 066 620 000 $ US | 17 097 398 000 $ US | 10 364 589 000 $ US | 6 489 007 000 $ US | 7 003 813 000 $ US |
| 2018 | 21 819 004 000 $ US | 18 863 744 000 $ US | 11 584 348 000 $ US | 5 685 985 000 $ US | 7 548 370 000 $ US |
| 2017 | 19 391 019 000 $ US | 14 636 694 000 $ US | 8 215 702 000 $ US | 5 131 997 000 $ US | 7 135 435 000 $ US |
| 2016 | 18 840 789 000 $ US | 17 342 441 000 $ US | 6 929 715 000 $ US | 4 932 353 000 $ US | 8 181 060 000 $ US |
| 2015 | 24 595 194 000 $ US | 22 667 672 000 $ US | 8 840 394 000 $ US | 5 977 970 000 $ US | 12 258 584 000 $ US |
| 2014 | 23 167 501 000 $ US | 21 460 512 000 $ US | 8 235 808 000 $ US | 6 238 181 000 $ US | 12 478 842 000 $ US |
| 2013 | 20 807 217 000 $ US | 21 493 599 000 $ US | 8 457 173 000 $ US | 5 720 071 000 $ US | 11 801 955 000 $ US |
| 2012 | 19 635 041 000 $ US | 20 254 190 000 $ US | 6 449 807 000 $ US | 5 125 704 000 $ US | 10 914 030 000 $ US |
| 2011 | 17 134 231 000 $ US | 16 306 467 000 $ US | 5 393 681 000 $ US | 4 221 937 000 $ US | 8 948 547 000 $ US |
| 2010 | 12 336 693 000 $ US | 13 881 719 000 $ US | 3 730 914 000 $ US | 3 931 033 000 $ US | 8 170 000 000 $ US |
| 2009 | 10 690 184 000 $ US | 13 460 370 000 $ US | 2 827 554 000 $ US | 3 391 342 000 $ US | 7 527 494 000 $ US |
| 2008 | 12 414 046 000 $ US | 15 481 046 000 $ US | 2 820 259 000 $ US | 4 710 305 000 $ US | 8 432 227 000 $ US |
| 2007 | 8 575 244 000 $ US | 11 930 802 000 $ US | 2 197 846 000 $ US | 2 980 351 000 $ US | 7 898 530 000 $ US |
| 2006 | 5 847 153 000 $ US | 9 933 234 000 $ US | 1 861 951 000 $ US | 2 539 572 000 $ US | 5 559 008 000 $ US |
| 2005 | 4 278 883 000 $ US | 8 614 377 000 $ US | 1 502 702 000 $ US | 1 743 923 000 $ US | 4 739 556 000 $ US |
| 2004 | 2 996 565 000 $ US | 6 874 076 000 $ US | 1 158 354 000 $ US | 1 409 782 000 $ US | 3 685 679 000 $ US |
| 2003 | 2 346 396 000 $ US | 5 927 678 000 $ US | 924 951 000 $ US | 1 142 803 000 $ US | 3 631 995 000 $ US |
| 2002 | 1 617 089 000 $ US | 5 048 952 000 $ US | 777 295 000 $ US | 812 198 000 $ US | 2 627 407 000 $ US |
| 2001 | 1 266 732 000 $ US | 5 236 407 000 $ US | 594 753 000 $ US | 684 092 000 $ US | 2 406 628 000 $ US |
En 2025, les importations de biens s'élevaient à 69 milliards de dollars en provenance de la Chine, 21 milliards de dollars en provenance des États-Unis, 14,4 milliards de dollars en provenance des Émirats arabes unis, 12,1 milliards de dollars en provenance de l'Inde et 11,2 milliards de dollars en provenance de l'Allemagne. Le premier rang des cinq fournisseurs de l'Arabie saoudite est occupé par la Chine depuis 2014. Le changement le plus récent dans leur ordre remonte à 2021, quand les importations de l'Arabie saoudite en provenance de l'Inde ont dépassé celles en provenance de l'Allemagne.
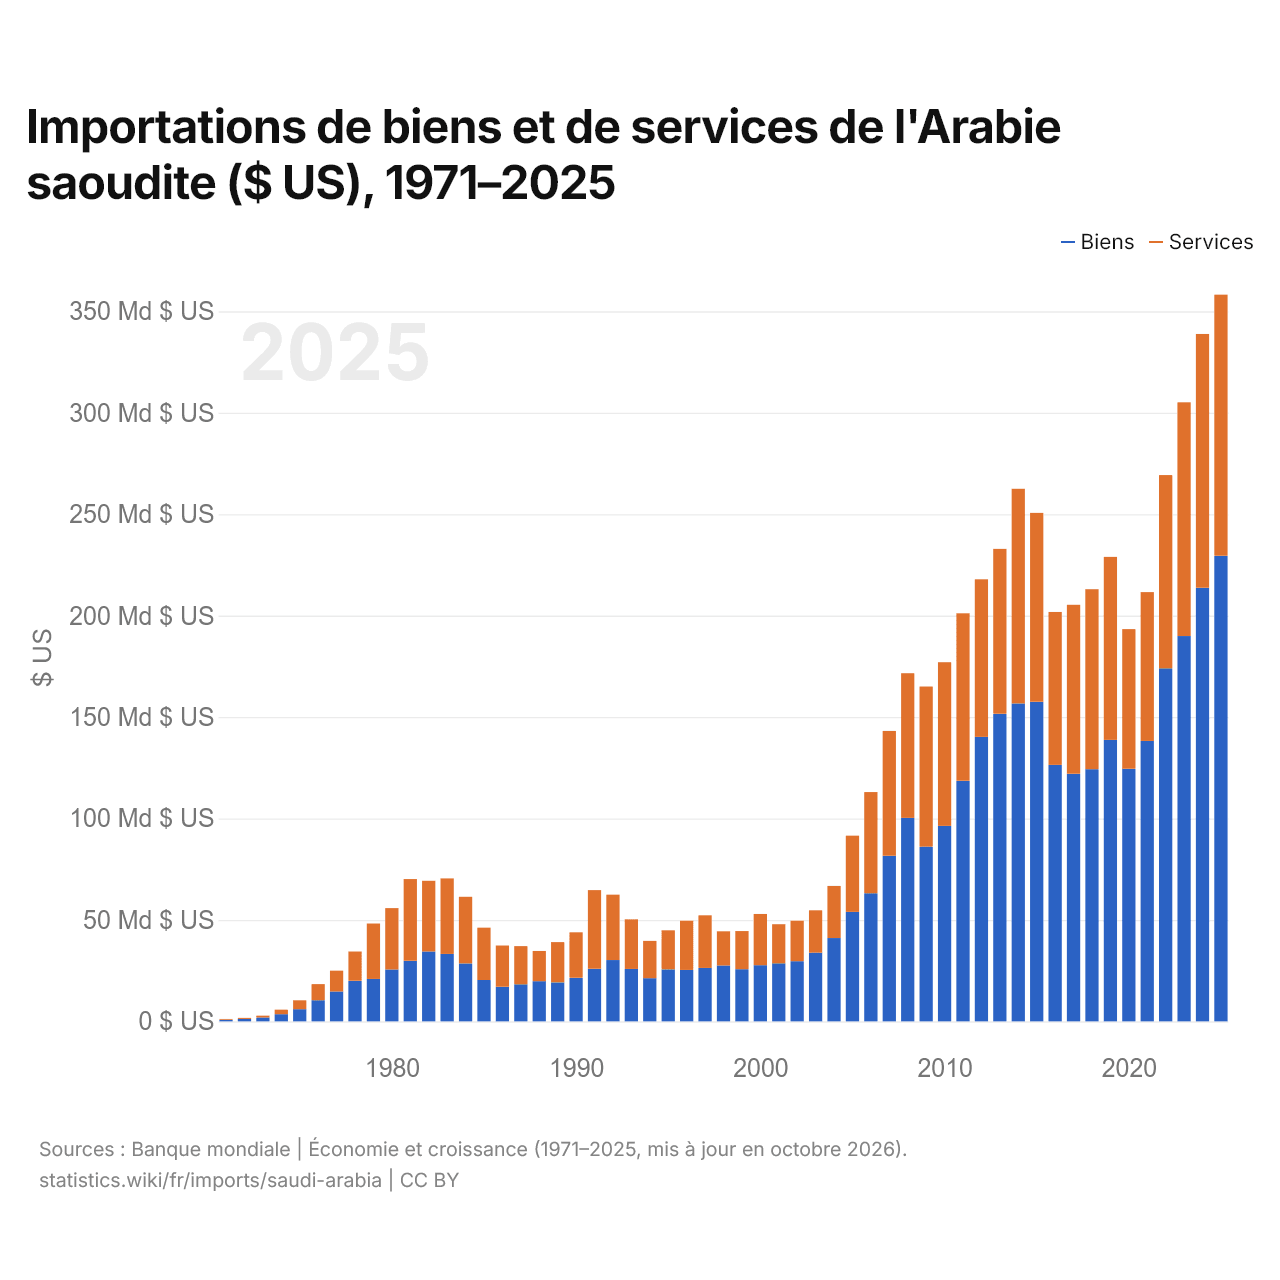
Importations de biens et de services de l'Arabie saoudite ($ US), 1971–2025
| Année | $ US | |
|---|---|---|
| Biens | Services | |
| 2025 | 229 524 450 181 $ US | 128 682 674 105 $ US |
| 2024 | 213 752 430 880 $ US | 125 077 739 251 $ US |
| 2023 | 189 930 236 520 $ US | 115 222 318 052 $ US |
| 2022 | 174 022 684 258 $ US | 95 249 034 396 $ US |
| 2021 | 138 206 335 467 $ US | 73 381 615 150 $ US |
| 2020 | 124 539 786 667 $ US | 68 801 964 261 $ US |
| 2019 | 138 749 522 438 $ US | 90 180 391 924 $ US |
| 2018 | 124 267 066 667 $ US | 88 764 636 549 $ US |
| 2017 | 122 055 572 974 $ US | 83 269 452 378 $ US |
| 2016 | 126 441 706 766 $ US | 75 364 567 444 $ US |
| 2015 | 157 524 374 400 $ US | 93 105 173 756 $ US |
| 2014 | 156 723 645 993 $ US | 105 796 099 112 $ US |
| 2013 | 151 662 080 000 $ US | 81 247 394 794 $ US |
| 2012 | 140 243 226 667 $ US | 77 655 152 465 $ US |
| 2011 | 118 644 826 667 $ US | 82 504 378 927 $ US |
| 2010 | 96 362 506 667 $ US | 80 653 185 761 $ US |
| 2009 | 86 122 132 800 $ US | 78 909 165 745 $ US |
| 2008 | 100 302 269 333 $ US | 71 281 976 971 $ US |
| 2007 | 81 640 819 545 $ US | 61 510 195 093 $ US |
| 2006 | 63 132 083 095 $ US | 49 881 900 768 $ US |
| 2005 | 53 958 280 000 $ US | 37 555 470 700 $ US |
| 2004 | 41 050 400 000 $ US | 25 695 680 000 $ US |
| 2003 | 33 867 733 333 $ US | 20 857 413 333 $ US |
| 2002 | 29 624 266 667 $ US | 19 979 733 333 $ US |
| 2001 | 28 606 972 533 $ US | 19 280 827 467 $ US |
| 2000 | 27 704 000 000 $ US | 25 228 000 000 $ US |
| 1999 | 25 683 200 000 $ US | 18 829 706 667 $ US |
| 1998 | 27 497 866 667 $ US | 16 858 266 667 $ US |
| 1997 | 26 334 933 333 $ US | 25 928 933 333 $ US |
| 1996 | 25 324 533 333 $ US | 24 262 800 000 $ US |
| 1995 | 25 616 266 667 $ US | 19 257 466 667 $ US |
| 1994 | 21 296 533 333 $ US | 18 368 400 000 $ US |
| 1993 | 25 838 666 667 $ US | 24 431 733 333 $ US |
| 1992 | 30 207 466 667 $ US | 32 239 200 000 $ US |
| 1991 | 25 936 000 000 $ US | 38 752 000 000 $ US |
| 1990 | 21 496 000 000 $ US | 22 384 000 000 $ US |
| 1989 | 19 205 333 333 $ US | 19 848 000 000 $ US |
| 1988 | 19 778 666 667 $ US | 14 914 666 667 $ US |
| 1987 | 18 258 666 667 $ US | 18 805 333 333 $ US |
| 1986 | 17 052 276 560 $ US | 20 319 730 185 $ US |
| 1985 | 20 363 675 852 $ US | 25 821 781 487 $ US |
| 1984 | 28 557 151 552 $ US | 32 856 474 279 $ US |
| 1983 | 33 217 945 013 $ US | 37 258 747 665 $ US |
| 1982 | 34 444 024 459 $ US | 34 852 405 507 $ US |
| 1981 | 29 889 061 625 $ US | 40 236 412 336 $ US |
| 1980 | 25 562 549 950 $ US | 30 230 781 379 $ US |
| 1979 | 20 911 459 553 $ US | 27 317 602 470 $ US |
| 1978 | 20 020 228 104 $ US | 14 395 973 603 $ US |
| 1977 | 14 697 601 325 $ US | 10 272 151 013 $ US |
| 1976 | 10 385 269 125 $ US | 7 934 844 195 $ US |
| 1975 | 6 004 072 366 $ US | 4 375 126 596 $ US |
| 1974 | 3 569 014 086 $ US | 2 163 380 282 $ US |
| 1973 | 1 853 456 082 $ US | 955 055 972 $ US |
| 1972 | 1 196 693 688 $ US | 509 077 355 $ US |
| 1971 | 804 577 056 $ US | 374 429 212 $ US |
En 2025, les importations de biens de l'Arabie saoudite s'élevaient à 230 milliards de dollars et celles de services à 129 milliards de dollars ; les services représentaient 35,9 % du total, contre 31,8 % en 1971.
L'Arabie saoudite dans le classement mondial des importations, 2025







Importations de biens et services de l'Arabie saoudite, % du PIB, 1968–2025
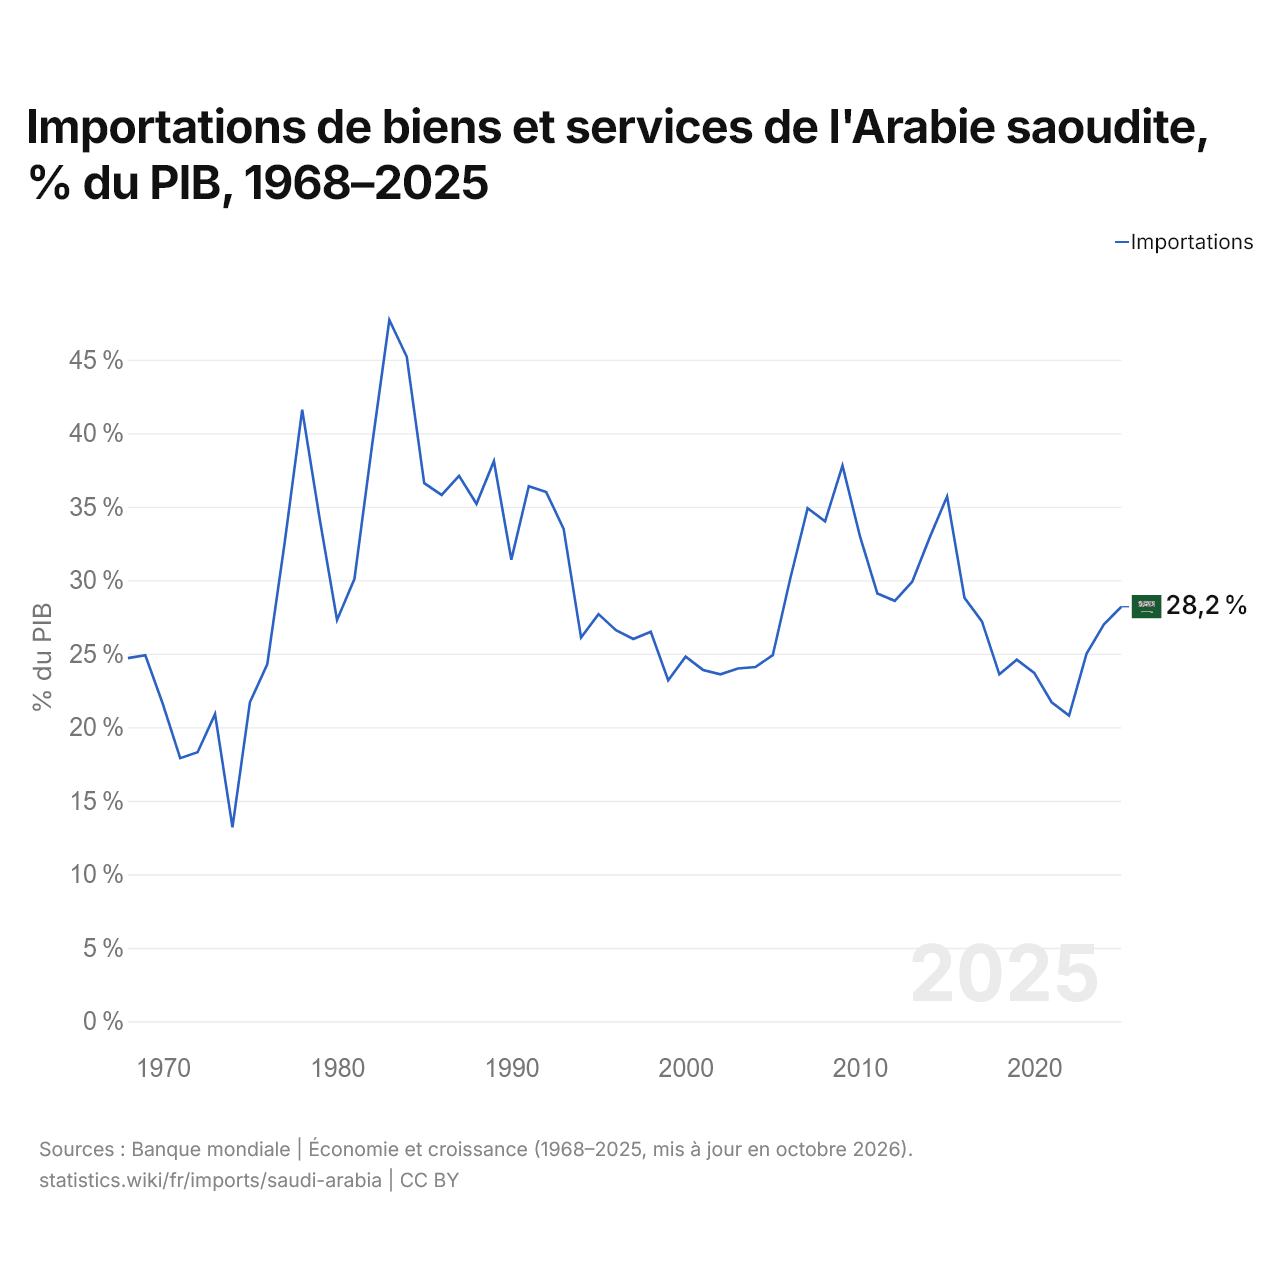
En 2025, les importations de biens et services de l'Arabie saoudite équivalaient à 28,2 % de son PIB, contre 24,7 % en 1968. La part la plus élevée a été de 47,7 %, en 1983.
Comparer les importations de l'Arabie saoudite avec celles d'autres pays
Sources :
- TradeMap (2001–2025, mis à jour en octobre 2026)
- Banque mondiale | Économie et croissance (1968–2025, mis à jour en octobre 2026)
Creative Commons Attribution (CC BY) : vous pouvez copier, partager, adapter et réutiliser ce contenu, y compris à des fins commerciales, à condition de citer statistics.wiki et d’indiquer les modifications apportées. Les sources citées ci-dessus peuvent avoir leurs propres conditions de licence.