
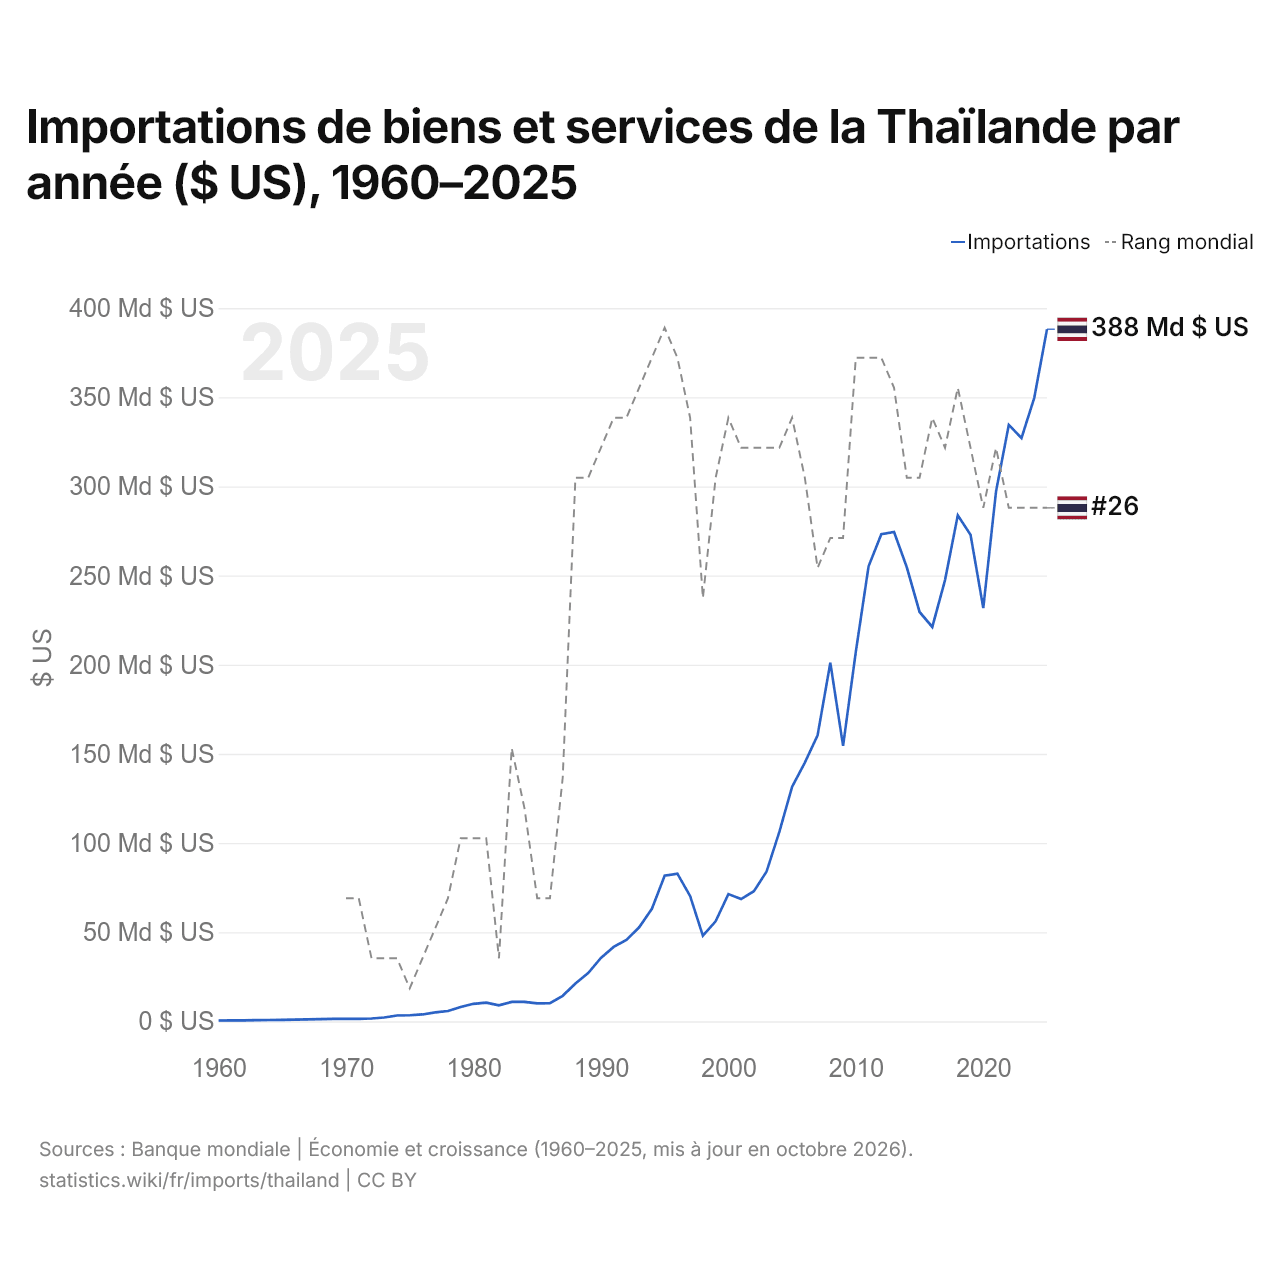
Importations de biens et services de la Thaïlande par année ($ US), 1960–2025
| Année | $ US | Rang mondial |
|---|---|---|
| Importations | Rang mondial | |
| 2025 | 388 129 158 917 $ US | #26 |
| 2024 | 349 671 347 769 $ US | #26 |
| 2023 | 327 159 708 259 $ US | #26 |
| 2022 | 334 490 999 348 $ US | #26 |
| 2021 | 297 103 648 540 $ US | #24 |
| 2020 | 231 745 471 361 $ US | #26 |
| 2019 | 272 916 501 195 $ US | #24 |
| 2018 | 283 801 450 352 $ US | #22 |
| 2017 | 247 430 252 337 $ US | #24 |
| 2016 | 221 168 950 938 $ US | #23 |
| 2015 | 229 553 374 317 $ US | #25 |
| 2014 | 254 633 174 992 $ US | #25 |
| 2013 | 274 440 605 889 $ US | #22 |
| 2012 | 273 216 802 241 $ US | #21 |
| 2011 | 255 199 302 709 $ US | #21 |
| 2010 | 207 270 092 302 $ US | #21 |
| 2009 | 154 464 210 142 $ US | #27 |
| 2008 | 201 114 263 639 $ US | #27 |
| 2007 | 160 397 501 827 $ US | #28 |
| 2006 | 145 055 658 781 $ US | #25 |
| 2005 | 131 483 811 713 $ US | #23 |
| 2004 | 106 227 137 282 $ US | #24 |
| 2003 | 84 013 623 652 $ US | #24 |
| 2002 | 72 957 610 440 $ US | #24 |
| 2001 | 68 589 774 464 $ US | #24 |
| 2000 | 71 358 148 623 $ US | #23 |
| 1999 | 56 073 604 732 $ US | #25 |
| 1998 | 48 088 381 968 $ US | #29 |
| 1997 | 70 306 578 166 $ US | #23 |
| 1996 | 82 833 928 831 $ US | #21 |
| 1995 | 81 632 776 746 $ US | #20 |
| 1994 | 63 084 056 781 $ US | #21 |
| 1993 | 52 752 864 173 $ US | #22 |
| 1992 | 45 675 754 075 $ US | #23 |
| 1991 | 41 756 458 834 $ US | #23 |
| 1990 | 35 545 811 133 $ US | #24 |
| 1989 | 27 083 485 883 $ US | #25 |
| 1988 | 21 214 461 460 $ US | #25 |
| 1987 | 14 318 700 036 $ US | #35 |
| 1986 | 10 157 503 648 $ US | #39 |
| 1985 | 10 091 466 561 $ US | #39 |
| 1984 | 10 937 559 289 $ US | #36 |
| 1983 | 10 920 988 398 $ US | #34 |
| 1982 | 9 012 215 417 $ US | #41 |
| 1981 | 10 496 074 713 $ US | #37 |
| 1980 | 9 824 991 784 $ US | #37 |
| 1979 | 8 019 027 044 $ US | #37 |
| 1978 | 5 788 768 871 $ US | #39 |
| 1977 | 5 019 533 480 $ US | #40 |
| 1976 | 3 856 500 136 $ US | #41 |
| 1975 | 3 419 308 121 $ US | #42 |
| 1974 | 3 282 633 712 $ US | #41 |
| 1973 | 2 172 743 954 $ US | #41 |
| 1972 | 1 568 843 967 $ US | #41 |
| 1971 | 1 387 451 923 $ US | #39 |
| 1970 | 1 373 509 615 $ US | #39 |
| 1969 | 1 343 125 000 $ US | - |
| 1968 | 1 257 644 231 $ US | - |
| 1967 | 1 139 615 385 $ US | - |
| 1966 | 947 403 846 $ US | - |
| 1965 | 792 692 308 $ US | - |
| 1964 | 730 192 308 $ US | - |
| 1963 | 650 552 088 $ US | - |
| 1962 | 584 003 831 $ US | - |
| 1961 | 519 126 773 $ US | - |
| 1960 | 480 790 702 $ US | - |
En 2025, les importations de biens et services de la Thaïlande s'élevaient à 388 milliards de dollars, contre 481 millions de dollars en 1960. Elles se classaient au 26e rang mondial, un rang qu'elles occupent depuis 2022. Leur meilleur rang a été le 20e, occupé pour la dernière fois en 1995.
En 2025, les importations de biens et services de la Thaïlande étaient les 10es plus élevées de 44 pays situés en Asie. En 2025, les exportations de la Thaïlande dépassaient ses importations de 22,4 milliards de dollars, soit un excédent commercial. Le commerce de la Thaïlande, exportations et importations réunies, équivalait à 138,4 % de son PIB en 2025, au 26e rang mondial.
Importations de biens de la Thaïlande par catégorie, 2025
Importations de biens, 2025: 350 Md $US
En 2025, la première catégorie des importations de biens de la Thaïlande était « machines, électronique et véhicules », avec 44,6 %, suivie de « pétrole, gaz, minerais et autres matières premières », avec 15,9 %.
Origines des importations de biens de la Thaïlande : les 10 premières, 2025
| Rang | Pays | Importations de biens | Part | |
|---|---|---|---|---|
| 1 |
 Chine |
109 Md $US | 31 % | vs Chine |
| 2 |
 Japon |
30,0 Md $US | 8,57 % | vs Japon |
| 3 |
 États-Unis |
21,7 Md $US | 6,19 % | |
| 4 |
 EAU |
17,7 Md $US | 5,07 % | |
| 5 |
 Malaisie |
15,2 Md $US | 4,33 % | vs Malaisie |
| 6 |
 Vietnam |
11,0 Md $US | 3,14 % | vs Vietnam |
| 7 |
 Indonésie |
10,4 Md $US | 2,98 % | vs Indonésie |
| 8 |
 Corée du Sud |
9,91 Md $US | 2,83 % | vs Corée du Sud |
| 9 |
 Singapour |
7,70 Md $US | 2,2 % | |
| 10 |
 Suisse |
7,24 Md $US | 2,07 % | vs Suisse |
| Autres partenaires et non précisés | 110 Md $US | 31,6 % |
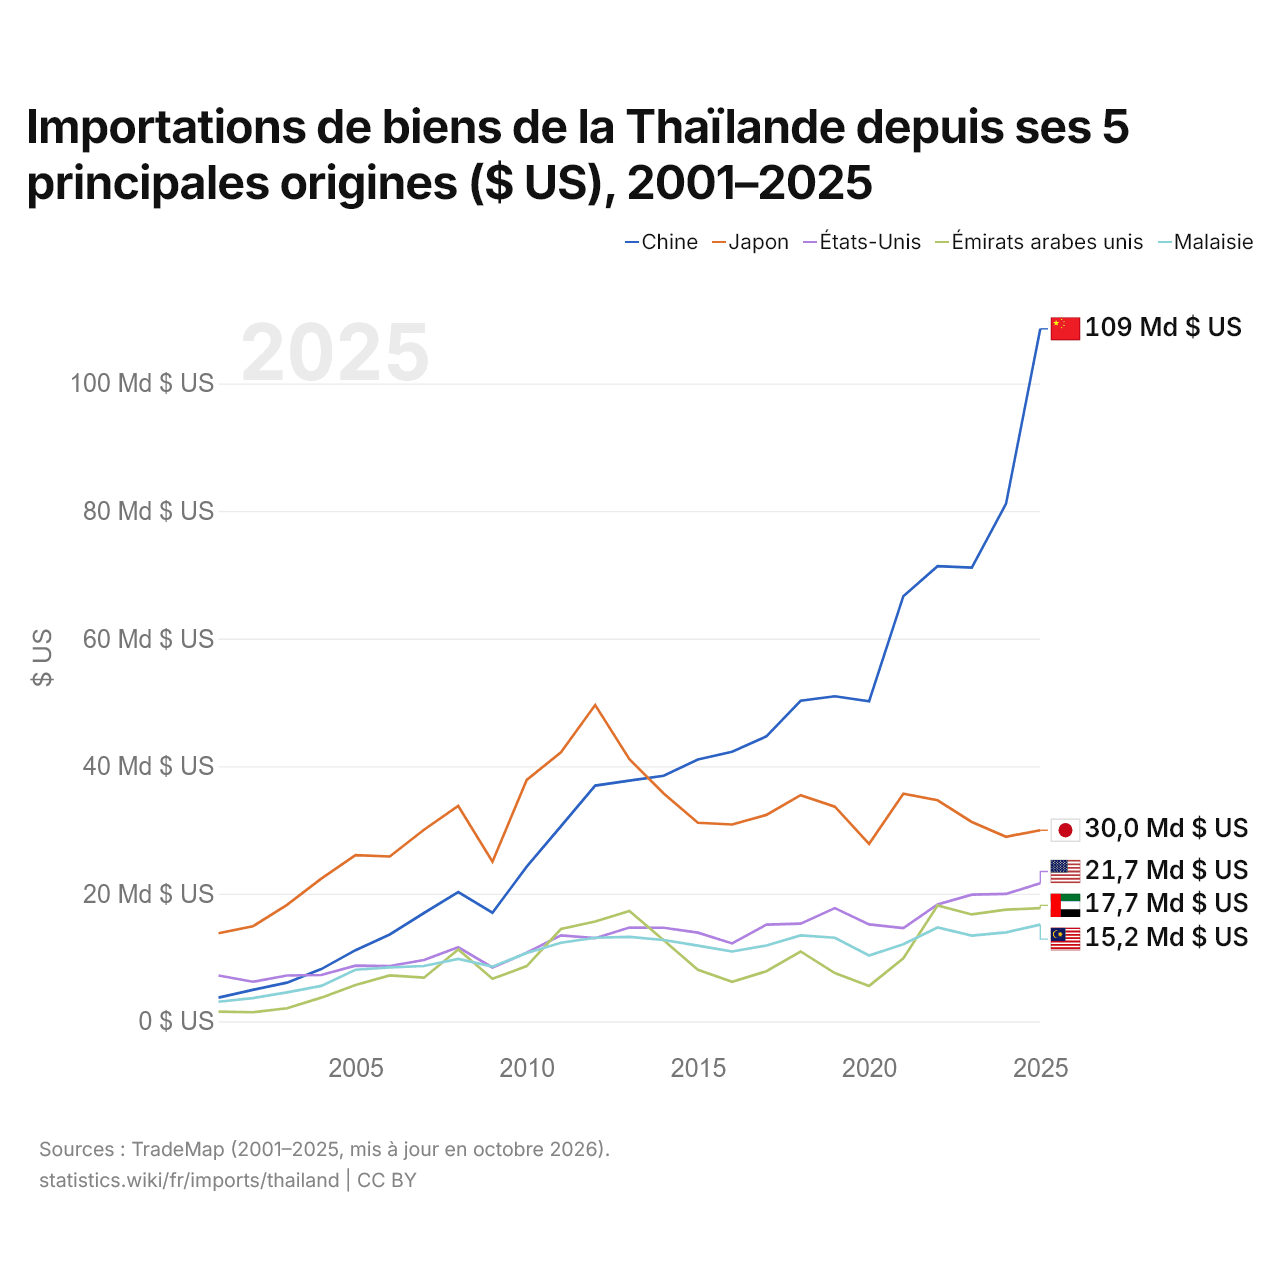
Importations de biens de la Thaïlande depuis ses 5 principales origines ($ US), 2001–2025
| Année | $ US | ||||
|---|---|---|---|---|---|
| Chine | Japon | États-Unis | Émirats arabes unis | Malaisie | |
| 2025 | 108 557 160 000 $ US | 29 961 212 000 $ US | 21 660 981 000 $ US | 17 740 815 000 $ US | 15 160 738 000 $ US |
| 2024 | 81 152 999 000 $ US | 28 936 658 000 $ US | 19 972 379 000 $ US | 17 506 935 000 $ US | 13 953 651 000 $ US |
| 2023 | 71 120 725 000 $ US | 31 255 965 000 $ US | 19 859 783 000 $ US | 16 757 476 000 $ US | 13 436 406 000 $ US |
| 2022 | 71 353 308 000 $ US | 34 648 183 000 $ US | 18 328 713 000 $ US | 18 161 378 000 $ US | 14 714 181 000 $ US |
| 2021 | 66 646 108 000 $ US | 35 689 940 000 $ US | 14 623 605 000 $ US | 9 882 605 000 $ US | 12 090 615 000 $ US |
| 2020 | 50 172 100 000 $ US | 27 825 440 000 $ US | 15 189 239 000 $ US | 5 551 188 000 $ US | 10 318 600 000 $ US |
| 2019 | 50 953 351 000 $ US | 33 650 472 000 $ US | 17 751 137 000 $ US | 7 572 707 000 $ US | 13 103 668 000 $ US |
| 2018 | 50 265 683 000 $ US | 35 450 691 000 $ US | 15 305 751 000 $ US | 10 951 461 000 $ US | 13 470 843 000 $ US |
| 2017 | 44 675 724 000 $ US | 32 360 839 000 $ US | 15 161 279 000 $ US | 7 847 582 000 $ US | 11 883 973 000 $ US |
| 2016 | 42 246 374 000 $ US | 30 858 889 000 $ US | 12 215 661 000 $ US | 6 194 573 000 $ US | 10 952 015 000 $ US |
| 2015 | 41 044 333 000 $ US | 31 124 459 000 $ US | 13 909 335 000 $ US | 8 094 496 000 $ US | 11 874 962 000 $ US |
| 2014 | 38 498 345 000 $ US | 35 710 527 000 $ US | 14 675 262 000 $ US | 12 718 491 000 $ US | 12 745 923 000 $ US |
| 2013 | 37 726 633 000 $ US | 41 082 107 000 $ US | 14 706 027 000 $ US | 17 286 318 000 $ US | 13 247 484 000 $ US |
| 2012 | 36 956 544 000 $ US | 49 579 946 000 $ US | 13 033 713 000 $ US | 15 645 229 000 $ US | 13 105 840 000 $ US |
| 2011 | 30 581 153 000 $ US | 42 162 112 000 $ US | 13 472 810 000 $ US | 14 468 790 000 $ US | 12 326 055 000 $ US |
| 2010 | 24 239 367 000 $ US | 37 856 129 000 $ US | 10 750 783 000 $ US | 8 654 886 000 $ US | 10 708 896 000 $ US |
| 2009 | 17 028 921 000 $ US | 25 023 287 000 $ US | 8 437 212 000 $ US | 6 666 492 000 $ US | 8 575 320 000 $ US |
| 2008 | 20 249 183 000 $ US | 33 759 543 000 $ US | 11 603 931 000 $ US | 11 278 476 000 $ US | 9 775 880 000 $ US |
| 2007 | 16 979 862 000 $ US | 30 032 903 000 $ US | 9 610 867 000 $ US | 6 842 627 000 $ US | 8 679 783 000 $ US |
| 2006 | 13 617 176 000 $ US | 25 842 606 000 $ US | 8 674 610 000 $ US | 7 190 492 000 $ US | 8 462 139 000 $ US |
| 2005 | 11 157 871 000 $ US | 26 049 684 000 $ US | 8 723 676 000 $ US | 5 695 938 000 $ US | 8 088 424 000 $ US |
| 2004 | 8 187 809 000 $ US | 22 381 170 000 $ US | 7 267 842 000 $ US | 3 714 212 000 $ US | 5 550 549 000 $ US |
| 2003 | 6 065 207 000 $ US | 18 260 388 000 $ US | 7 179 613 000 $ US | 2 043 373 000 $ US | 4 536 794 000 $ US |
| 2002 | 4 932 100 000 $ US | 14 889 174 000 $ US | 6 202 704 000 $ US | 1 426 309 000 $ US | 3 642 937 000 $ US |
| 2001 | 3 715 825 000 $ US | 13 811 060 000 $ US | 7 183 992 000 $ US | 1 529 598 000 $ US | 3 077 179 000 $ US |
En 2025, les importations de biens s'élevaient à 109 milliards de dollars en provenance de la Chine, 30 milliards de dollars en provenance du Japon, 21,7 milliards de dollars en provenance des États-Unis, 17,7 milliards de dollars en provenance des Émirats arabes unis et 15,2 milliards de dollars en provenance de la Malaisie. Le premier rang des cinq fournisseurs de la Thaïlande est occupé par la Chine depuis 2014. Le changement le plus récent dans leur ordre remonte à 2022, quand les importations de la Thaïlande en provenance des Émirats arabes unis ont dépassé celles en provenance de la Malaisie.
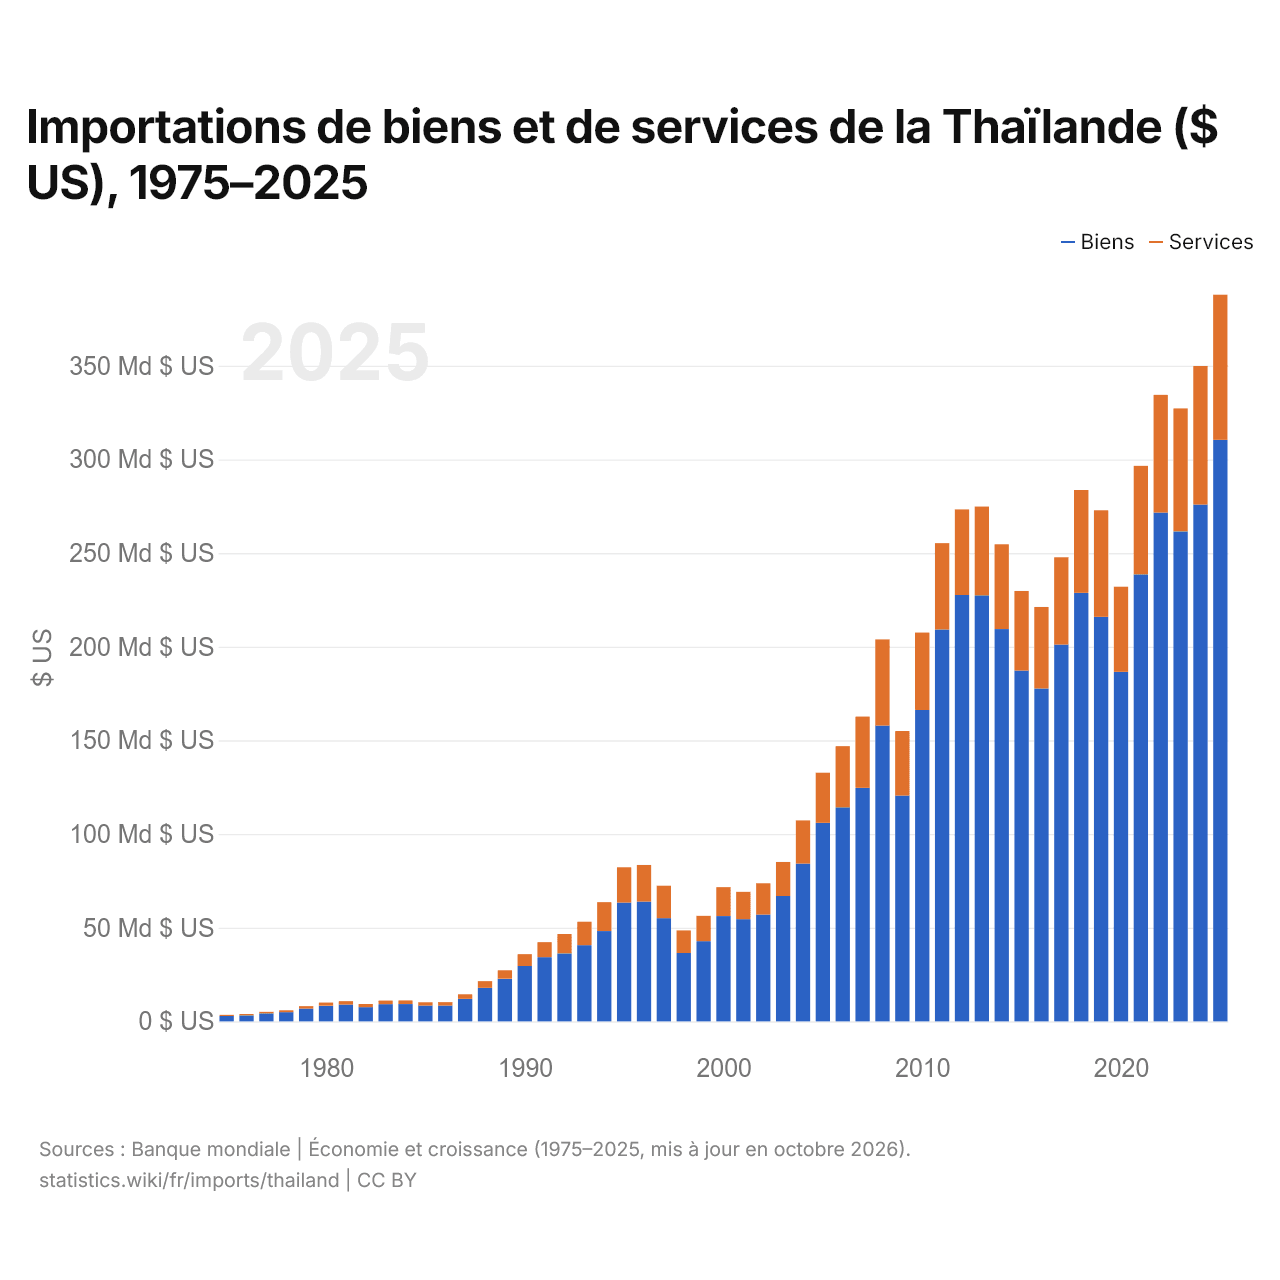
Importations de biens et de services de la Thaïlande ($ US), 1975–2025
| Année | $ US | |
|---|---|---|
| Biens | Services | |
| 2025 | 310 446 579 363 $ US | 77 500 445 550 $ US |
| 2024 | 275 910 757 472 $ US | 73 964 722 728 $ US |
| 2023 | 261 555 867 021 $ US | 65 635 196 935 $ US |
| 2022 | 271 618 864 270 $ US | 62 821 589 402 $ US |
| 2021 | 238 619 662 053 $ US | 57 949 202 431 $ US |
| 2020 | 186 582 315 538 $ US | 45 466 141 718 $ US |
| 2019 | 215 976 288 568 $ US | 56 854 600 168 $ US |
| 2018 | 228 720 468 285 $ US | 54 939 109 775 $ US |
| 2017 | 201 106 807 974 $ US | 46 668 337 798 $ US |
| 2016 | 177 711 416 690 $ US | 43 511 450 945 $ US |
| 2015 | 187 247 531 621 $ US | 42 518 310 373 $ US |
| 2014 | 209 422 248 390 $ US | 45 247 281 369 $ US |
| 2013 | 227 415 745 972 $ US | 47 402 773 422 $ US |
| 2012 | 227 625 139 438 $ US | 45 671 390 157 $ US |
| 2011 | 209 213 420 000 $ US | 46 097 401 276 $ US |
| 2010 | 166 225 250 000 $ US | 41 333 280 110 $ US |
| 2009 | 120 561 520 000 $ US | 34 429 650 081 $ US |
| 2008 | 157 884 950 000 $ US | 46 021 320 000 $ US |
| 2007 | 124 618 040 000 $ US | 38 071 250 000 $ US |
| 2006 | 114 271 770 000 $ US | 32 613 590 000 $ US |
| 2005 | 105 960 150 000 $ US | 26 798 210 000 $ US |
| 2004 | 84 193 477 426 $ US | 23 077 098 855 $ US |
| 2003 | 66 908 728 391 $ US | 18 168 807 216 $ US |
| 2002 | 57 008 216 534 $ US | 16 720 409 958 $ US |
| 2001 | 54 538 841 091 $ US | 14 610 426 194 $ US |
| 2000 | 56 192 998 494 $ US | 15 460 261 049 $ US |
| 1999 | 42 761 773 328 $ US | 13 582 799 708 $ US |
| 1998 | 36 514 982 915 $ US | 11 998 318 524 $ US |
| 1997 | 55 084 321 744 $ US | 17 354 511 964 $ US |
| 1996 | 63 896 558 223 $ US | 19 585 108 741 $ US |
| 1995 | 63 414 719 171 $ US | 18 831 760 321 $ US |
| 1994 | 48 204 055 346 $ US | 15 395 837 220 $ US |
| 1993 | 40 694 407 585 $ US | 12 469 021 072 $ US |
| 1992 | 36 260 437 952 $ US | 10 368 257 186 $ US |
| 1991 | 34 221 419 667 $ US | 8 039 850 186 $ US |
| 1990 | 29 561 306 472 $ US | 6 309 185 680 $ US |
| 1989 | 22 749 749 579 $ US | 4 504 900 127 $ US |
| 1988 | 17 855 538 839 $ US | 3 569 344 757 $ US |
| 1987 | 12 019 161 093 $ US | 2 406 160 562 $ US |
| 1986 | 8 414 782 478 $ US | 1 851 554 674 $ US |
| 1985 | 8 391 152 407 $ US | 1 814 581 192 $ US |
| 1984 | 9 235 728 242 $ US | 1 909 512 595 $ US |
| 1983 | 9 168 736 350 $ US | 1 908 772 978 $ US |
| 1982 | 7 565 440 091 $ US | 1 657 861 201 $ US |
| 1981 | 8 930 460 910 $ US | 1 819 179 892 $ US |
| 1980 | 8 351 547 017 $ US | 1 644 315 758 $ US |
| 1979 | 6 784 742 378 $ US | 1 351 847 699 $ US |
| 1978 | 4 903 552 500 $ US | 1 004 938 777 $ US |
| 1977 | 4 238 017 834 $ US | 845 436 911 $ US |
| 1976 | 3 151 993 901 $ US | 747 741 325 $ US |
| 1975 | 2 849 660 536 $ US | 628 334 593 $ US |
En 2025, les importations de biens de la Thaïlande s'élevaient à 310 milliards de dollars et celles de services à 77,5 milliards de dollars ; les services représentaient 20,0 % du total, contre 18,1 % en 1975.
La Thaïlande dans le classement mondial des importations, 2025
| Rang | Pays | Importations | Part mondiale | |
|---|---|---|---|---|
| 23 |
 Turquie |
401 Md $US | 1,19 % | vs Turquie |
| 24 |
 Brésil |
398 Md $US | 1,18 % | vs Brésil |
| 25 |
 Russie |
397 Md $US | 1,18 % | |
| 26 |
 Thaïlande |
388 Md $US | 1,15 % | |
| 27 |
 Arabie saoudite |
360 Md $US | 1,07 % | |
| 28 |
 Suède |
342 Md $US | 1,01 % | |
| 29 |
Malaisie
|
309 Md $US | 0,92 % | vs Malaisie |
Importations de biens et services de la Thaïlande, % du PIB, 1960–2025
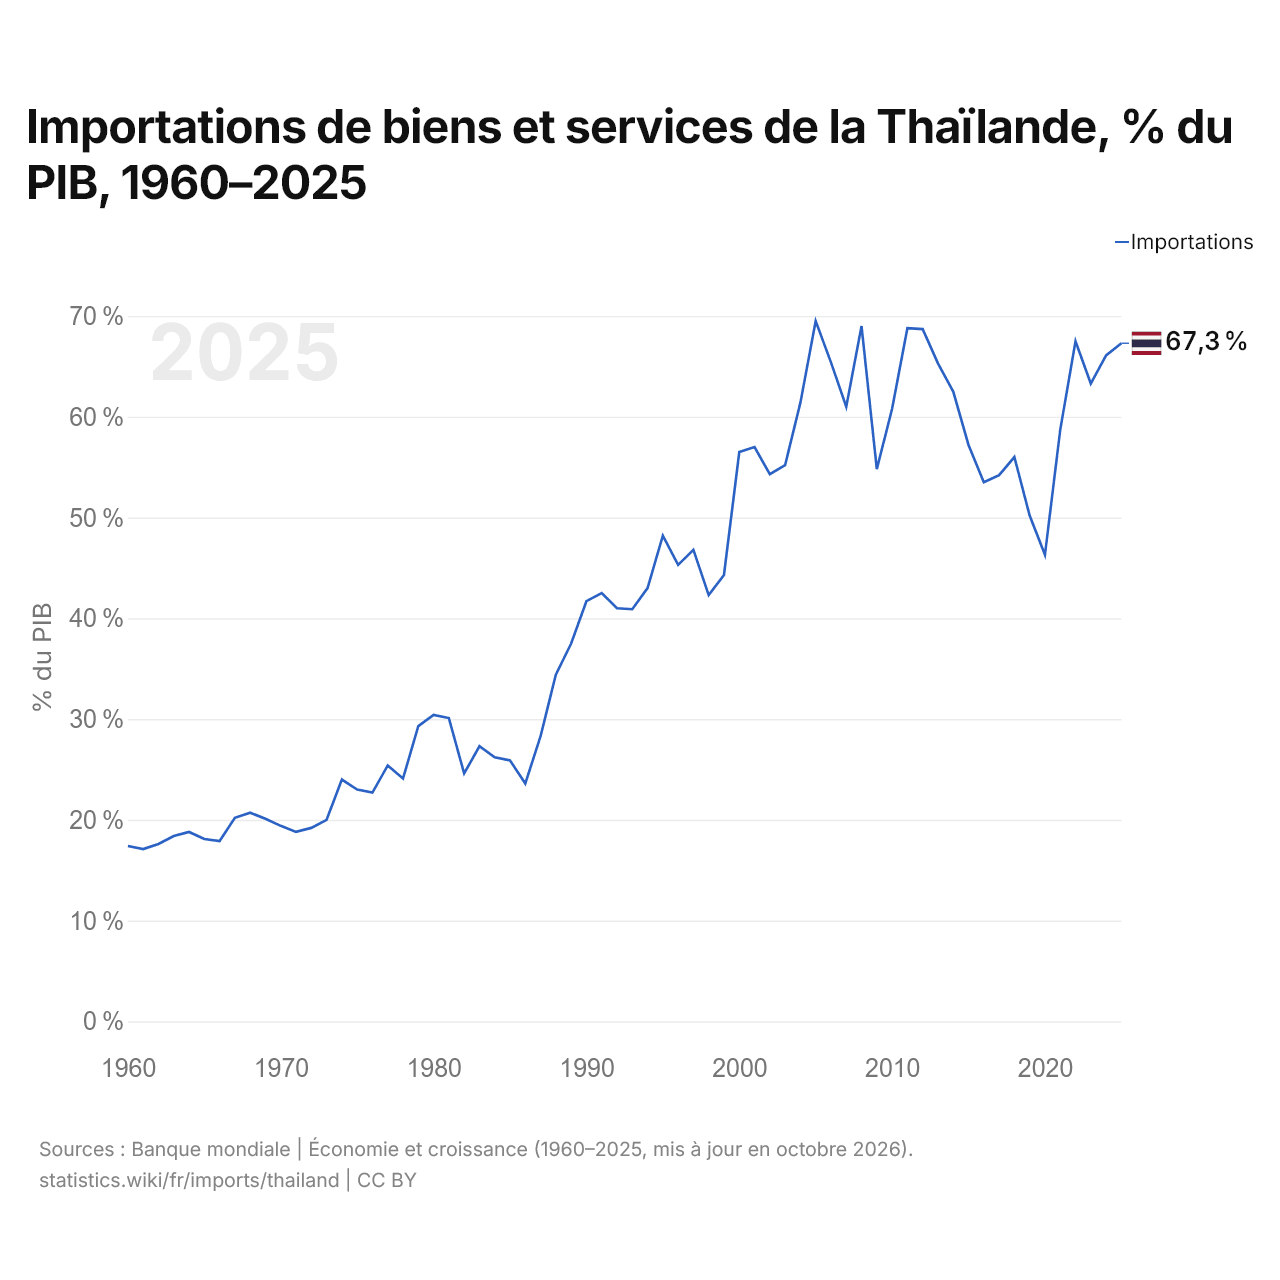
En 2025, les importations de biens et services de la Thaïlande équivalaient à 67,3 % de son PIB, contre 17,4 % en 1960. La part la plus élevée a été de 69,5 %, en 2005.
Comparer les importations de la Thaïlande avec celles d'autres pays
Sources :
- TradeMap (2001–2025, mis à jour en octobre 2026)
- Banque mondiale | Économie et croissance (1960–2025, mis à jour en octobre 2026)
Creative Commons Attribution (CC BY) : vous pouvez copier, partager, adapter et réutiliser ce contenu, y compris à des fins commerciales, à condition de citer statistics.wiki et d’indiquer les modifications apportées. Les sources citées ci-dessus peuvent avoir leurs propres conditions de licence.