
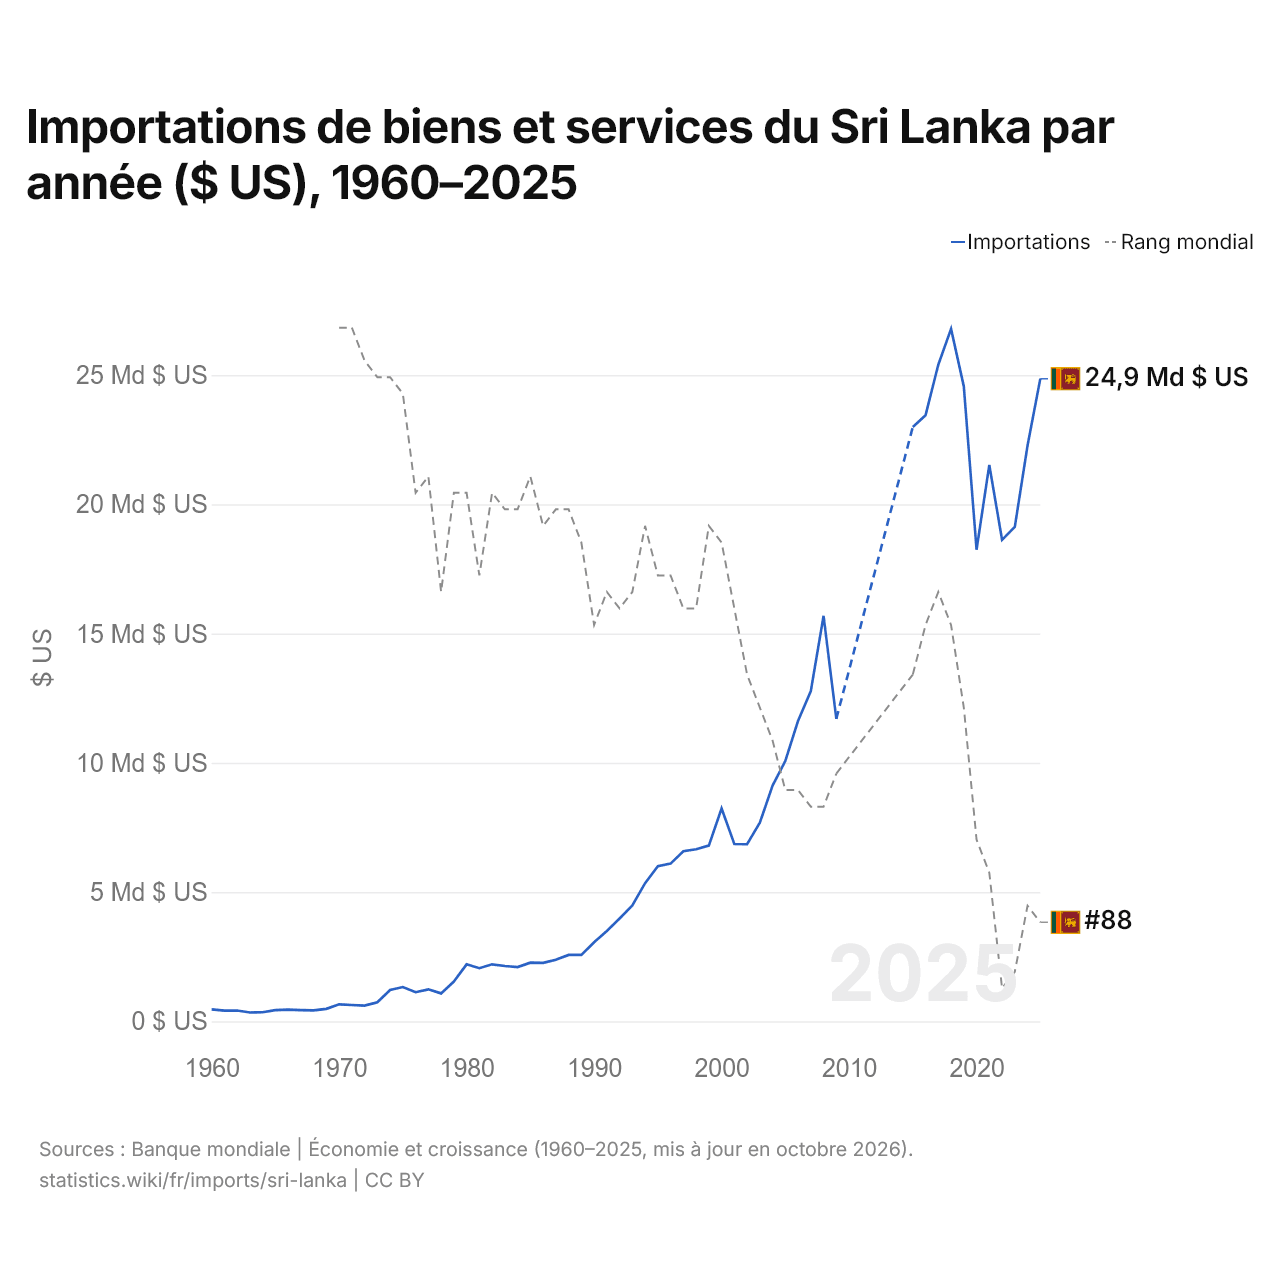
Importations de biens et services du Sri Lanka par année ($ US), 1960–2025
| Année | $ US | Rang mondial |
|---|---|---|
| Importations | Rang mondial | |
| 2025 | 24 857 449 190 $ US | #88 |
| 2024 | 22 277 780 954 $ US | #87 |
| 2023 | 19 126 705 821 $ US | #91 |
| 2022 | 18 626 984 768 $ US | #92 |
| 2021 | 21 525 852 974 $ US | #85 |
| 2020 | 18 243 032 009 $ US | #83 |
| 2019 | 24 565 416 614 $ US | #75 |
| 2018 | 26 788 997 949 $ US | #70 |
| 2017 | 25 400 652 317 $ US | #68 |
| 2016 | 23 449 857 058 $ US | #70 |
| 2015 | 22 995 302 384 $ US | #73 |
| 2014 | - | - |
| 2013 | - | - |
| 2012 | - | - |
| 2011 | - | - |
| 2010 | - | - |
| 2009 | 11 703 149 677 $ US | #79 |
| 2008 | 15 686 042 402 $ US | #81 |
| 2007 | 12 775 598 413 $ US | #81 |
| 2006 | 11 627 135 437 $ US | #80 |
| 2005 | 10 071 562 189 $ US | #80 |
| 2004 | 9 122 927 167 $ US | #77 |
| 2003 | 7 681 620 390 $ US | #75 |
| 2002 | 6 849 730 985 $ US | #73 |
| 2001 | 6 861 760 295 $ US | #69 |
| 2000 | 8 235 000 000 $ US | #65 |
| 1999 | 6 798 203 826 $ US | #64 |
| 1998 | 6 659 095 835 $ US | #69 |
| 1997 | 6 579 989 219 $ US | #69 |
| 1996 | 6 101 194 138 $ US | #67 |
| 1995 | 5 998 536 585 $ US | #67 |
| 1994 | 5 345 325 779 $ US | #64 |
| 1993 | 4 481 456 954 $ US | #68 |
| 1992 | 3 981 473 876 $ US | #69 |
| 1991 | 3 497 075 175 $ US | #68 |
| 1990 | 3 057 438 842 $ US | #70 |
| 1989 | 2 568 294 036 $ US | #65 |
| 1988 | 2 570 606 727 $ US | #63 |
| 1987 | 2 385 292 120 $ US | #63 |
| 1986 | 2 262 919 343 $ US | #64 |
| 1985 | 2 269 734 904 $ US | #61 |
| 1984 | 2 099 724 843 $ US | #63 |
| 1983 | 2 141 138 972 $ US | #63 |
| 1982 | 2 205 910 620 $ US | #62 |
| 1981 | 2 054 961 039 $ US | #67 |
| 1980 | 2 205 444 646 $ US | #62 |
| 1979 | 1 539 434 811 $ US | #62 |
| 1978 | 1 080 845 612 $ US | #68 |
| 1977 | 1 237 767 756 $ US | #61 |
| 1976 | 1 126 991 677 $ US | #62 |
| 1975 | 1 325 392 297 $ US | #56 |
| 1974 | 1 211 729 323 $ US | #55 |
| 1973 | 735 000 000 $ US | #55 |
| 1972 | 610 385 260 $ US | #54 |
| 1971 | 630 522 766 $ US | #52 |
| 1970 | 656 806 723 $ US | #52 |
| 1969 | 483 865 546 $ US | - |
| 1968 | 424 913 594 $ US | - |
| 1967 | 433 333 333 $ US | - |
| 1966 | 452 731 092 $ US | - |
| 1965 | 432 983 193 $ US | - |
| 1964 | 349 987 424 $ US | - |
| 1963 | 341 092 713 $ US | - |
| 1962 | 418 792 244 $ US | - |
| 1961 | 411 422 958 $ US | - |
| 1960 | 464 026 786 $ US | - |
En 2025, les importations de biens et services du Sri Lanka s'élevaient à 24,9 milliards de dollars, contre 464 millions de dollars en 1960. Le maximum a été de 26,8 milliards de dollars, en 2018. Elles se classaient au 88e rang mondial, en baisse par rapport au 87e rang en 2024. Leur meilleur rang a été le 52e, occupé pour la dernière fois en 1971.
En 2025, les importations de biens et services du Sri Lanka étaient les 29es plus élevées de 44 pays situés en Asie. En 2025, les importations du Sri Lanka dépassaient ses exportations de 4,22 milliards de dollars, soit un déficit commercial. Le commerce du Sri Lanka, exportations et importations réunies, équivalait à 41,8 % de son PIB en 2025, au 148e rang mondial.
Importations de biens du Sri Lanka par catégorie, 2025
Importations de biens, 2025: 20,9 Md $US
En 2025, la première catégorie des importations de biens du Sri Lanka était « machines, électronique et véhicules », avec 25,7 %, suivie de « pétrole, gaz, minerais et autres matières premières », avec 23,2 %.
Origines des importations de biens du Sri Lanka : les 10 premières, 2025
| Rang | Pays | Importations de biens | Part | |
|---|---|---|---|---|
| 1 |
 Chine |
5,08 Md $US | 24,3 % | |
| 2 |
 Inde |
4,27 Md $US | 20,4 % | vs Inde |
| 3 |
 EAU |
1,42 Md $US | 6,77 % | |
| 4 |
 Japon |
1,11 Md $US | 5,3 % | |
| 5 |
 Singapour |
971 M $US | 4,64 % | |
| 6 |
 Malaisie |
955 M $US | 4,56 % | vs Malaisie |
| 7 |
 Indonésie |
549 M $US | 2,62 % | vs Indonésie |
| 8 |
 États-Unis |
540 M $US | 2,58 % | |
| 9 |
 Thaïlande |
473 M $US | 2,26 % | |
| 10 |
 Oman |
432 M $US | 2,07 % | |
| Autres partenaires et non précisés | 5,12 Md $US | 24,5 % |
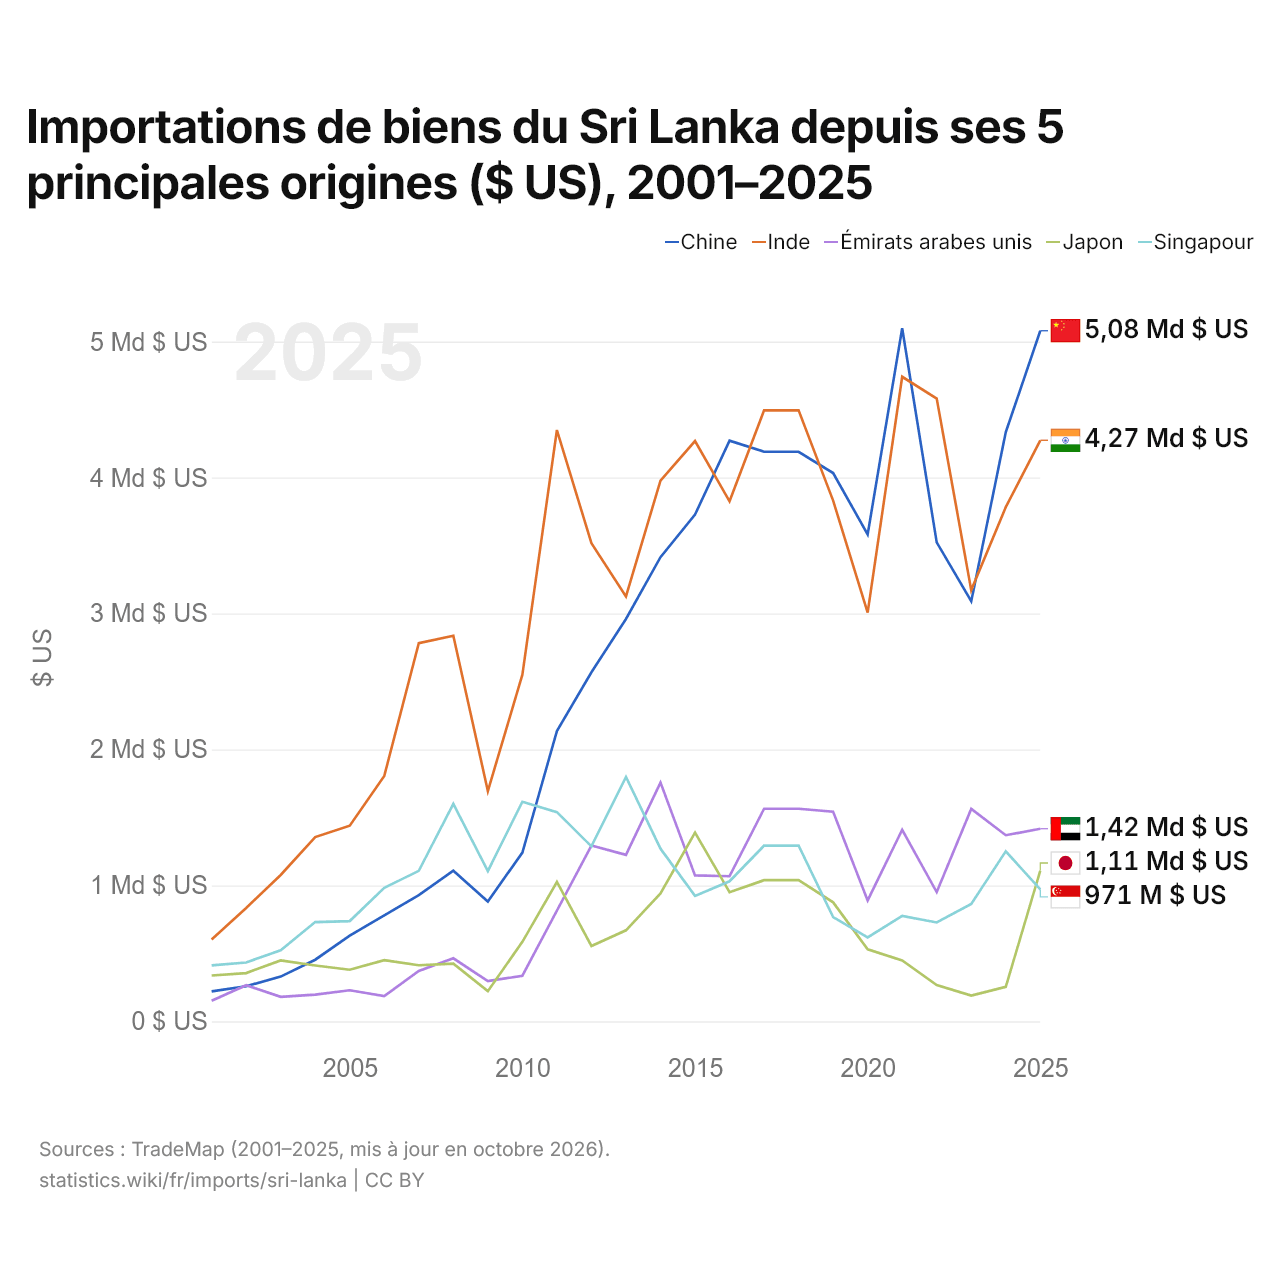
Importations de biens du Sri Lanka depuis ses 5 principales origines ($ US), 2001–2025
| Année | $ US | ||||
|---|---|---|---|---|---|
| Chine | Inde | Émirats arabes unis | Japon | Singapour | |
| 2025 | 5 079 537 000 $ US | 4 273 919 000 $ US | 1 416 485 000 $ US | 1 108 869 000 $ US | 971 172 000 $ US |
| 2024 | 4 333 142 000 $ US | 3 782 124 000 $ US | 1 369 110 000 $ US | 253 837 000 $ US | 1 250 580 000 $ US |
| 2023 | 3 089 545 000 $ US | 3 171 784 000 $ US | 1 562 808 000 $ US | 189 243 000 $ US | 863 376 000 $ US |
| 2022 | 3 523 025 000 $ US | 4 580 558 000 $ US | 950 361 000 $ US | 266 669 000 $ US | 727 392 000 $ US |
| 2021 | 5 097 728 000 $ US | 4 741 098 000 $ US | 1 409 073 000 $ US | 448 377 000 $ US | 775 939 000 $ US |
| 2020 | 3 581 772 000 $ US | 3 006 131 000 $ US | 888 997 000 $ US | 529 206 000 $ US | 617 278 000 $ US |
| 2019 | 4 032 819 000 $ US | 3 830 134 000 $ US | 1 541 880 000 $ US | 875 303 000 $ US | 766 594 000 $ US |
| 2018 | 4 189 427 000 $ US | 4 494 066 000 $ US | 1 563 891 000 $ US | 1 038 078 000 $ US | 1 292 077 000 $ US |
| 2017 | 4 189 427 000 $ US | 4 494 066 000 $ US | 1 563 891 000 $ US | 1 038 078 000 $ US | 1 292 077 000 $ US |
| 2016 | 4 270 756 000 $ US | 3 824 968 000 $ US | 1 067 273 000 $ US | 949 829 000 $ US | 1 030 316 000 $ US |
| 2015 | 3 727 432 000 $ US | 4 268 480 000 $ US | 1 073 080 000 $ US | 1 387 668 000 $ US | 922 807 000 $ US |
| 2014 | 3 414 298 000 $ US | 3 977 635 000 $ US | 1 755 925 000 $ US | 941 086 000 $ US | 1 270 052 000 $ US |
| 2013 | 2 959 702 000 $ US | 3 125 806 000 $ US | 1 224 379 000 $ US | 669 555 000 $ US | 1 798 377 000 $ US |
| 2012 | 2 567 874 000 $ US | 3 517 048 000 $ US | 1 293 172 000 $ US | 554 543 000 $ US | 1 286 748 000 $ US |
| 2011 | 2 134 758 000 $ US | 4 349 226 000 $ US | 814 864 000 $ US | 1 025 097 000 $ US | 1 538 834 000 $ US |
| 2010 | 1 241 649 000 $ US | 2 549 435 000 $ US | 335 632 000 $ US | 584 841 000 $ US | 1 615 423 000 $ US |
| 2009 | 881 013 000 $ US | 1 694 021 000 $ US | 295 484 000 $ US | 221 788 000 $ US | 1 104 987 000 $ US |
| 2008 | 1 107 779 000 $ US | 2 836 231 000 $ US | 463 624 000 $ US | 424 334 000 $ US | 1 599 310 000 $ US |
| 2007 | 928 975 000 $ US | 2 781 377 000 $ US | 370 757 000 $ US | 412 826 000 $ US | 1 106 865 000 $ US |
| 2006 | 779 704 000 $ US | 1 805 129 000 $ US | 186 432 000 $ US | 449 558 000 $ US | 981 932 000 $ US |
| 2005 | 630 127 000 $ US | 1 439 298 000 $ US | 228 403 000 $ US | 379 431 000 $ US | 737 500 000 $ US |
| 2004 | 453 180 000 $ US | 1 355 259 000 $ US | 196 055 000 $ US | 410 910 000 $ US | 730 221 000 $ US |
| 2003 | 329 128 000 $ US | 1 076 518 000 $ US | 180 026 000 $ US | 448 264 000 $ US | 522 371 000 $ US |
| 2002 | 258 307 000 $ US | 833 977 000 $ US | 265 934 000 $ US | 355 006 000 $ US | 432 952 000 $ US |
| 2001 | 220 737 000 $ US | 602 388 000 $ US | 151 204 000 $ US | 337 391 000 $ US | 411 052 000 $ US |
En 2025, les importations de biens s'élevaient à 5,08 milliards de dollars en provenance de la Chine, 4,27 milliards de dollars en provenance de l'Inde, 1,42 milliard de dollars en provenance des Émirats arabes unis, 1,11 milliard de dollars en provenance du Japon et 971 millions de dollars en provenance de Singapour. Le premier rang des cinq fournisseurs du Sri Lanka est occupé par la Chine depuis 2024. Le changement le plus récent dans leur ordre remonte à 2025, quand les importations du Sri Lanka en provenance du Japon ont dépassé celles en provenance de Singapour.
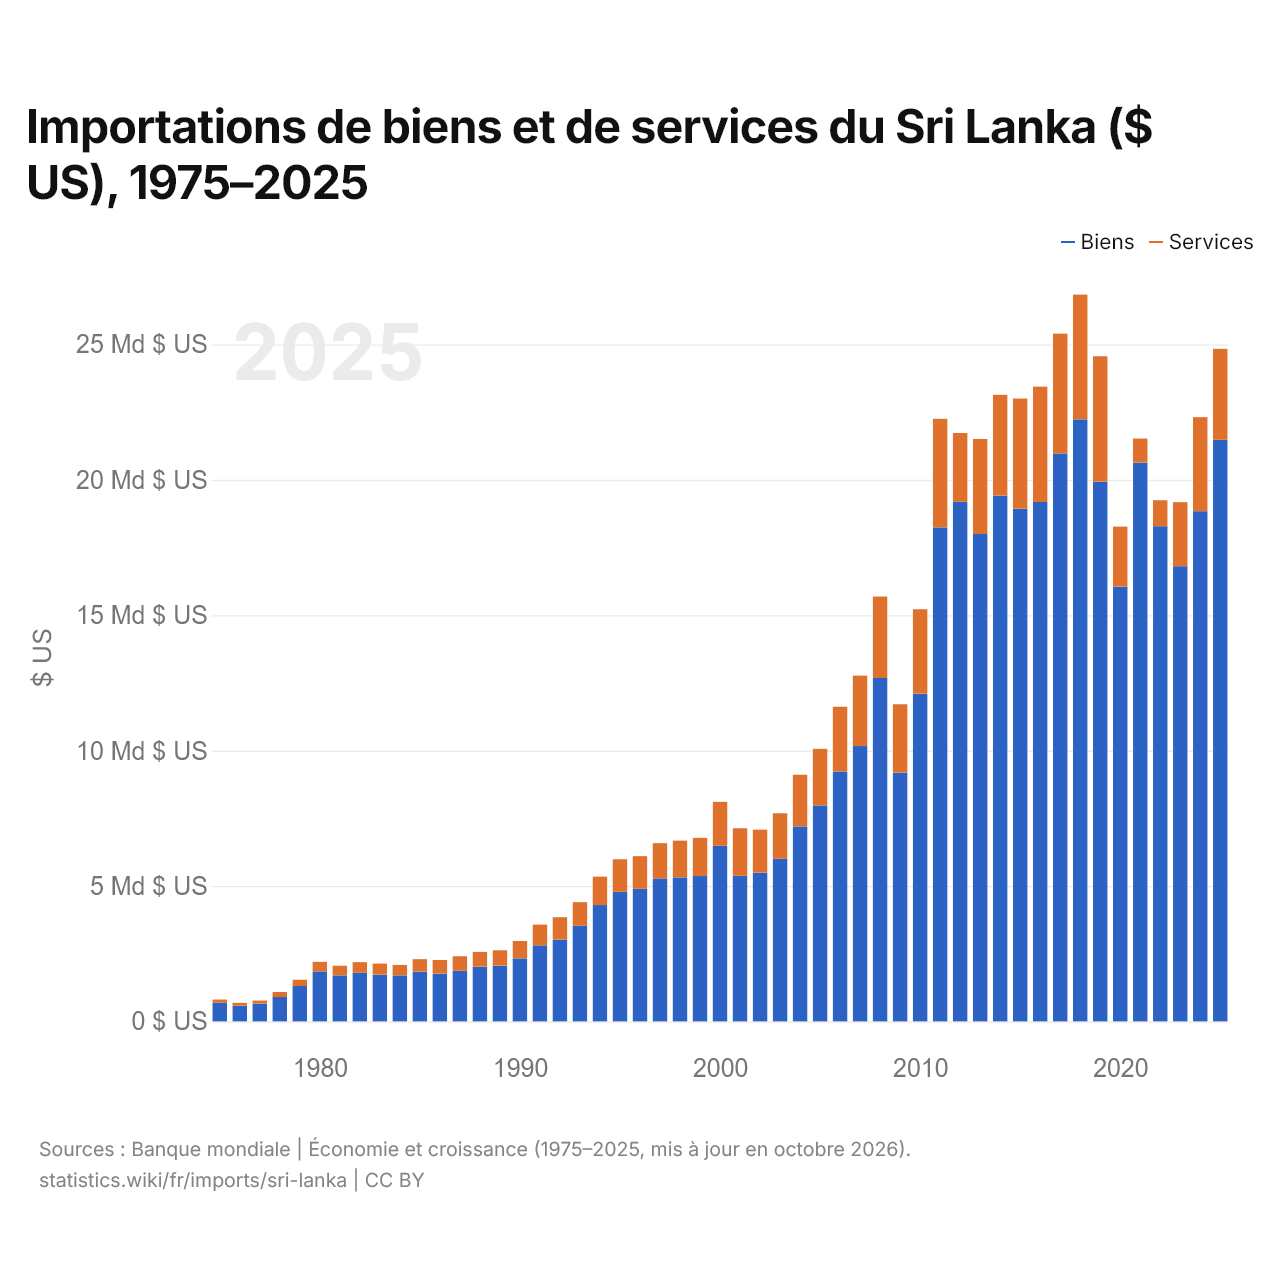
Importations de biens et de services du Sri Lanka ($ US), 1975–2025
| Année | $ US | |
|---|---|---|
| Biens | Services | |
| 2025 | 21 479 939 761 $ US | 3 358 538 181 $ US |
| 2024 | 18 841 414 436 $ US | 3 475 139 445 $ US |
| 2023 | 16 811 130 810 $ US | 2 363 329 766 $ US |
| 2022 | 18 291 016 521 $ US | 952 700 148 $ US |
| 2021 | 20 637 417 206 $ US | 888 616 000 $ US |
| 2020 | 16 055 375 878 $ US | 2 215 960 018 $ US |
| 2019 | 19 937 080 206 $ US | 4 624 910 000 $ US |
| 2018 | 22 232 726 809 $ US | 4 607 860 000 $ US |
| 2017 | 20 979 796 295 $ US | 4 421 432 705 $ US |
| 2016 | 19 182 844 730 $ US | 4 258 879 361 $ US |
| 2015 | 18 934 596 583 $ US | 4 071 880 011 $ US |
| 2014 | 19 416 766 445 $ US | 3 724 867 053 $ US |
| 2013 | 18 002 755 385 $ US | 3 505 234 576 $ US |
| 2012 | 19 190 203 466 $ US | 2 538 410 701 $ US |
| 2011 | 18 241 929 000 $ US | 4 011 921 000 $ US |
| 2010 | 12 105 855 000 $ US | 3 112 655 000 $ US |
| 2009 | 9 185 940 000 $ US | 2 522 460 000 $ US |
| 2008 | 12 682 080 000 $ US | 3 009 920 000 $ US |
| 2007 | 10 166 850 000 $ US | 2 601 750 000 $ US |
| 2006 | 9 227 610 000 $ US | 2 393 610 000 $ US |
| 2005 | 7 976 865 600 $ US | 2 088 704 090 $ US |
| 2004 | 7 199 829 000 $ US | 1 907 861 000 $ US |
| 2003 | 6 004 782 000 $ US | 1 679 068 000 $ US |
| 2002 | 5 495 040 000 $ US | 1 584 300 000 $ US |
| 2001 | 5 376 924 000 $ US | 1 749 466 000 $ US |
| 2000 | 6 483 560 837 $ US | 1 621 448 087 $ US |
| 1999 | 5 365 458 042 $ US | 1 413 683 665 $ US |
| 1998 | 5 313 401 640 $ US | 1 361 636 754 $ US |
| 1997 | 5 278 279 335 $ US | 1 302 600 714 $ US |
| 1996 | 4 894 950 499 $ US | 1 204 347 043 $ US |
| 1995 | 4 782 616 788 $ US | 1 199 109 661 $ US |
| 1994 | 4 293 368 802 $ US | 1 052 253 739 $ US |
| 1993 | 3 527 804 385 $ US | 874 336 004 $ US |
| 1992 | 3 016 455 972 $ US | 823 174 514 $ US |
| 1991 | 2 808 020 865 $ US | 762 494 100 $ US |
| 1990 | 2 325 550 654 $ US | 639 161 901 $ US |
| 1989 | 2 055 147 363 $ US | 565 812 705 $ US |
| 1988 | 2 017 541 269 $ US | 547 125 472 $ US |
| 1987 | 1 866 020 954 $ US | 533 221 392 $ US |
| 1986 | 1 764 263 629 $ US | 499 707 542 $ US |
| 1985 | 1 838 465 709 $ US | 457 126 713 $ US |
| 1984 | 1 698 726 836 $ US | 383 505 426 $ US |
| 1983 | 1 725 591 793 $ US | 407 253 381 $ US |
| 1982 | 1 794 298 462 $ US | 390 597 525 $ US |
| 1981 | 1 694 474 784 $ US | 359 224 182 $ US |
| 1980 | 1 845 133 672 $ US | 351 428 497 $ US |
| 1979 | 1 304 308 619 $ US | 232 840 961 $ US |
| 1978 | 898 657 694 $ US | 181 512 787 $ US |
| 1977 | 655 077 080 $ US | 113 726 227 $ US |
| 1976 | 579 529 244 $ US | 103 423 680 $ US |
| 1975 | 686 154 651 $ US | 117 451 181 $ US |
En 2025, les importations de biens du Sri Lanka s'élevaient à 21,5 milliards de dollars et celles de services à 3,36 milliards de dollars ; les services représentaient 13,5 % du total, contre 14,6 % en 1975.
Le Sri Lanka dans le classement mondial des importations, 2025
| Rang | Pays | Importations | Part mondiale | |
|---|---|---|---|---|
| 85 |
 Azerbaïdjan |
28,0 Md $US | 0,08 % | |
| 86 |
 Malte |
27,7 Md $US | 0,08 % | |
| 87 |
 Éthiopie |
25,5 Md $US | 0,08 % | |
| 88 |
 Sri Lanka |
24,9 Md $US | 0,07 % | |
| 89 |
 Côte d’Ivoire |
24,7 Md $US | 0,07 % | |
| 90 |
 Honduras |
22,4 Md $US | 0,07 % | |
| 91 |
 Salvador |
20,6 Md $US | 0,06 % |
Importations de biens et services du Sri Lanka, % du PIB, 1960–2025
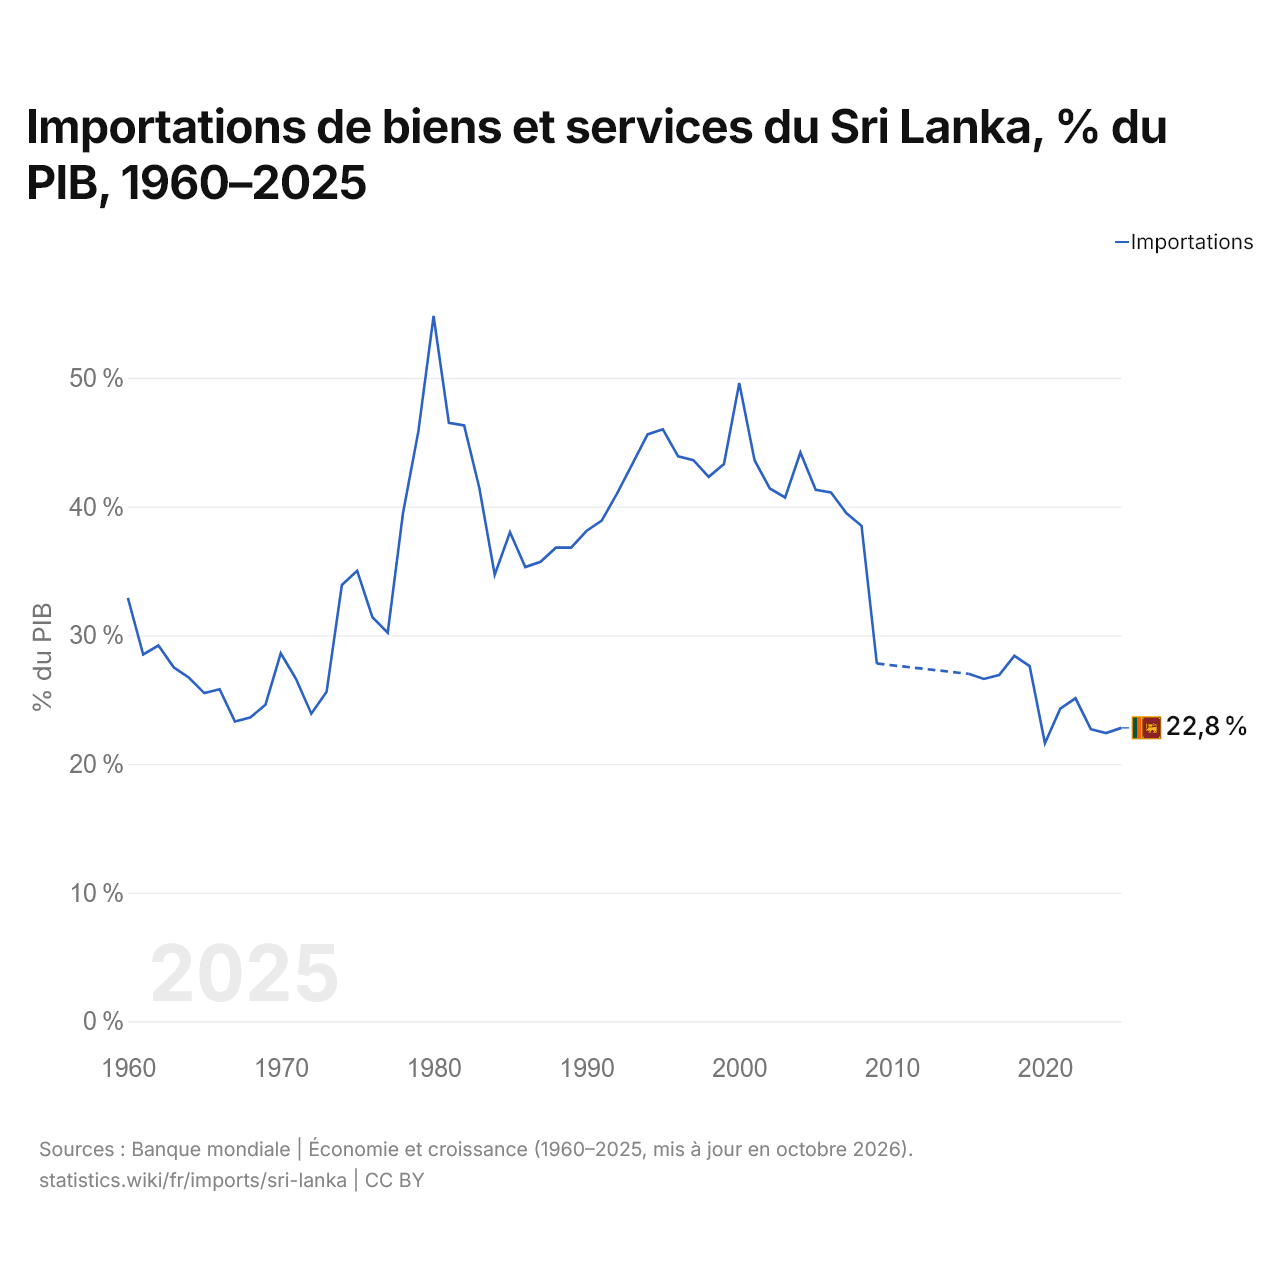
En 2025, les importations de biens et services du Sri Lanka équivalaient à 22,8 % de son PIB, contre 32,9 % en 1960. La part la plus élevée a été de 54,8 %, en 1980.
Comparer les importations du Sri Lanka avec celles d'autres pays
Sources :
- TradeMap (2001–2025, mis à jour en octobre 2026)
- Banque mondiale | Économie et croissance (1960–2025, mis à jour en octobre 2026)
Creative Commons Attribution (CC BY) : vous pouvez copier, partager, adapter et réutiliser ce contenu, y compris à des fins commerciales, à condition de citer statistics.wiki et d’indiquer les modifications apportées. Les sources citées ci-dessus peuvent avoir leurs propres conditions de licence.