
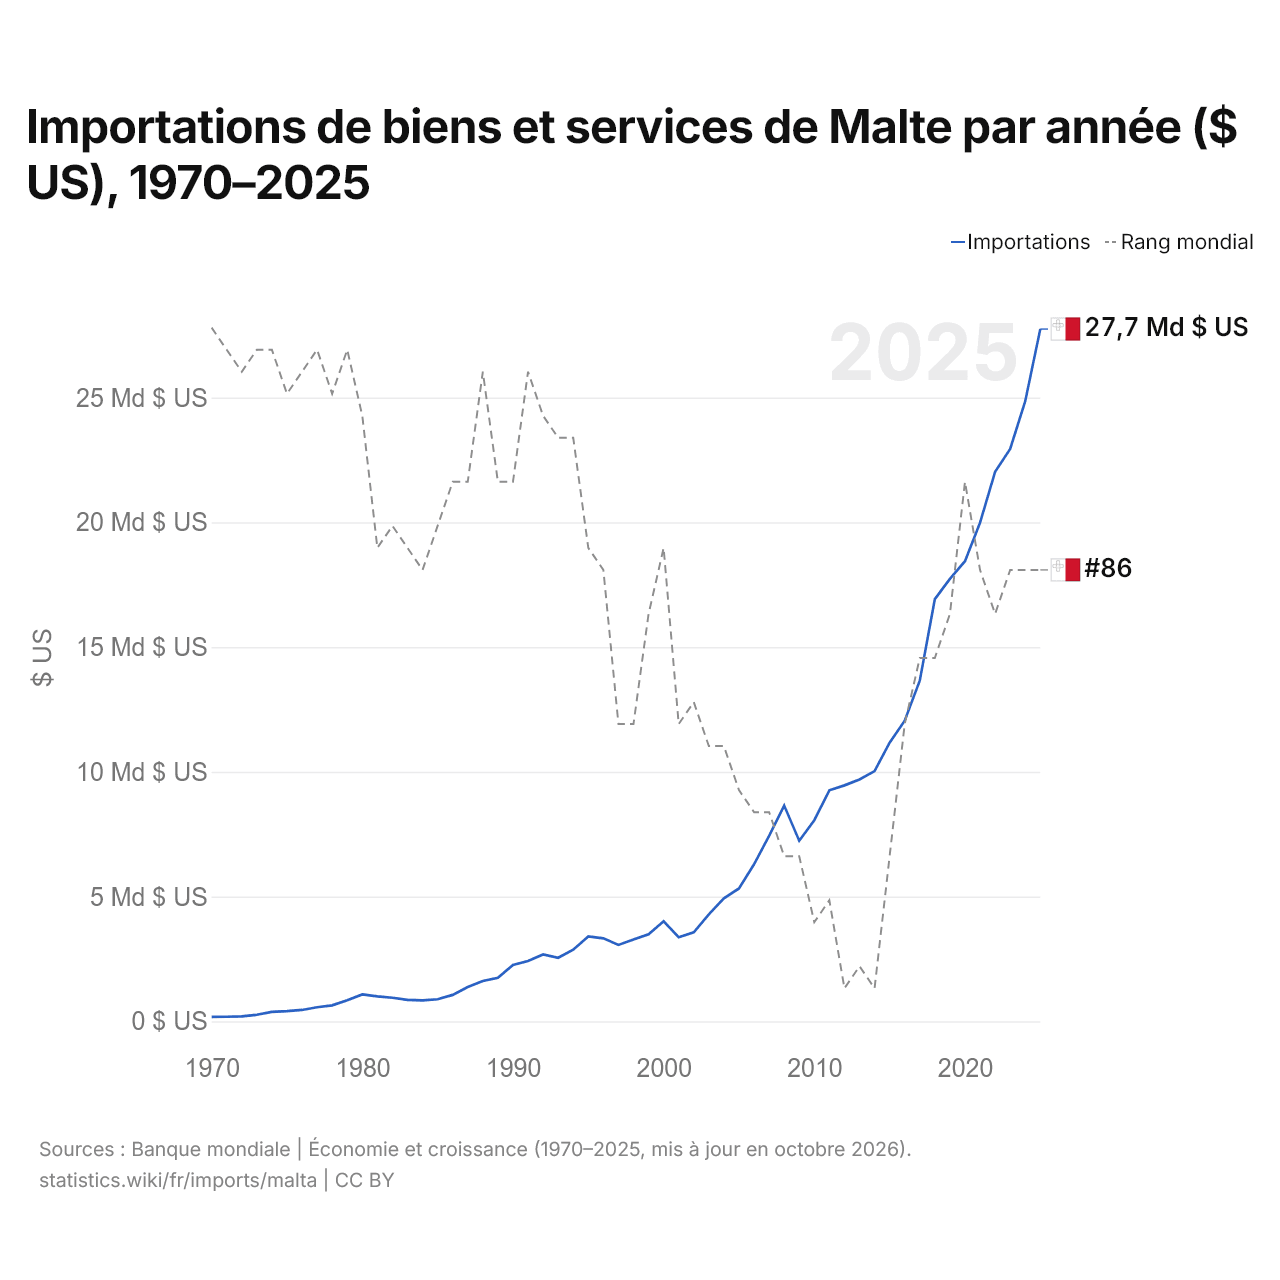
Importations de biens et services de Malte par année ($ US), 1970–2025
| Année | $ US | Rang mondial |
|---|---|---|
| Importations | Rang mondial | |
| 2025 | 27 745 379 956 $ US | #86 |
| 2024 | 24 854 594 466 $ US | #86 |
| 2023 | 22 938 681 424 $ US | #86 |
| 2022 | 22 022 511 474 $ US | #88 |
| 2021 | 19 984 289 923 $ US | #86 |
| 2020 | 18 439 993 420 $ US | #82 |
| 2019 | 17 734 735 447 $ US | #88 |
| 2018 | 16 920 969 059 $ US | #90 |
| 2017 | 13 654 552 290 $ US | #90 |
| 2016 | 12 049 012 192 $ US | #93 |
| 2015 | 11 166 531 275 $ US | #99 |
| 2014 | 10 030 086 465 $ US | #105 |
| 2013 | 9 691 474 026 $ US | #104 |
| 2012 | 9 457 192 841 $ US | #105 |
| 2011 | 9 259 383 640 $ US | #101 |
| 2010 | 8 060 784 214 $ US | #102 |
| 2009 | 7 237 267 534 $ US | #99 |
| 2008 | 8 647 474 150 $ US | #99 |
| 2007 | 7 432 155 048 $ US | #97 |
| 2006 | 6 294 551 152 $ US | #97 |
| 2005 | 5 327 158 882 $ US | #96 |
| 2004 | 4 931 687 777 $ US | #94 |
| 2003 | 4 286 857 202 $ US | #94 |
| 2002 | 3 564 380 673 $ US | #92 |
| 2001 | 3 373 407 420 $ US | #93 |
| 2000 | 4 009 843 673 $ US | #85 |
| 1999 | 3 490 789 328 $ US | #88 |
| 1998 | 3 277 703 795 $ US | #93 |
| 1997 | 3 062 882 525 $ US | #93 |
| 1996 | 3 325 052 523 $ US | #86 |
| 1995 | 3 403 060 289 $ US | #85 |
| 1994 | 2 870 772 300 $ US | #80 |
| 1993 | 2 549 168 272 $ US | #80 |
| 1992 | 2 680 639 043 $ US | #79 |
| 1991 | 2 416 501 185 $ US | #77 |
| 1990 | 2 258 209 772 $ US | #82 |
| 1989 | 1 747 219 221 $ US | #82 |
| 1988 | 1 613 848 907 $ US | #77 |
| 1987 | 1 374 200 122 $ US | #82 |
| 1986 | 1 059 411 575 $ US | #82 |
| 1985 | 884 760 856 $ US | #84 |
| 1984 | 842 618 870 $ US | #86 |
| 1983 | 858 657 092 $ US | #85 |
| 1982 | 945 120 902 $ US | #84 |
| 1981 | 1 001 899 928 $ US | #85 |
| 1980 | 1 080 252 117 $ US | #79 |
| 1979 | 847 283 865 $ US | #76 |
| 1978 | 639 161 771 $ US | #78 |
| 1977 | 565 691 419 $ US | #76 |
| 1976 | 456 620 115 $ US | #77 |
| 1975 | 409 749 036 $ US | #78 |
| 1974 | 380 144 800 $ US | #76 |
| 1973 | 262 363 383 $ US | #76 |
| 1972 | 199 075 306 $ US | #77 |
| 1971 | 182 398 279 $ US | #76 |
| 1970 | 178 917 093 $ US | #75 |
En 2025, les importations de biens et services de Malte s'élevaient à 27,7 milliards de dollars, contre 179 millions de dollars en 1970. Elles se classaient au 86e rang mondial, un rang qu'elles occupent depuis 2023. Leur meilleur rang a été le 75e, occupé pour la dernière fois en 1970.
En 2025, les importations de biens et services de Malte étaient les 34es plus élevées de 41 pays situés en Europe. En 2025, les exportations de Malte dépassaient ses importations de 5,33 milliards de dollars, soit un excédent commercial. Le commerce de Malte, exportations et importations réunies, équivalait à 219,0 % de son PIB en 2025, au 5e rang mondial.
Importations de biens de Malte par catégorie, 2025
Importations de biens, 2025: 9,23 Md $US
En 2025, la première catégorie des importations de biens de Malte était « machines, électronique et véhicules », avec 38,9 %, suivie de « pétrole, gaz, minerais et autres matières premières », avec 20,6 %.
Origines des importations de biens de Malte : les 10 premières, 2025
| Rang | Pays | Importations de biens | Part | |
|---|---|---|---|---|
| 1 |
 Italie |
1,98 Md $US | 21,5 % | |
| 2 |
 France |
1,13 Md $US | 12,3 % | vs France |
| 3 |
 Espagne |
735 M $US | 7,96 % | |
| 4 |
 Pays-Bas |
591 M $US | 6,41 % | |
| 5 |
 Allemagne |
500 M $US | 5,42 % | |
| 6 |
 Royaume-Uni |
498 M $US | 5,39 % | |
| 7 |
 Chine |
422 M $US | 4,57 % | |
| 8 |
 Inde |
395 M $US | 4,28 % | |
| 9 |
 Turquie |
251 M $US | 2,72 % | |
| 10 |
 États-Unis |
216 M $US | 2,34 % | |
| Autres partenaires et non précisés | 2,51 Md $US | 27,2 % |
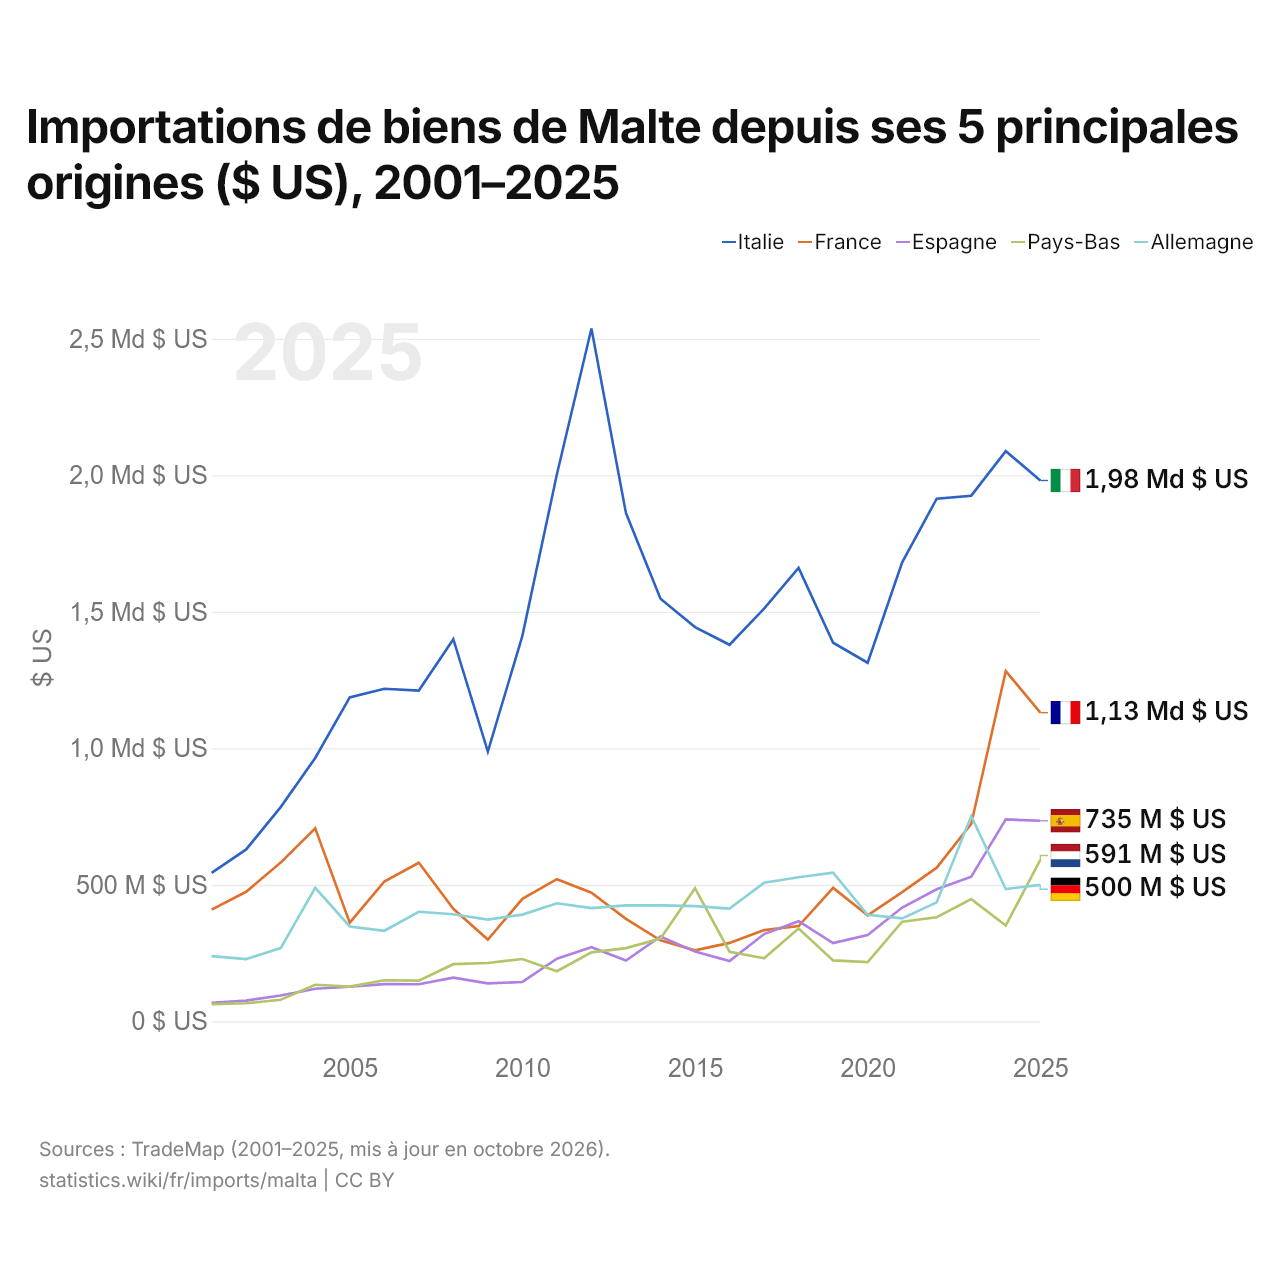
Importations de biens de Malte depuis ses 5 principales origines ($ US), 2001–2025
| Année | $ US | ||||
|---|---|---|---|---|---|
| Italie | France | Espagne | Pays-Bas | Allemagne | |
| 2025 | 1 980 635 000 $ US | 1 130 484 000 $ US | 734 504 000 $ US | 591 192 000 $ US | 499 927 000 $ US |
| 2024 | 2 088 269 000 $ US | 1 282 587 000 $ US | 739 459 000 $ US | 350 588 000 $ US | 484 678 000 $ US |
| 2023 | 1 924 926 000 $ US | 722 802 000 $ US | 529 687 000 $ US | 447 428 000 $ US | 751 618 000 $ US |
| 2022 | 1 913 982 000 $ US | 562 598 000 $ US | 483 754 000 $ US | 381 315 000 $ US | 435 688 000 $ US |
| 2021 | 1 681 253 000 $ US | 472 965 000 $ US | 416 736 000 $ US | 364 798 000 $ US | 376 901 000 $ US |
| 2020 | 1 313 055 000 $ US | 388 265 000 $ US | 316 053 000 $ US | 216 976 000 $ US | 390 229 000 $ US |
| 2019 | 1 386 554 000 $ US | 488 623 000 $ US | 286 422 000 $ US | 223 237 000 $ US | 544 116 000 $ US |
| 2018 | 1 660 393 000 $ US | 348 861 000 $ US | 366 857 000 $ US | 339 755 000 $ US | 527 470 000 $ US |
| 2017 | 1 511 437 000 $ US | 333 899 000 $ US | 319 465 000 $ US | 230 899 000 $ US | 507 771 000 $ US |
| 2016 | 1 378 968 000 $ US | 287 216 000 $ US | 220 684 000 $ US | 255 006 000 $ US | 412 498 000 $ US |
| 2015 | 1 443 712 000 $ US | 259 983 000 $ US | 255 353 000 $ US | 487 113 000 $ US | 421 791 000 $ US |
| 2014 | 1 547 797 000 $ US | 296 849 000 $ US | 310 727 000 $ US | 303 105 000 $ US | 424 646 000 $ US |
| 2013 | 1 861 187 000 $ US | 375 196 000 $ US | 222 680 000 $ US | 268 078 000 $ US | 424 776 000 $ US |
| 2012 | 2 537 450 000 $ US | 471 234 000 $ US | 271 727 000 $ US | 252 653 000 $ US | 414 817 000 $ US |
| 2011 | 2 003 559 000 $ US | 520 696 000 $ US | 229 706 000 $ US | 183 521 000 $ US | 432 301 000 $ US |
| 2010 | 1 411 603 000 $ US | 448 295 000 $ US | 144 075 000 $ US | 228 206 000 $ US | 390 905 000 $ US |
| 2009 | 987 777 000 $ US | 299 284 000 $ US | 139 138 000 $ US | 213 670 000 $ US | 372 396 000 $ US |
| 2008 | 1 399 403 000 $ US | 412 045 000 $ US | 159 797 000 $ US | 209 256 000 $ US | 392 298 000 $ US |
| 2007 | 1 211 498 000 $ US | 580 611 000 $ US | 135 946 000 $ US | 149 068 000 $ US | 401 361 000 $ US |
| 2006 | 1 217 826 000 $ US | 511 556 000 $ US | 136 142 000 $ US | 150 345 000 $ US | 331 624 000 $ US |
| 2005 | 1 186 319 000 $ US | 361 204 000 $ US | 126 516 000 $ US | 126 976 000 $ US | 347 302 000 $ US |
| 2004 | 964 560 000 $ US | 706 678 000 $ US | 119 495 000 $ US | 133 840 000 $ US | 489 090 000 $ US |
| 2003 | 784 433 000 $ US | 581 304 000 $ US | 94 550 000 $ US | 78 849 000 $ US | 268 185 000 $ US |
| 2002 | 629 456 000 $ US | 474 565 000 $ US | 75 800 000 $ US | 66 069 000 $ US | 227 941 000 $ US |
| 2001 | 543 442 000 $ US | 409 076 000 $ US | 68 162 000 $ US | 63 117 000 $ US | 238 757 000 $ US |
En 2025, les importations de biens s'élevaient à 1,98 milliard de dollars en provenance de l'Italie, 1,13 milliard de dollars en provenance de la France, 735 millions de dollars en provenance de l'Espagne, 591 millions de dollars en provenance des Pays-Bas et 500 millions de dollars en provenance de l'Allemagne. Le premier rang des cinq fournisseurs de Malte est occupé par l'Italie chaque année depuis 2001. Le changement le plus récent dans leur ordre remonte à 2025, quand les importations de Malte en provenance des Pays-Bas ont dépassé celles en provenance de l'Allemagne.
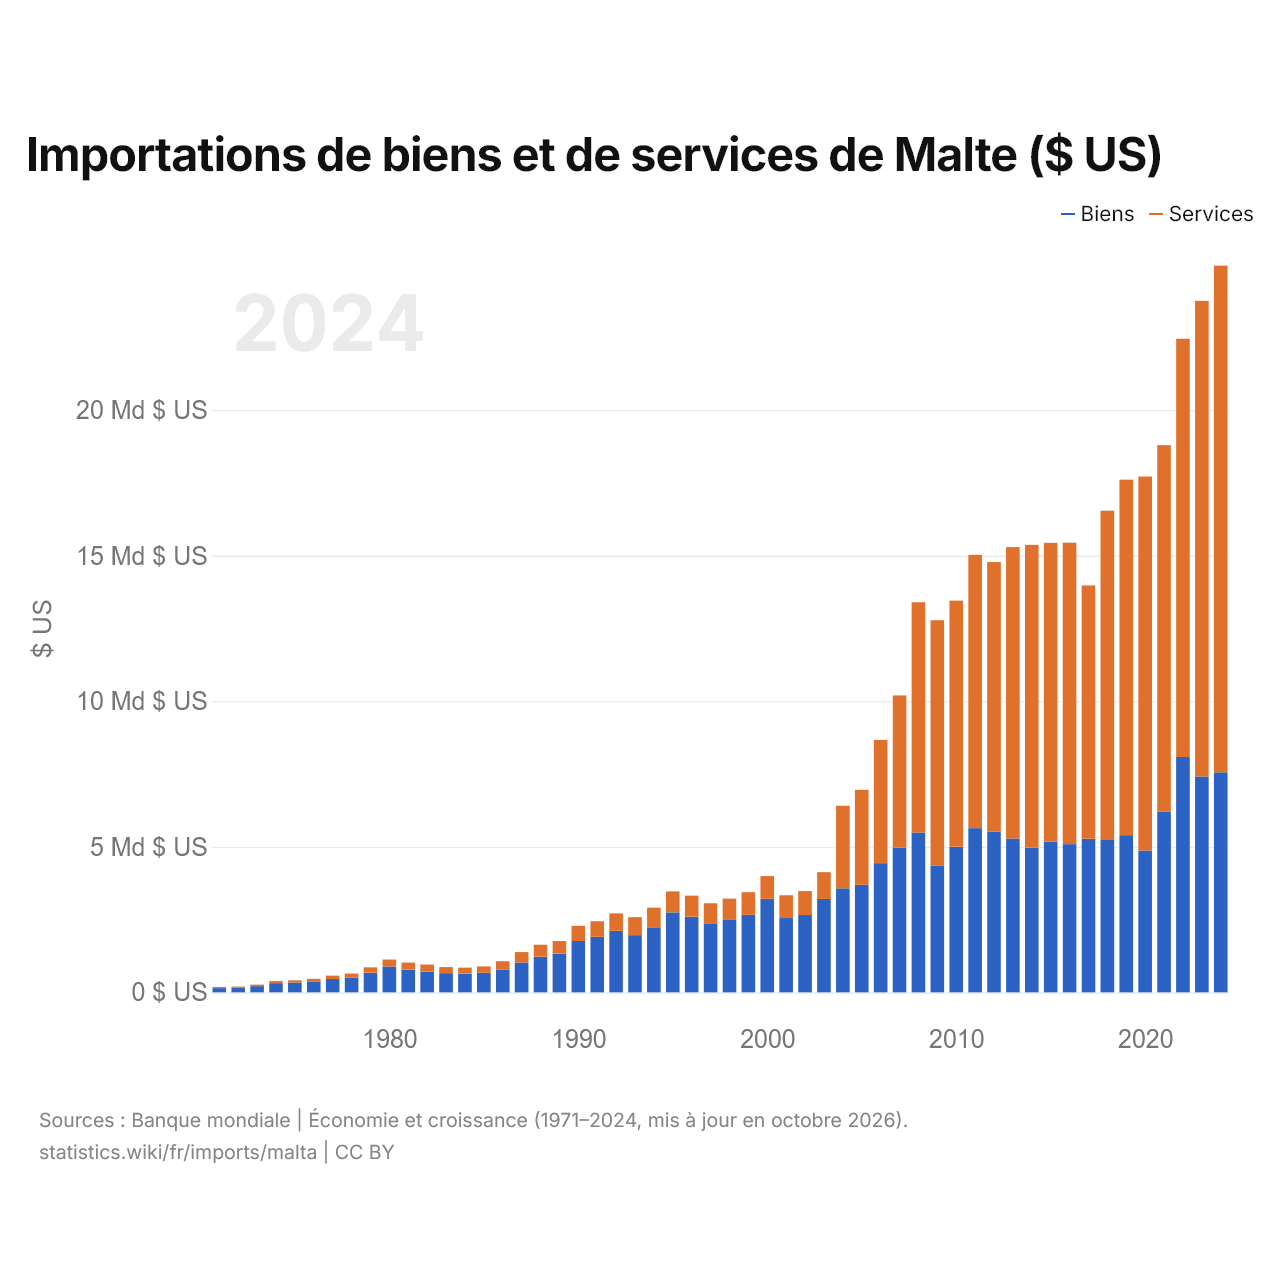
Importations de biens et de services de Malte ($ US)
| Année | $ US | |
|---|---|---|
| Biens | Services | |
| 2024 | 7 557 486 140 $ US | 17 400 763 254 $ US |
| 2023 | 7 410 112 875 $ US | 16 339 724 521 $ US |
| 2022 | 8 083 958 957 $ US | 14 364 987 124 $ US |
| 2021 | 6 200 003 209 $ US | 12 594 895 122 $ US |
| 2020 | 4 872 743 595 $ US | 12 841 893 852 $ US |
| 2019 | 5 398 064 781 $ US | 12 209 297 114 $ US |
| 2018 | 5 232 560 589 $ US | 11 309 530 481 $ US |
| 2017 | 5 277 163 408 $ US | 8 698 894 623 $ US |
| 2016 | 5 091 039 513 $ US | 10 352 043 114 $ US |
| 2015 | 5 176 817 494 $ US | 10 260 961 208 $ US |
| 2014 | 4 965 782 023 $ US | 10 402 811 156 $ US |
| 2013 | 5 283 837 315 $ US | 10 010 298 565 $ US |
| 2012 | 5 525 458 502 $ US | 9 252 863 031 $ US |
| 2011 | 5 639 000 572 $ US | 9 386 180 677 $ US |
| 2010 | 5 001 408 115 $ US | 8 453 090 404 $ US |
| 2009 | 4 361 121 107 $ US | 8 417 335 108 $ US |
| 2008 | 5 485 767 949 $ US | 7 913 425 257 $ US |
| 2007 | 4 974 224 931 $ US | 5 224 192 849 $ US |
| 2006 | 4 436 435 664 $ US | 4 233 187 802 $ US |
| 2005 | 3 691 070 046 $ US | 3 263 222 082 $ US |
| 2004 | 3 572 494 130 $ US | 2 836 705 389 $ US |
| 2003 | 3 208 685 496 $ US | 917 667 934 $ US |
| 2002 | 2 655 394 034 $ US | 823 541 529 $ US |
| 2001 | 2 550 651 220 $ US | 784 046 240 $ US |
| 2000 | 3 212 074 669 $ US | 781 113 862 $ US |
| 1999 | 2 660 379 601 $ US | 781 324 541 $ US |
| 1998 | 2 486 828 137 $ US | 730 340 620 $ US |
| 1997 | 2 372 053 188 $ US | 687 578 820 $ US |
| 1996 | 2 597 205 614 $ US | 724 236 632 $ US |
| 1995 | 2 746 898 622 $ US | 719 825 879 $ US |
| 1994 | 2 211 477 573 $ US | 696 071 248 $ US |
| 1993 | 1 965 908 893 $ US | 614 722 880 $ US |
| 1992 | 2 112 952 956 $ US | 598 520 020 $ US |
| 1991 | 1 906 717 093 $ US | 535 300 896 $ US |
| 1990 | 1 763 686 711 $ US | 519 736 304 $ US |
| 1989 | 1 327 718 674 $ US | 433 294 834 $ US |
| 1988 | 1 222 281 552 $ US | 412 263 115 $ US |
| 1987 | 1 024 626 740 $ US | 358 908 801 $ US |
| 1986 | 786 529 005 $ US | 280 412 476 $ US |
| 1985 | 672 059 341 $ US | 218 477 902 $ US |
| 1984 | 639 215 099 $ US | 209 745 843 $ US |
| 1983 | 659 499 480 $ US | 207 191 983 $ US |
| 1982 | 709 220 720 $ US | 246 031 410 $ US |
| 1981 | 778 120 901 $ US | 243 599 165 $ US |
| 1980 | 884 702 979 $ US | 242 888 023 $ US |
| 1979 | 674 254 472 $ US | 184 115 826 $ US |
| 1978 | 507 287 118 $ US | 140 120 227 $ US |
| 1977 | 456 774 363 $ US | 114 844 772 $ US |
| 1976 | 376 585 524 $ US | 85 854 913 $ US |
| 1975 | 332 394 855 $ US | 80 045 047 $ US |
| 1974 | 313 633 593 $ US | 73 155 230 $ US |
| 1973 | 212 854 419 $ US | 51 790 056 $ US |
| 1972 | 155 931 967 $ US | 44 551 991 $ US |
| 1971 | 141 977 233 $ US | 41 758 010 $ US |
Les importations de biens de Malte s'élèvent à 7,56 milliards de dollars (2024) et celles de services à 17,4 milliards de dollars ; les services représentent 69,7 % du total, contre 22,7 % en 1971.
Malte dans le classement mondial des importations, 2025
| Rang | Pays | Importations | Part mondiale | |
|---|---|---|---|---|
| 83 |
 Kenya |
29,6 Md $US | 0,09 % | |
| 84 |
 Ghana |
28,2 Md $US (2024) | 0,09 % | |
| 85 |
 Azerbaïdjan |
28,0 Md $US | 0,08 % | |
| 86 |
 Malte |
27,7 Md $US | 0,08 % | |
| 87 |
 Éthiopie |
25,5 Md $US | 0,08 % | |
| 88 |
 Sri Lanka |
24,9 Md $US | 0,07 % | |
| 89 |
 Côte d’Ivoire |
24,7 Md $US | 0,07 % |
Importations de biens et services de Malte, % du PIB, 1970–2025
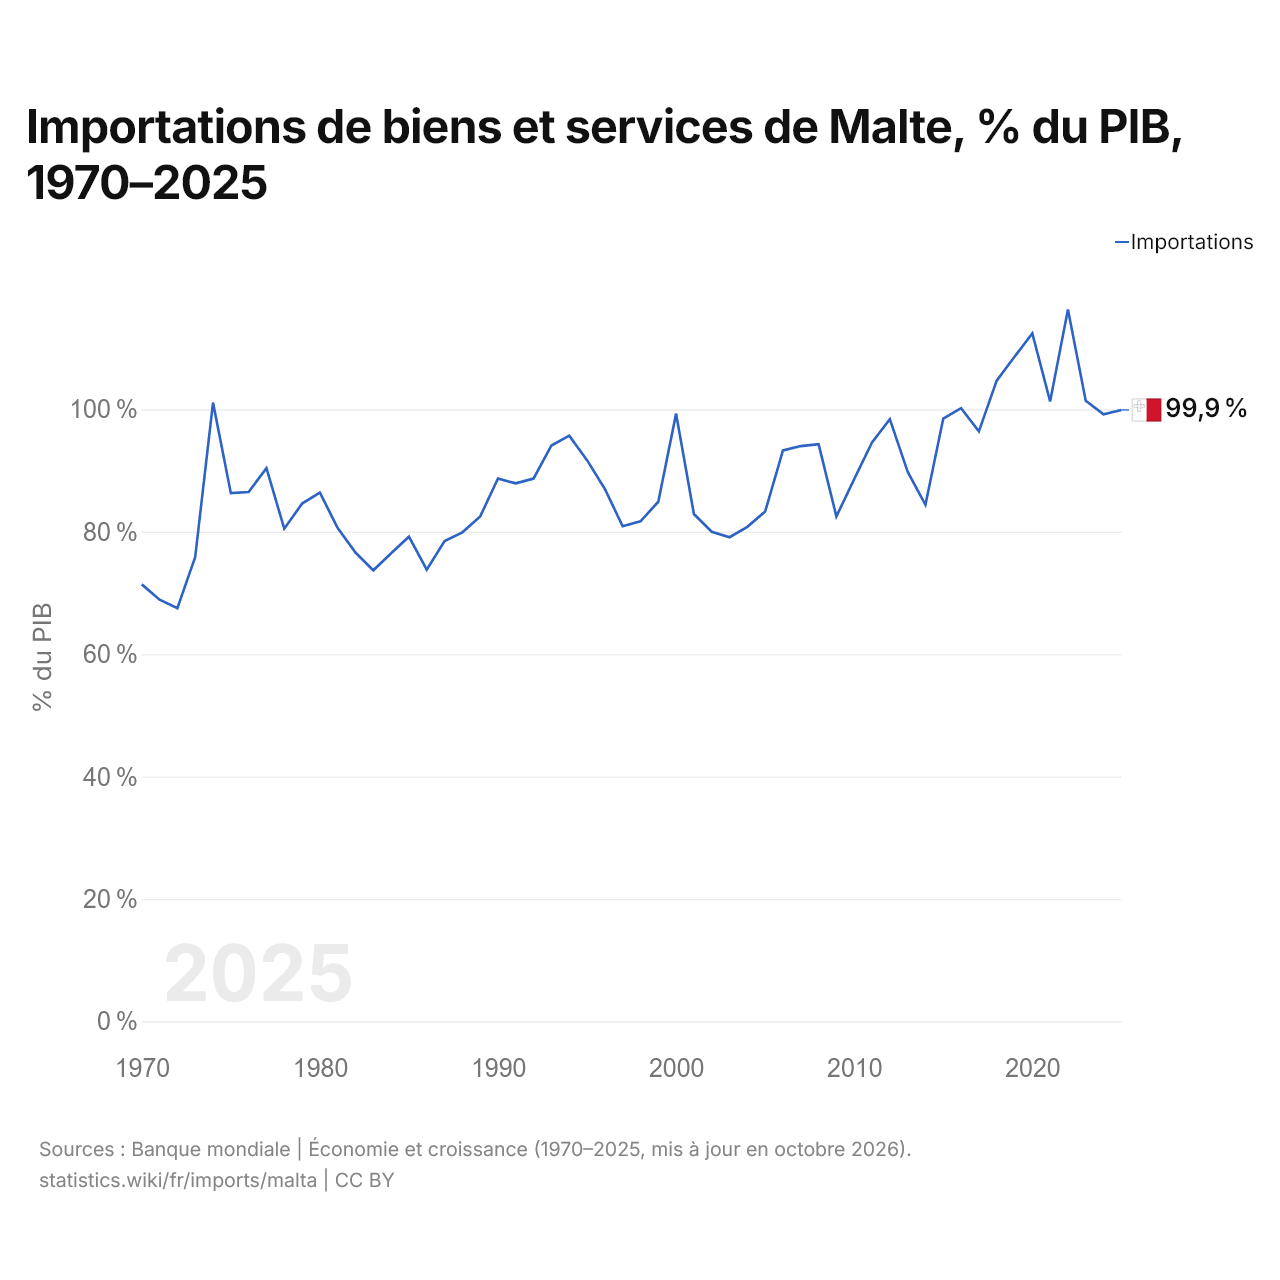
En 2025, les importations de biens et services de Malte équivalaient à 99,9 % de son PIB, contre 71,4 % en 1970. La part la plus élevée a été de 116,3 %, en 2022.
Comparer les importations de Malte avec celles d'autres pays
Sources :
- Banque mondiale | Économie et croissance (1970–2025, mis à jour en octobre 2026)
- TradeMap (2001–2025, mis à jour en octobre 2026)
Creative Commons Attribution (CC BY) : vous pouvez copier, partager, adapter et réutiliser ce contenu, y compris à des fins commerciales, à condition de citer statistics.wiki et d’indiquer les modifications apportées. Les sources citées ci-dessus peuvent avoir leurs propres conditions de licence.