
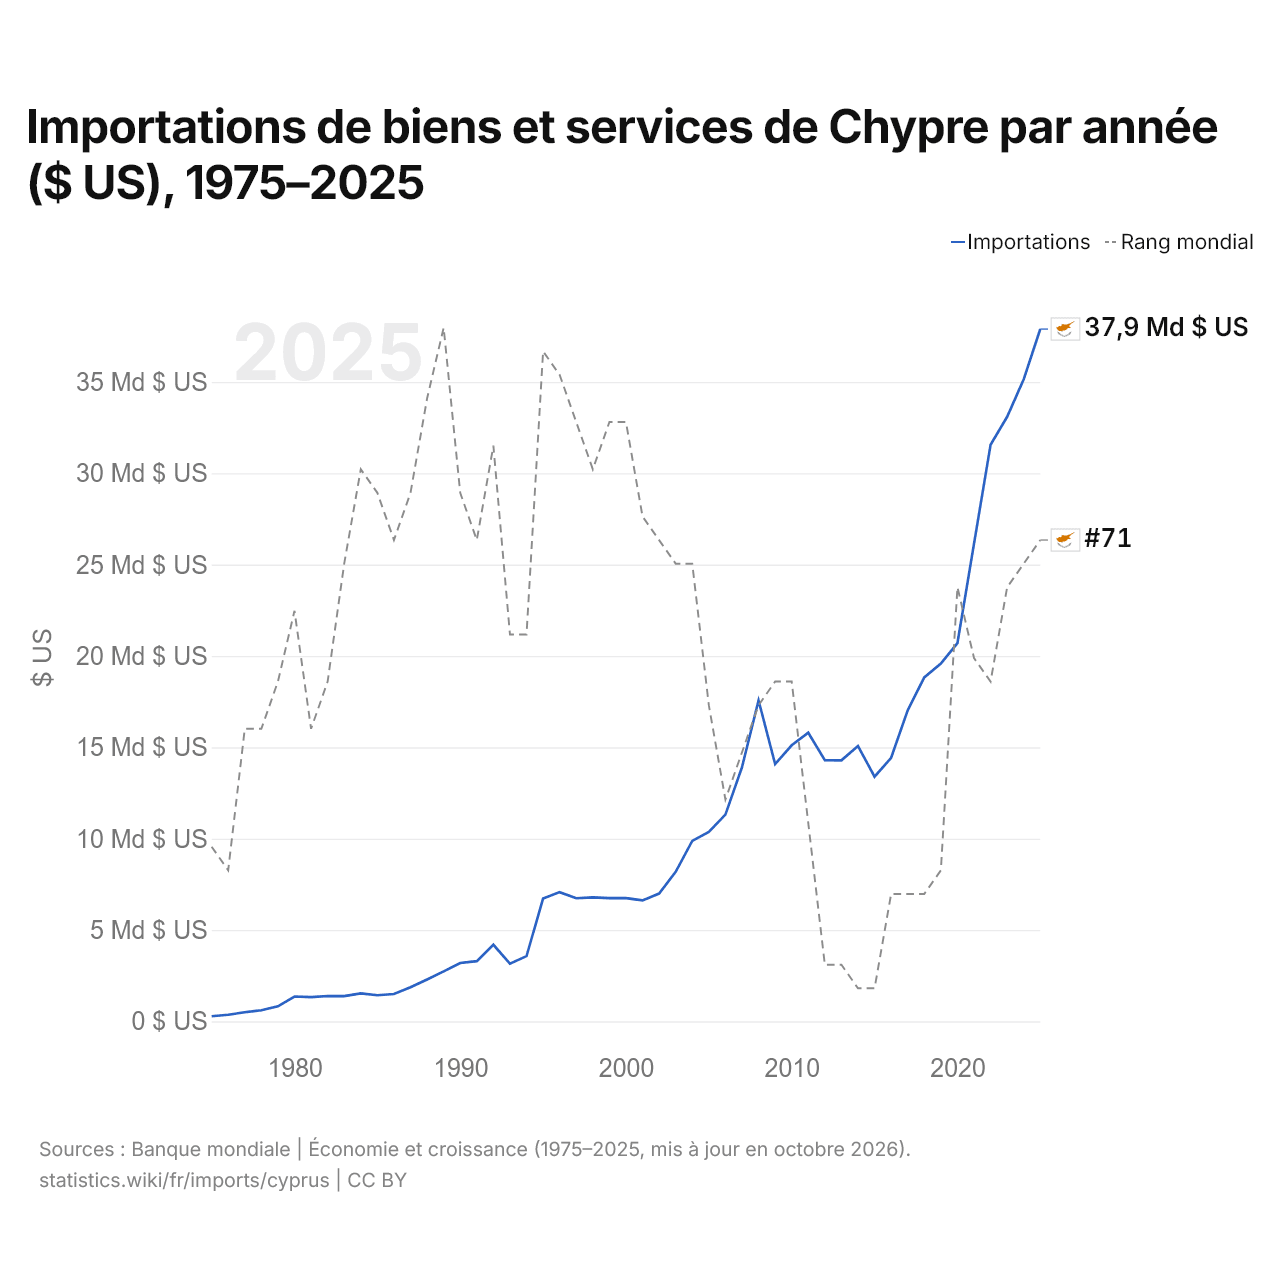
Importations de biens et services de Chypre par année ($ US), 1975–2025
| Année | $ US | Rang mondial |
|---|---|---|
| Importations | Rang mondial | |
| 2025 | 37 895 679 483 $ US | #71 |
| 2024 | 35 144 136 154 $ US | #72 |
| 2023 | 33 094 024 493 $ US | #73 |
| 2022 | 31 557 528 864 $ US | #77 |
| 2021 | 26 141 699 845 $ US | #76 |
| 2020 | 20 705 101 713 $ US | #73 |
| 2019 | 19 581 296 225 $ US | #85 |
| 2018 | 18 829 384 343 $ US | #86 |
| 2017 | 17 021 058 793 $ US | #86 |
| 2016 | 14 424 827 082 $ US | #86 |
| 2015 | 13 390 799 838 $ US | #90 |
| 2014 | 15 071 911 809 $ US | #90 |
| 2013 | 14 287 081 058 $ US | #89 |
| 2012 | 14 293 541 211 $ US | #89 |
| 2011 | 15 800 753 606 $ US | #83 |
| 2010 | 15 110 295 846 $ US | #77 |
| 2009 | 14 083 954 983 $ US | #77 |
| 2008 | 17 570 233 132 $ US | #78 |
| 2007 | 13 905 730 906 $ US | #80 |
| 2006 | 11 315 149 918 $ US | #82 |
| 2005 | 10 364 178 585 $ US | #78 |
| 2004 | 9 875 106 250 $ US | #72 |
| 2003 | 8 181 782 559 $ US | #72 |
| 2002 | 6 993 294 231 $ US | #71 |
| 2001 | 6 617 244 991 $ US | #70 |
| 2000 | 6 743 650 330 $ US | #66 |
| 1999 | 6 748 355 987 $ US | #66 |
| 1998 | 6 785 841 629 $ US | #68 |
| 1997 | 6 738 597 491 $ US | #66 |
| 1996 | 7 072 548 306 $ US | #64 |
| 1995 | 6 717 504 528 $ US | #63 |
| 1994 | 3 570 773 571 $ US | #75 |
| 1993 | 3 158 397 055 $ US | #75 |
| 1992 | 4 191 531 291 $ US | #67 |
| 1991 | 3 294 451 136 $ US | #71 |
| 1990 | 3 192 962 740 $ US | #69 |
| 1989 | 2 732 346 864 $ US | #62 |
| 1988 | 2 289 354 454 $ US | #65 |
| 1987 | 1 862 396 346 $ US | #69 |
| 1986 | 1 496 618 983 $ US | #71 |
| 1985 | 1 429 846 929 $ US | #69 |
| 1984 | 1 528 712 762 $ US | #68 |
| 1983 | 1 382 085 651 $ US | #72 |
| 1982 | 1 387 106 289 $ US | #77 |
| 1981 | 1 321 842 817 $ US | #79 |
| 1980 | 1 358 664 013 $ US | #74 |
| 1979 | 821 755 787 $ US | #77 |
| 1978 | 606 583 588 $ US | #79 |
| 1977 | 497 964 860 $ US | #79 |
| 1976 | 360 768 050 $ US | #85 |
| 1975 | 277 744 158 $ US | #84 |
En 2025, les importations de biens et services de Chypre s'élevaient à 37,9 milliards de dollars, contre 278 millions de dollars en 1975. Elles se classaient au 71e rang mondial, en hausse par rapport au 72e rang en 2024. Leur meilleur rang a été le 62e, occupé pour la dernière fois en 1989.
En 2025, les importations de biens et services de Chypre étaient les 31es plus élevées de 41 pays situés en Europe. En 2025, les exportations de Chypre dépassaient ses importations de 2,33 milliards de dollars, soit un excédent commercial. Le commerce de Chypre, exportations et importations réunies, équivalait à 189,5 % de son PIB en 2025, au 10e rang mondial.
Importations de biens de Chypre par catégorie, 2025
Importations de biens, 2025: 15,7 Md $US
En 2025, la première catégorie des importations de biens de Chypre était « pétrole, gaz, minerais et autres matières premières », avec 27,3 %, suivie de « machines, électronique et véhicules », avec 26,4 %.
Origines des importations de biens de Chypre : les 10 premières, 2025
| Rang | Pays | Importations de biens | Part | |
|---|---|---|---|---|
| 1 |
 Grèce |
3,34 Md $US | 21,3 % | vs Grèce |
| 2 |
 Italie |
1,12 Md $US | 7,13 % | |
| 3 |
 Chine |
1,09 Md $US | 6,93 % | |
| 4 |
 Allemagne |
884 M $US | 5,64 % | |
| 5 |
 Arabie saoudite |
762 M $US | 4,86 % | |
| 6 |
 Espagne |
678 M $US | 4,33 % | |
| 7 |
 Pays-Bas |
663 M $US | 4,23 % | |
| 8 |
 Royaume-Uni |
478 M $US | 3,05 % | |
| 9 |
 Israël |
402 M $US | 2,56 % | vs Israël |
| 10 |
 Pologne |
372 M $US | 2,37 % | |
| Autres partenaires et non précisés | 5,89 Md $US | 37,6 % |
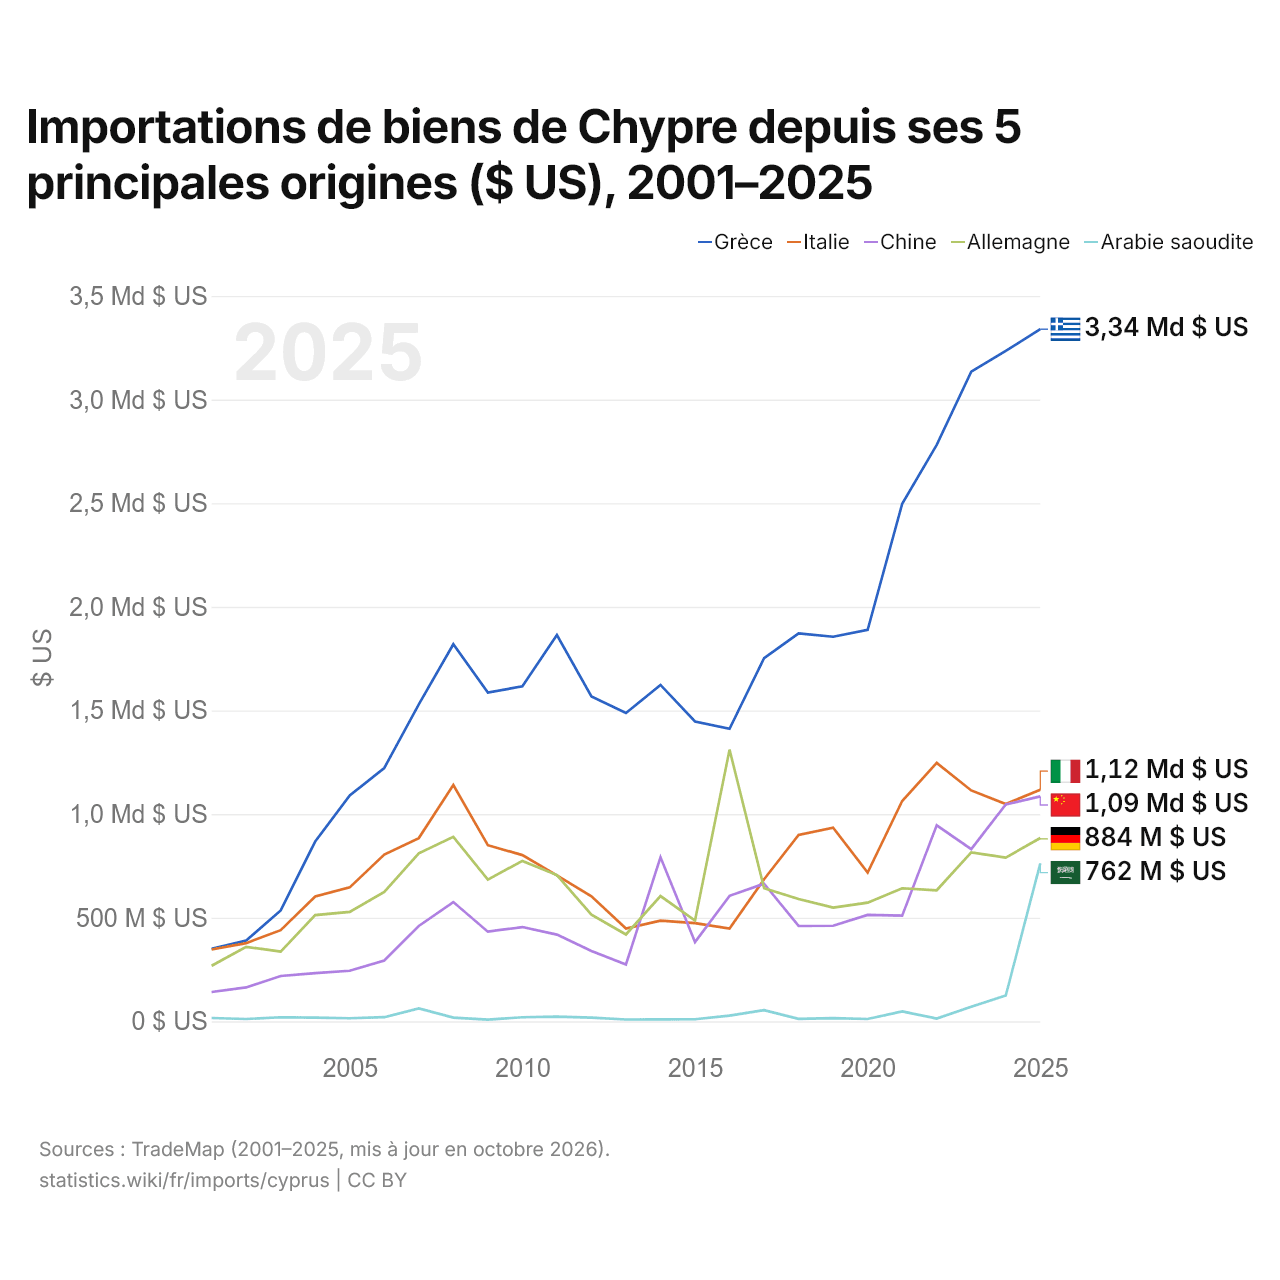
Importations de biens de Chypre depuis ses 5 principales origines ($ US), 2001–2025
| Année | $ US | ||||
|---|---|---|---|---|---|
| Grèce | Italie | Chine | Allemagne | Arabie saoudite | |
| 2025 | 3 339 587 000 $ US | 1 117 356 000 $ US | 1 085 358 000 $ US | 884 429 000 $ US | 761 818 000 $ US |
| 2024 | 3 235 067 000 $ US | 1 048 506 000 $ US | 1 046 130 000 $ US | 789 761 000 $ US | 124 560 000 $ US |
| 2023 | 3 134 615 000 $ US | 1 114 048 000 $ US | 830 712 000 $ US | 815 019 000 $ US | 70 673 000 $ US |
| 2022 | 2 780 994 000 $ US | 1 246 983 000 $ US | 945 836 000 $ US | 632 335 000 $ US | 13 328 000 $ US |
| 2021 | 2 497 069 000 $ US | 1 063 037 000 $ US | 509 866 000 $ US | 642 178 000 $ US | 48 151 000 $ US |
| 2020 | 1 889 215 000 $ US | 718 173 000 $ US | 513 755 000 $ US | 572 660 000 $ US | 11 185 000 $ US |
| 2019 | 1 855 624 000 $ US | 934 794 000 $ US | 461 258 000 $ US | 549 113 000 $ US | 15 750 000 $ US |
| 2018 | 1 871 665 000 $ US | 899 774 000 $ US | 460 033 000 $ US | 589 999 000 $ US | 11 674 000 $ US |
| 2017 | 1 752 731 000 $ US | 685 487 000 $ US | 663 865 000 $ US | 642 571 000 $ US | 54 184 000 $ US |
| 2016 | 1 411 403 000 $ US | 447 270 000 $ US | 605 532 000 $ US | 1 310 764 000 $ US | 27 227 000 $ US |
| 2015 | 1 446 812 000 $ US | 474 140 000 $ US | 382 106 000 $ US | 486 432 000 $ US | 9 924 000 $ US |
| 2014 | 1 623 241 000 $ US | 486 024 000 $ US | 791 705 000 $ US | 604 533 000 $ US | 9 068 000 $ US |
| 2013 | 1 487 745 000 $ US | 448 269 000 $ US | 274 032 000 $ US | 418 915 000 $ US | 8 698 000 $ US |
| 2012 | 1 567 318 000 $ US | 603 071 000 $ US | 339 702 000 $ US | 515 105 000 $ US | 17 996 000 $ US |
| 2011 | 1 863 825 000 $ US | 704 505 000 $ US | 418 248 000 $ US | 705 803 000 $ US | 22 898 000 $ US |
| 2010 | 1 616 341 000 $ US | 802 017 000 $ US | 454 869 000 $ US | 774 028 000 $ US | 19 554 000 $ US |
| 2009 | 1 586 595 000 $ US | 849 810 000 $ US | 432 659 000 $ US | 683 972 000 $ US | 7 995 000 $ US |
| 2008 | 1 819 348 000 $ US | 1 140 014 000 $ US | 575 574 000 $ US | 890 361 000 $ US | 17 895 000 $ US |
| 2007 | 1 529 622 000 $ US | 884 067 000 $ US | 460 161 000 $ US | 810 782 000 $ US | 62 414 000 $ US |
| 2006 | 1 222 283 000 $ US | 804 637 000 $ US | 293 446 000 $ US | 624 217 000 $ US | 19 994 000 $ US |
| 2005 | 1 090 163 000 $ US | 646 401 000 $ US | 244 049 000 $ US | 527 955 000 $ US | 14 698 000 $ US |
| 2004 | 867 574 000 $ US | 602 570 000 $ US | 232 496 000 $ US | 512 730 000 $ US | 18 023 000 $ US |
| 2003 | 535 082 000 $ US | 439 955 000 $ US | 219 000 000 $ US | 336 064 000 $ US | 19 543 000 $ US |
| 2002 | 389 603 000 $ US | 377 235 000 $ US | 163 604 000 $ US | 359 337 000 $ US | 11 415 000 $ US |
| 2001 | 349 554 000 $ US | 346 427 000 $ US | 141 320 000 $ US | 268 068 000 $ US | 16 240 000 $ US |
En 2025, les importations de biens s'élevaient à 3,34 milliards de dollars en provenance de la Grèce, 1,12 milliard de dollars en provenance de l'Italie, 1,09 milliard de dollars en provenance de la Chine, 884 millions de dollars en provenance de l'Allemagne et 762 millions de dollars en provenance de l'Arabie saoudite. Le premier rang des cinq fournisseurs de Chypre est occupé par la Grèce chaque année depuis 2001. Le changement le plus récent dans leur ordre remonte à 2022, quand les importations de Chypre en provenance de la Chine ont dépassé celles en provenance de l'Allemagne.
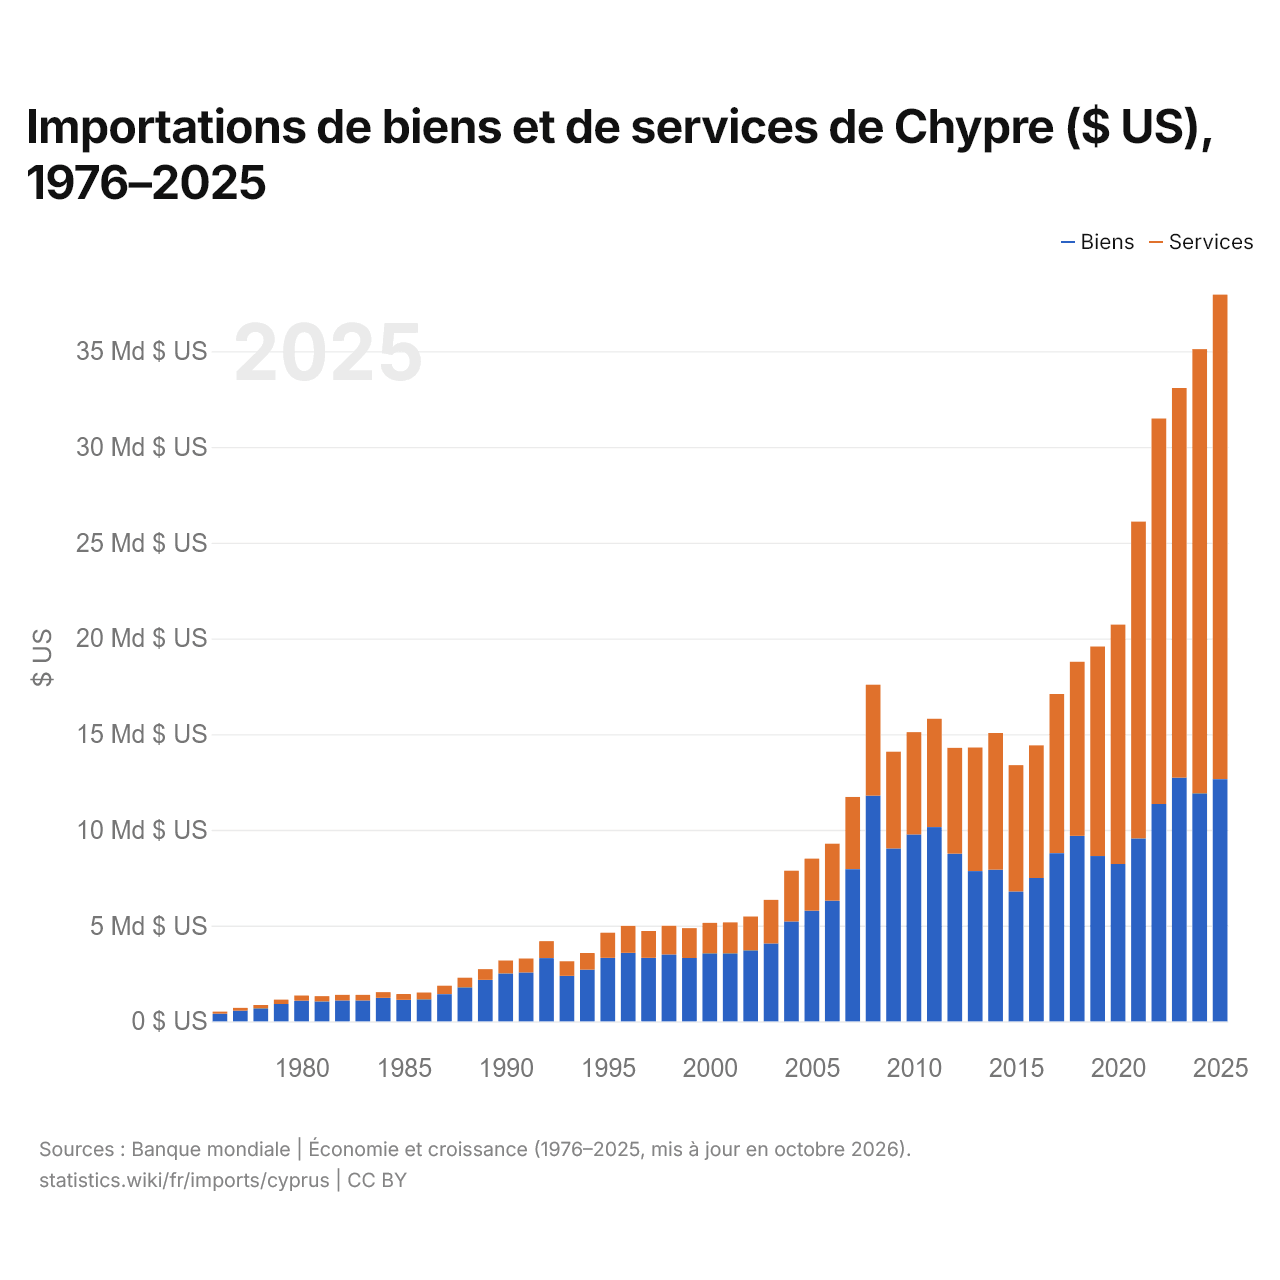
Importations de biens et de services de Chypre ($ US), 1976–2025
| Année | $ US | |
|---|---|---|
| Biens | Services | |
| 2025 | 12 648 517 275 $ US | 25 303 591 991 $ US |
| 2024 | 11 912 522 263 $ US | 23 196 729 917 $ US |
| 2023 | 12 727 557 559 $ US | 20 350 565 210 $ US |
| 2022 | 11 354 389 491 $ US | 20 131 824 664 $ US |
| 2021 | 9 555 932 906 $ US | 16 544 780 413 $ US |
| 2020 | 8 217 264 387 $ US | 12 500 492 821 $ US |
| 2019 | 8 632 841 485 $ US | 10 944 629 510 $ US |
| 2018 | 9 690 119 066 $ US | 9 089 376 591 $ US |
| 2017 | 8 781 786 997 $ US | 8 311 537 415 $ US |
| 2016 | 7 487 272 324 $ US | 6 925 708 394 $ US |
| 2015 | 6 781 557 972 $ US | 6 600 310 700 $ US |
| 2014 | 7 917 765 440 $ US | 7 140 605 586 $ US |
| 2013 | 7 845 149 928 $ US | 6 454 567 071 $ US |
| 2012 | 8 758 411 289 $ US | 5 526 479 828 $ US |
| 2011 | 10 142 584 693 $ US | 5 660 902 258 $ US |
| 2010 | 9 757 308 374 $ US | 5 343 221 152 $ US |
| 2009 | 9 031 822 222 $ US | 5 051 085 101 $ US |
| 2008 | 11 791 504 951 $ US | 5 788 685 646 $ US |
| 2007 | 7 945 908 544 $ US | 3 772 674 166 $ US |
| 2006 | 6 299 220 384 $ US | 2 977 994 250 $ US |
| 2005 | 5 785 975 203 $ US | 2 711 883 655 $ US |
| 2004 | 5 216 153 892 $ US | 2 650 111 291 $ US |
| 2003 | 4 063 597 386 $ US | 2 280 970 960 $ US |
| 2002 | 3 709 515 458 $ US | 1 767 696 721 $ US |
| 2001 | 3 552 514 836 $ US | 1 614 610 663 $ US |
| 2000 | 3 556 606 002 $ US | 1 585 291 689 $ US |
| 1999 | 3 309 526 561 $ US | 1 559 634 422 $ US |
| 1998 | 3 490 364 436 $ US | 1 497 608 509 $ US |
| 1997 | 3 317 199 544 $ US | 1 401 544 537 $ US |
| 1996 | 3 575 723 296 $ US | 1 407 214 602 $ US |
| 1995 | 3 314 175 871 $ US | 1 312 717 787 $ US |
| 1994 | 2 703 015 699 $ US | 862 063 711 $ US |
| 1993 | 2 374 522 983 $ US | 764 969 939 $ US |
| 1992 | 3 301 089 259 $ US | 883 997 892 $ US |
| 1991 | 2 553 460 866 $ US | 729 068 091 $ US |
| 1990 | 2 504 366 505 $ US | 673 899 878 $ US |
| 1989 | 2 165 479 263 $ US | 559 009 445 $ US |
| 1988 | 1 777 429 813 $ US | 501 683 529 $ US |
| 1987 | 1 418 634 062 $ US | 441 075 675 $ US |
| 1986 | 1 148 331 453 $ US | 354 535 274 $ US |
| 1985 | 1 121 863 361 $ US | 301 688 517 $ US |
| 1984 | 1 224 876 478 $ US | 300 483 088 $ US |
| 1983 | 1 093 534 780 $ US | 287 672 372 $ US |
| 1982 | 1 090 272 144 $ US | 294 497 589 $ US |
| 1981 | 1 042 638 656 $ US | 273 591 800 $ US |
| 1980 | 1 079 162 101 $ US | 267 666 190 $ US |
| 1979 | 906 208 381 $ US | 226 834 227 $ US |
| 1978 | 683 778 838 $ US | 169 472 202 $ US |
| 1977 | 558 902 084 $ US | 143 584 665 $ US |
| 1976 | 397 811 727 $ US | 111 572 425 $ US |
En 2025, les importations de biens de Chypre s'élevaient à 12,6 milliards de dollars et celles de services à 25,3 milliards de dollars ; les services représentaient 66,7 % du total, contre 21,9 % en 1976.
Chypre dans le classement mondial des importations, 2025
| Rang | Pays | Importations | Part mondiale | |
|---|---|---|---|---|
| 68 |
 Ouzbékistan |
52,0 Md $US | 0,15 % | |
| 69 |
 RDC |
40,0 Md $US | 0,12 % | |
| 70 |
 Guatemala |
38,2 Md $US | 0,11 % | |
| 71 |
 Chypre |
37,9 Md $US | 0,11 % | |
| 72 |
 Estonie |
36,4 Md $US | 0,11 % | |
| 73 |
 Équateur |
36,4 Md $US | 0,11 % | |
| 74 |
 Rép. dominicaine |
35,5 Md $US | 0,11 % |
Importations de biens et services de Chypre, % du PIB, 1975–2025
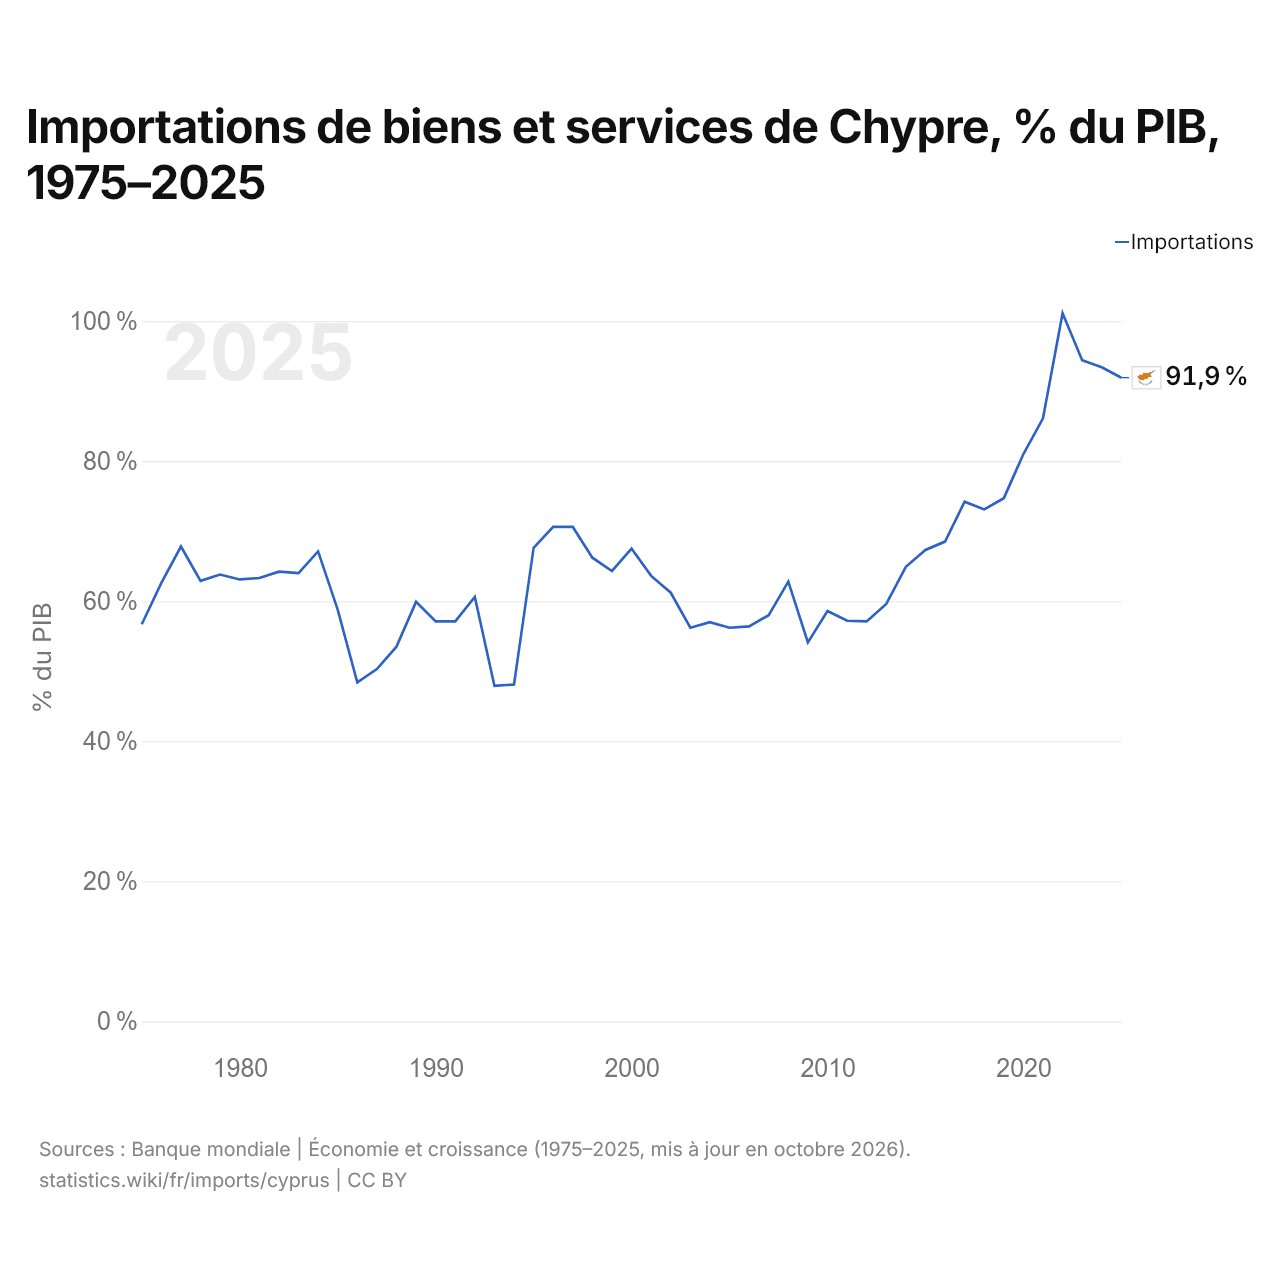
En 2025, les importations de biens et services de Chypre équivalaient à 91,9 % de son PIB, contre 56,7 % en 1975. La part la plus élevée a été de 101,1 %, en 2022.
Comparer les importations de Chypre avec celles d'autres pays
Sources :
- TradeMap (2001–2025, mis à jour en octobre 2026)
- Banque mondiale | Économie et croissance (1975–2025, mis à jour en octobre 2026)
Creative Commons Attribution (CC BY) : vous pouvez copier, partager, adapter et réutiliser ce contenu, y compris à des fins commerciales, à condition de citer statistics.wiki et d’indiquer les modifications apportées. Les sources citées ci-dessus peuvent avoir leurs propres conditions de licence.