
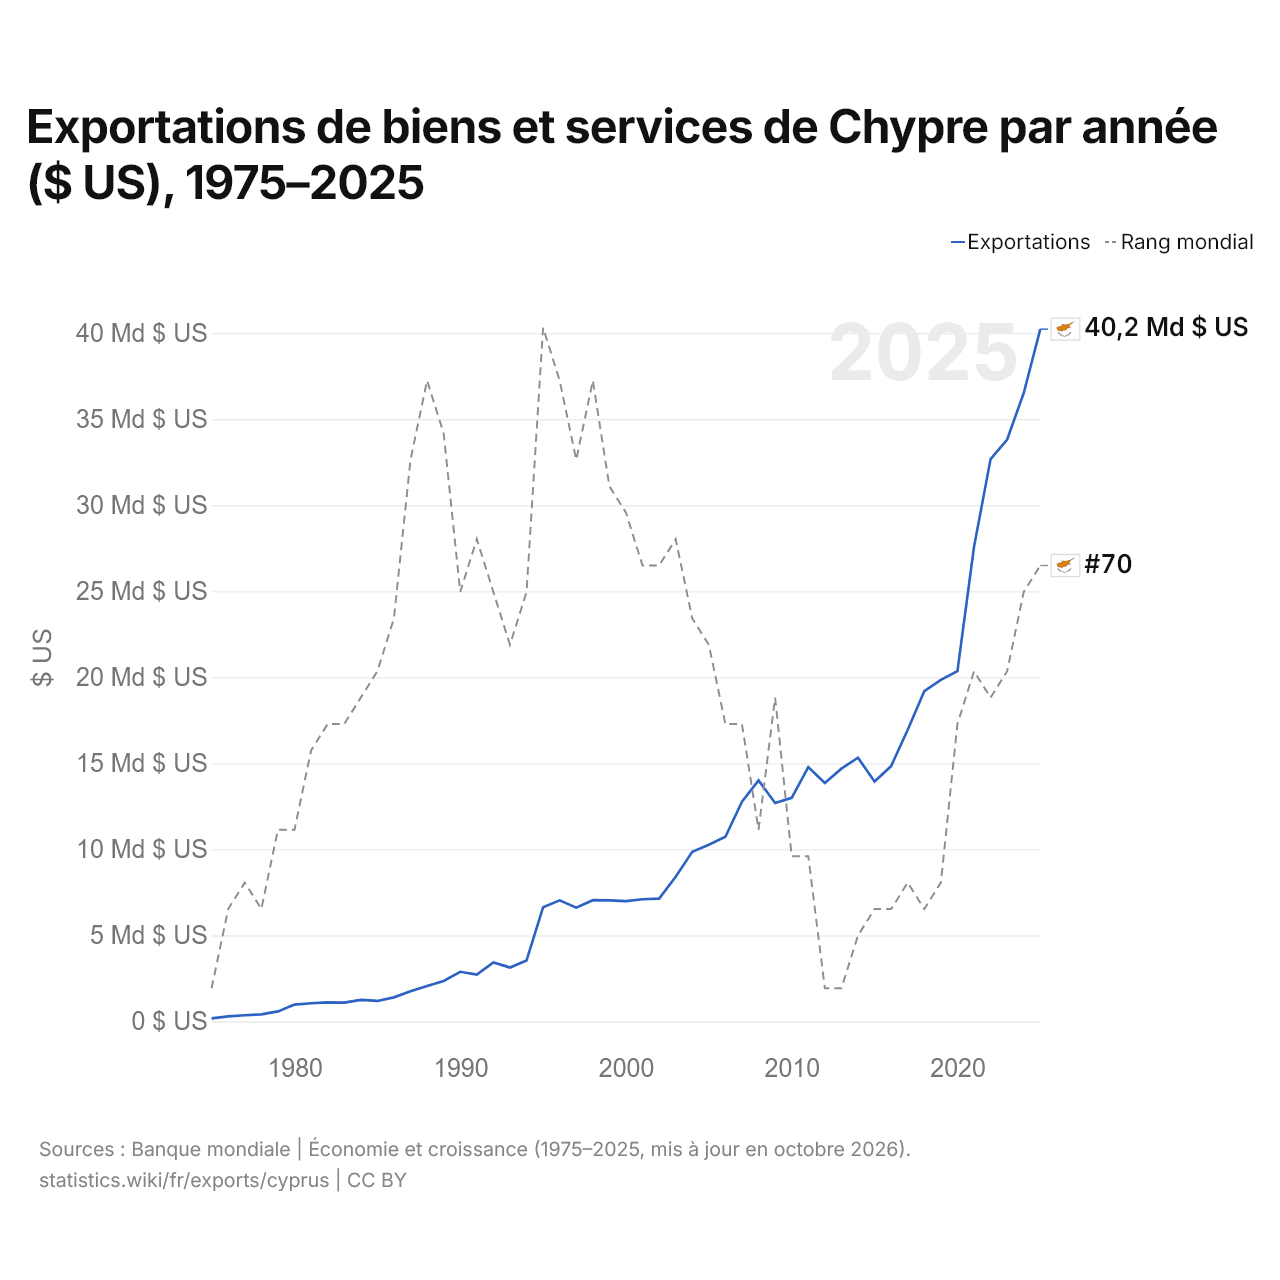
Exportations de biens et services de Chypre par année ($ US), 1975–2025
| Année | $ US | Rang mondial |
|---|---|---|
| Exportations | Rang mondial | |
| 2025 | 40 225 580 413 $ US | #70 |
| 2024 | 36 513 130 971 $ US | #71 |
| 2023 | 33 809 206 920 $ US | #74 |
| 2022 | 32 674 705 005 $ US | #75 |
| 2021 | 27 565 547 681 $ US | #74 |
| 2020 | 20 353 920 955 $ US | #76 |
| 2019 | 19 846 292 633 $ US | #82 |
| 2018 | 19 189 606 173 $ US | #83 |
| 2017 | 16 942 949 247 $ US | #82 |
| 2016 | 14 834 392 303 $ US | #83 |
| 2015 | 13 939 933 272 $ US | #83 |
| 2014 | 15 317 885 057 $ US | #84 |
| 2013 | 14 686 484 667 $ US | #86 |
| 2012 | 13 845 815 485 $ US | #86 |
| 2011 | 14 775 539 588 $ US | #81 |
| 2010 | 12 986 277 677 $ US | #81 |
| 2009 | 12 691 264 735 $ US | #75 |
| 2008 | 14 002 033 289 $ US | #80 |
| 2007 | 12 765 499 589 $ US | #76 |
| 2006 | 10 726 039 393 $ US | #76 |
| 2005 | 10 265 955 727 $ US | #73 |
| 2004 | 9 853 627 500 $ US | #72 |
| 2003 | 8 402 847 112 $ US | #69 |
| 2002 | 7 126 828 846 $ US | #70 |
| 2001 | 7 092 287 796 $ US | #70 |
| 2000 | 6 986 380 773 $ US | #68 |
| 1999 | 7 025 878 101 $ US | #67 |
| 1998 | 7 040 542 986 $ US | #63 |
| 1997 | 6 605 714 937 $ US | #66 |
| 1996 | 7 029 131 744 $ US | #63 |
| 1995 | 6 631 689 521 $ US | #61 |
| 1994 | 3 541 279 881 $ US | #71 |
| 1993 | 3 129 819 788 $ US | #73 |
| 1992 | 3 418 539 505 $ US | #71 |
| 1991 | 2 716 934 975 $ US | #69 |
| 1990 | 2 879 463 636 $ US | #71 |
| 1989 | 2 348 366 627 $ US | #65 |
| 1988 | 2 057 181 807 $ US | #63 |
| 1987 | 1 751 888 794 $ US | #66 |
| 1986 | 1 391 979 209 $ US | #72 |
| 1985 | 1 184 542 898 $ US | #74 |
| 1984 | 1 245 251 944 $ US | #75 |
| 1983 | 1 089 019 577 $ US | #76 |
| 1982 | 1 099 530 333 $ US | #76 |
| 1981 | 1 048 990 795 $ US | #77 |
| 1980 | 975 007 960 $ US | #80 |
| 1979 | 575 801 966 $ US | #80 |
| 1978 | 408 068 713 $ US | #83 |
| 1977 | 351 371 839 $ US | #82 |
| 1976 | 286 578 512 $ US | #83 |
| 1975 | 173 852 287 $ US | #86 |
En 2025, les exportations de biens et services de Chypre s'élevaient à 40,2 milliards de dollars, contre 174 millions de dollars en 1975. Elles se classaient au 70e rang mondial, en hausse par rapport au 71e rang en 2024. Leur meilleur rang a été le 61e, occupé pour la dernière fois en 1995.
En 2025, les exportations de biens et services de Chypre étaient les 31es plus élevées de 41 pays situés en Europe. Les importations de biens et services de Chypre s'élevaient à 37,9 milliards de dollars en 2025, au 71e rang mondial. En 2025, les exportations de Chypre dépassaient ses importations de 2,33 milliards de dollars, soit un excédent commercial.
Exportations de biens de Chypre par catégorie, 2025
Exportations de biens, 2025: 6,31 Md $US
En 2025, la première catégorie des exportations de biens de Chypre était « pétrole, gaz, minerais et autres matières premières », avec 49,3 %, suivie de « machines, électronique et véhicules », avec 20,3 %.
Destinations des exportations de biens de Chypre : les 10 premières, 2025
| Rang | Pays | Exportations de biens | Part | |
|---|---|---|---|---|
| 1 |
 Libye |
1,55 Md $US | 24,7 % | |
| 2 |
 Liban |
416 M $US | 6,6 % | |
| 3 |
 Grèce |
395 M $US | 6,26 % | vs Grèce |
| 4 |
 Royaume-Uni |
305 M $US | 4,83 % | |
| 5 |
 Israël |
291 M $US | 4,61 % | vs Israël |
| 6 |
 Suède |
223 M $US | 3,53 % | |
| 7 |
 Égypte |
215 M $US | 3,42 % | |
| 8 |
 France |
213 M $US | 3,38 % | vs France |
| 9 |
 Îles Marshall |
127 M $US | 2,01 % | |
| 10 |
 Allemagne |
126 M $US | 2 % | |
| Autres partenaires et non précisés | 2,44 Md $US | 38,7 % |
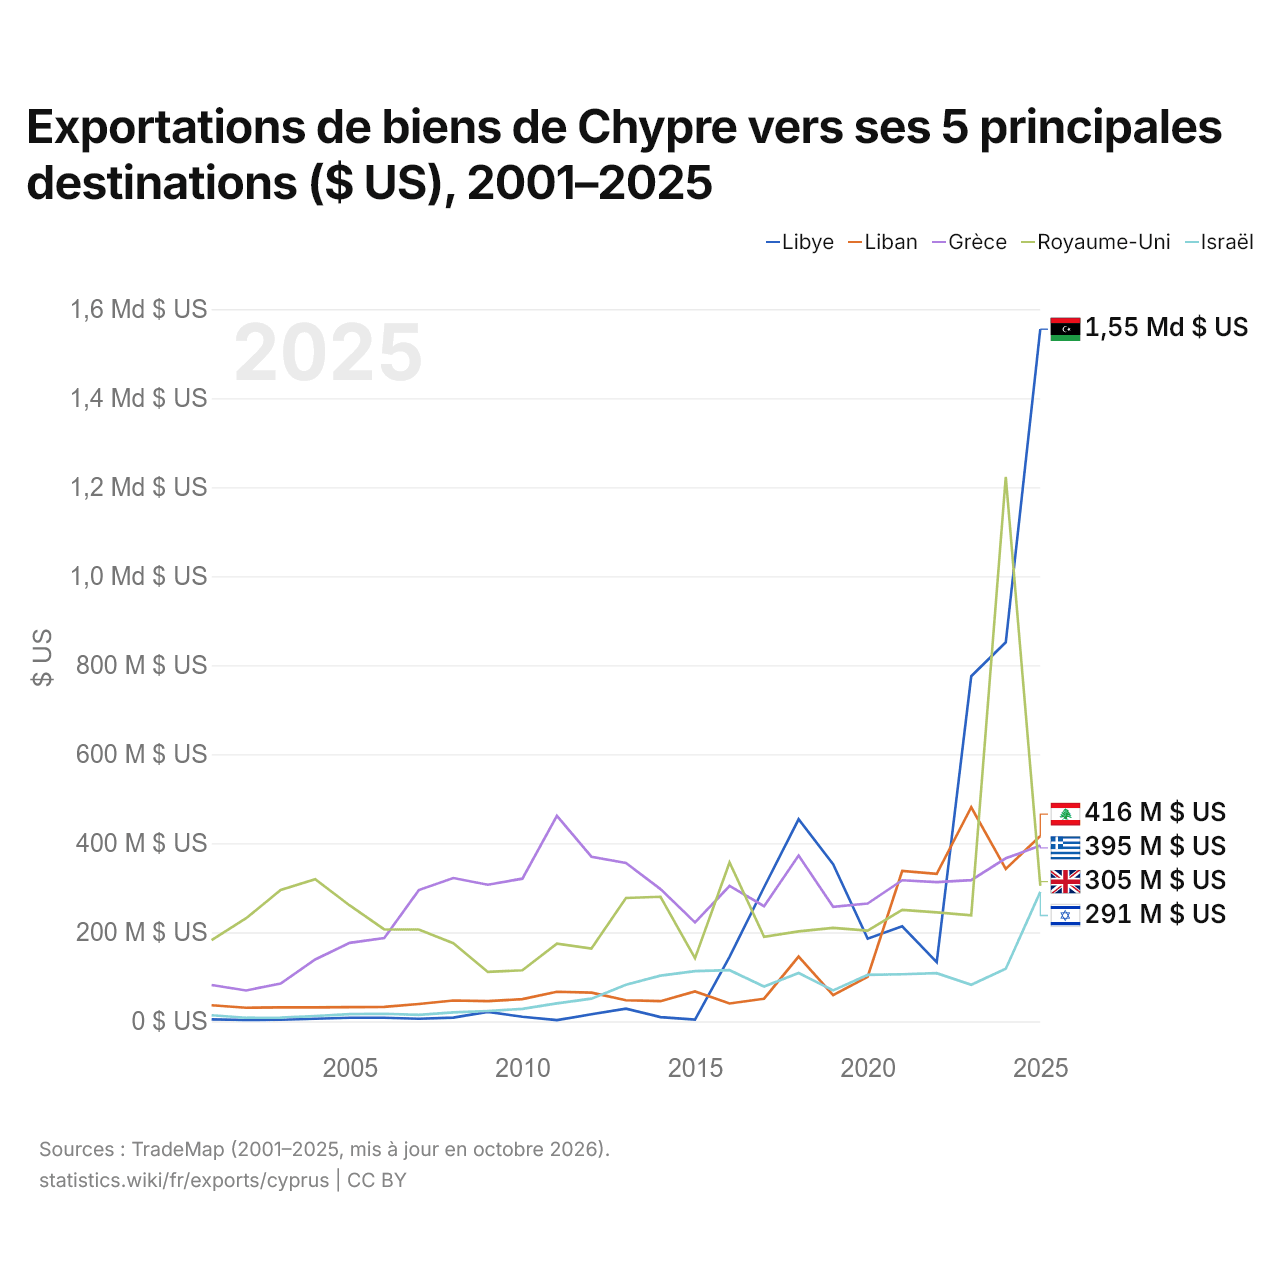
Exportations de biens de Chypre vers ses 5 principales destinations ($ US), 2001–2025
| Année | $ US | ||||
|---|---|---|---|---|---|
| Libye | Liban | Grèce | Royaume-Uni | Israël | |
| 2025 | 1 554 851 000 $ US | 416 240 000 $ US | 394 892 000 $ US | 304 815 000 $ US | 290 747 000 $ US |
| 2024 | 851 489 000 $ US | 342 454 000 $ US | 366 180 000 $ US | 1 223 210 000 $ US | 118 131 000 $ US |
| 2023 | 775 252 000 $ US | 481 043 000 $ US | 317 303 000 $ US | 237 911 000 $ US | 82 265 000 $ US |
| 2022 | 133 025 000 $ US | 331 433 000 $ US | 312 576 000 $ US | 244 827 000 $ US | 108 282 000 $ US |
| 2021 | 213 722 000 $ US | 337 659 000 $ US | 316 956 000 $ US | 250 341 000 $ US | 105 821 000 $ US |
| 2020 | 185 635 000 $ US | 100 077 000 $ US | 264 645 000 $ US | 203 918 000 $ US | 104 259 000 $ US |
| 2019 | 353 195 000 $ US | 58 926 000 $ US | 257 166 000 $ US | 209 927 000 $ US | 69 537 000 $ US |
| 2018 | 453 966 000 $ US | 145 610 000 $ US | 372 661 000 $ US | 202 072 000 $ US | 108 674 000 $ US |
| 2017 | 301 218 000 $ US | 50 826 000 $ US | 258 743 000 $ US | 190 005 000 $ US | 78 305 000 $ US |
| 2016 | 145 000 000 $ US | 40 131 000 $ US | 304 145 000 $ US | 356 918 000 $ US | 114 906 000 $ US |
| 2015 | 3 819 000 $ US | 67 088 000 $ US | 222 085 000 $ US | 141 720 000 $ US | 112 877 000 $ US |
| 2014 | 9 602 000 $ US | 45 259 000 $ US | 297 099 000 $ US | 279 909 000 $ US | 102 702 000 $ US |
| 2013 | 28 321 000 $ US | 47 424 000 $ US | 355 791 000 $ US | 277 205 000 $ US | 82 313 000 $ US |
| 2012 | 15 819 000 $ US | 64 570 000 $ US | 369 853 000 $ US | 163 300 000 $ US | 50 958 000 $ US |
| 2011 | 2 576 000 $ US | 66 444 000 $ US | 461 613 000 $ US | 174 376 000 $ US | 40 493 000 $ US |
| 2010 | 10 316 000 $ US | 49 771 000 $ US | 320 504 000 $ US | 114 733 000 $ US | 27 934 000 $ US |
| 2009 | 21 203 000 $ US | 45 523 000 $ US | 306 934 000 $ US | 110 965 000 $ US | 23 227 000 $ US |
| 2008 | 8 400 000 $ US | 46 889 000 $ US | 321 895 000 $ US | 175 571 000 $ US | 20 267 000 $ US |
| 2007 | 5 849 000 $ US | 38 952 000 $ US | 294 794 000 $ US | 206 232 000 $ US | 14 517 000 $ US |
| 2006 | 8 065 000 $ US | 32 314 000 $ US | 187 113 000 $ US | 206 655 000 $ US | 16 994 000 $ US |
| 2005 | 7 971 000 $ US | 31 786 000 $ US | 176 307 000 $ US | 260 256 000 $ US | 16 190 000 $ US |
| 2004 | 5 748 000 $ US | 31 508 000 $ US | 138 954 000 $ US | 319 429 000 $ US | 11 901 000 $ US |
| 2003 | 3 785 000 $ US | 31 341 000 $ US | 84 735 000 $ US | 295 085 000 $ US | 8 297 000 $ US |
| 2002 | 3 021 000 $ US | 30 571 000 $ US | 69 375 000 $ US | 231 557 000 $ US | 8 092 000 $ US |
| 2001 | 4 342 000 $ US | 36 105 000 $ US | 81 544 000 $ US | 182 484 000 $ US | 13 675 000 $ US |
En 2025, les exportations de biens s'élevaient à 1,55 milliard de dollars vers la Libye, 416 millions de dollars vers le Liban, 395 millions de dollars vers la Grèce, 305 millions de dollars vers le Royaume-Uni et 291 millions de dollars vers Israël. Le changement le plus récent dans leur ordre remonte à 2025, quand les exportations de Chypre vers le Liban ont dépassé celles vers la Grèce.
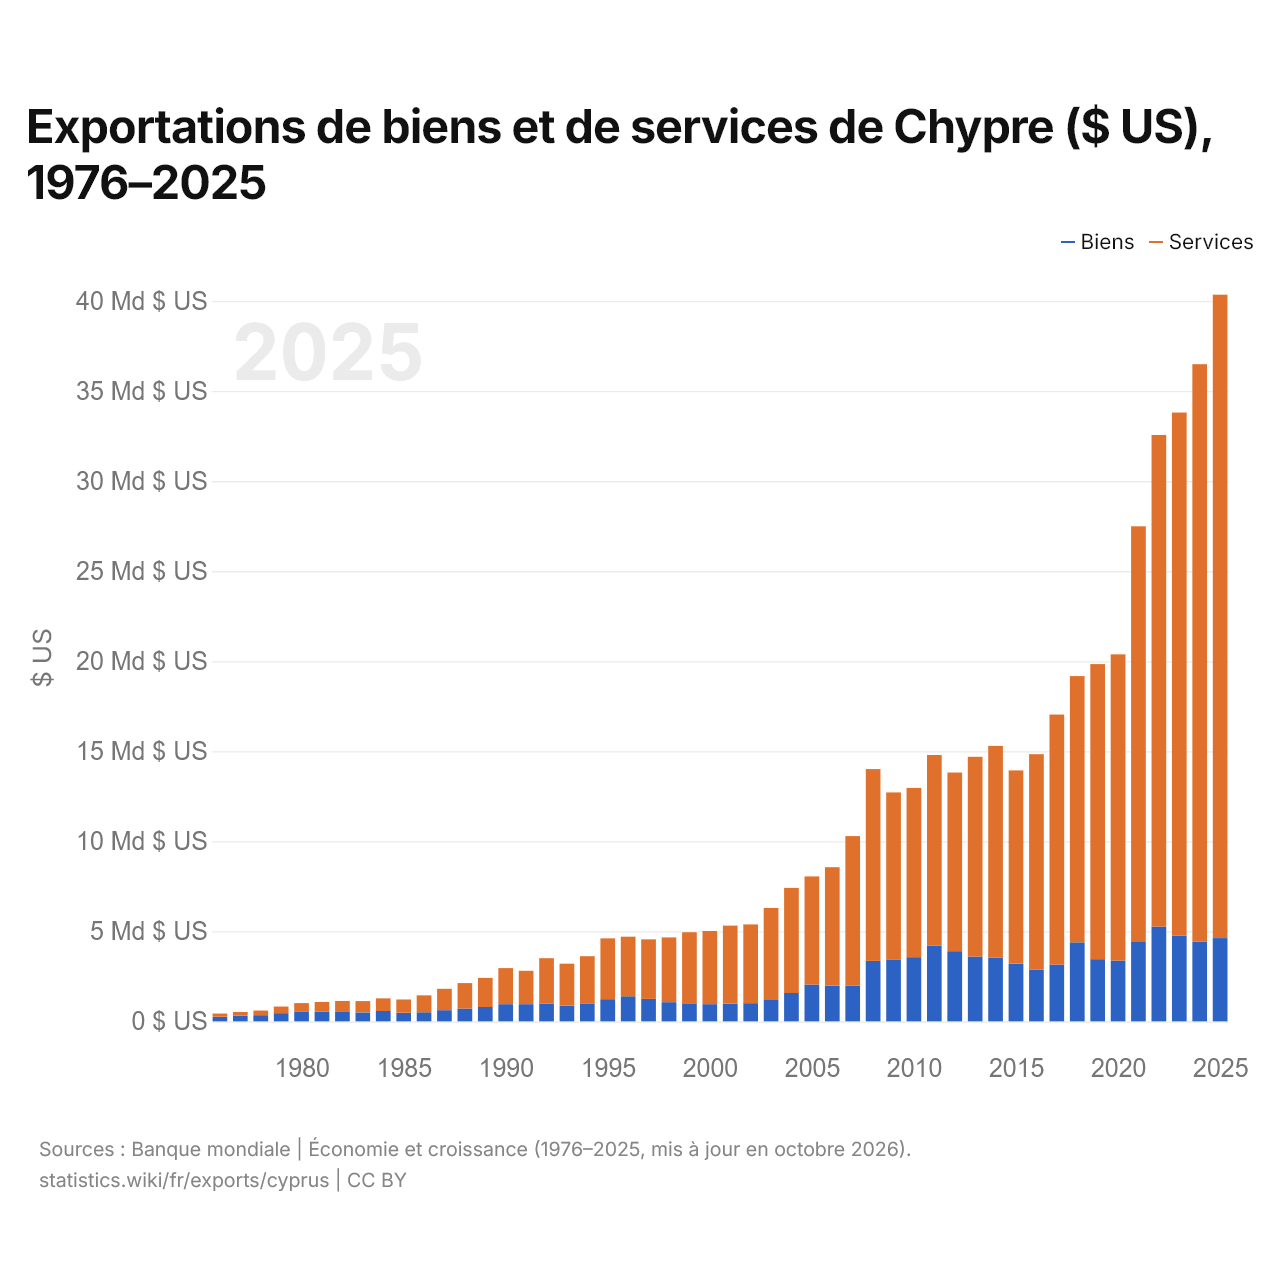
Exportations de biens et de services de Chypre ($ US), 1976–2025
| Année | $ US | |
|---|---|---|
| Biens | Services | |
| 2025 | 4 622 281 809 $ US | 35 729 151 588 $ US |
| 2024 | 4 431 829 400 $ US | 32 059 140 171 $ US |
| 2023 | 4 760 390 364 $ US | 29 042 867 417 $ US |
| 2022 | 5 260 688 655 $ US | 27 302 031 254 $ US |
| 2021 | 4 404 817 409 $ US | 23 085 027 859 $ US |
| 2020 | 3 375 193 284 $ US | 17 004 044 366 $ US |
| 2019 | 3 452 526 418 $ US | 16 382 552 136 $ US |
| 2018 | 4 387 522 637 $ US | 14 784 631 490 $ US |
| 2017 | 3 149 178 667 $ US | 13 885 082 421 $ US |
| 2016 | 2 874 481 796 $ US | 11 961 566 164 $ US |
| 2015 | 3 195 208 096 $ US | 10 739 015 735 $ US |
| 2014 | 3 550 212 103 $ US | 11 744 414 397 $ US |
| 2013 | 3 601 380 225 $ US | 11 090 029 919 $ US |
| 2012 | 3 898 408 570 $ US | 9 916 587 854 $ US |
| 2011 | 4 209 069 853 $ US | 10 581 388 959 $ US |
| 2010 | 3 563 355 682 $ US | 9 398 799 911 $ US |
| 2009 | 3 409 478 371 $ US | 9 303 029 861 $ US |
| 2008 | 3 354 885 866 $ US | 10 653 240 786 $ US |
| 2007 | 1 986 029 805 $ US | 8 297 853 927 $ US |
| 2006 | 1 979 990 176 $ US | 6 576 686 936 $ US |
| 2005 | 2 045 509 063 $ US | 6 001 174 406 $ US |
| 2004 | 1 572 709 689 $ US | 5 835 784 613 $ US |
| 2003 | 1 182 564 284 $ US | 5 114 255 741 $ US |
| 2002 | 1 007 996 874 $ US | 4 374 284 107 $ US |
| 2001 | 975 220 766 $ US | 4 340 039 936 $ US |
| 2000 | 950 924 375 $ US | 4 068 063 806 $ US |
| 1999 | 1 000 280 414 $ US | 3 946 972 798 $ US |
| 1998 | 1 064 644 192 $ US | 3 594 743 211 $ US |
| 1997 | 1 245 774 123 $ US | 3 305 134 878 $ US |
| 1996 | 1 392 417 618 $ US | 3 309 806 487 $ US |
| 1995 | 1 228 725 068 $ US | 3 377 612 477 $ US |
| 1994 | 967 510 580 $ US | 2 646 736 734 $ US |
| 1993 | 867 703 090 $ US | 2 335 118 487 $ US |
| 1992 | 985 877 870 $ US | 2 521 418 245 $ US |
| 1991 | 951 707 313 $ US | 1 857 121 172 $ US |
| 1990 | 951 580 683 $ US | 2 003 580 525 $ US |
| 1989 | 795 350 147 $ US | 1 618 600 222 $ US |
| 1988 | 709 128 919 $ US | 1 411 614 442 $ US |
| 1987 | 619 626 101 $ US | 1 187 911 159 $ US |
| 1986 | 502 756 880 $ US | 938 543 842 $ US |
| 1985 | 474 898 212 $ US | 738 385 911 $ US |
| 1984 | 573 093 310 $ US | 701 580 422 $ US |
| 1983 | 495 404 105 $ US | 627 372 619 $ US |
| 1982 | 554 076 178 $ US | 577 215 274 $ US |
| 1981 | 551 454 765 $ US | 526 539 640 $ US |
| 1980 | 527 684 775 $ US | 481 799 143 $ US |
| 1979 | 451 129 265 $ US | 371 285 875 $ US |
| 1978 | 339 212 133 $ US | 258 625 825 $ US |
| 1977 | 312 406 908 $ US | 206 556 097 $ US |
| 1976 | 254 083 056 $ US | 175 884 915 $ US |
En 2025, les exportations de biens de Chypre s'élevaient à 4,62 milliards de dollars et celles de services à 35,7 milliards de dollars ; les services représentaient 88,5 % du total, contre 40,9 % en 1976.
Chypre dans le classement mondial des exportations, 2025







Exportations de biens et services de Chypre, % du PIB, 1975–2025
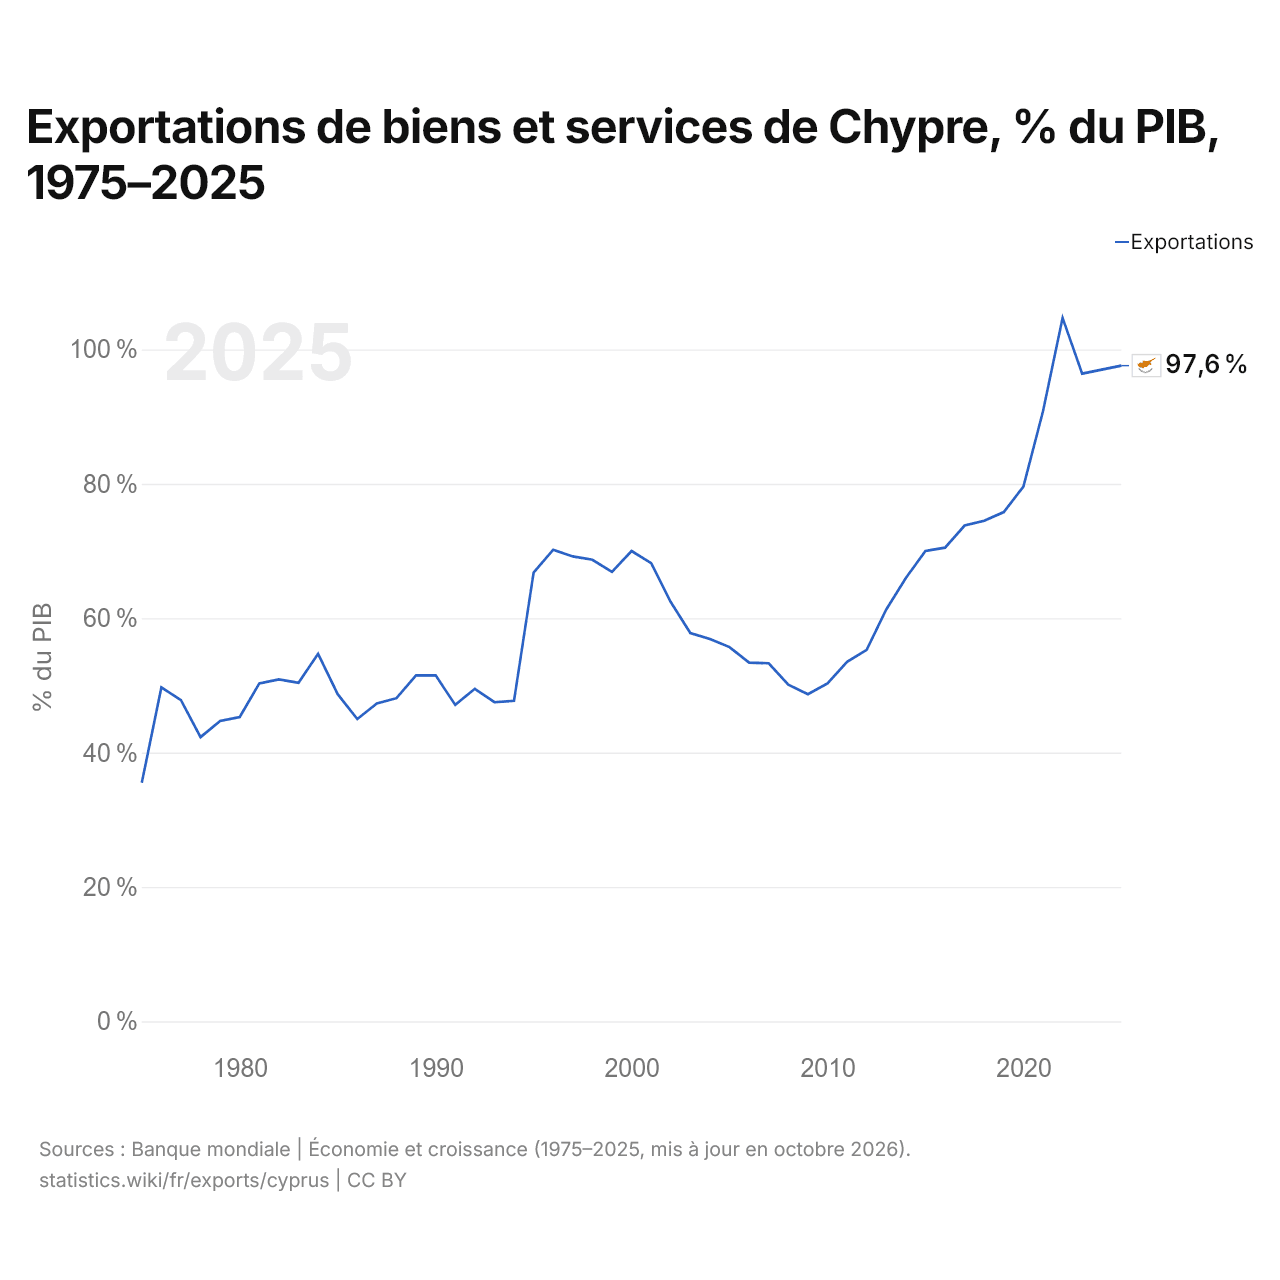
En 2025, les exportations de biens et services de Chypre équivalaient à 97,6 % de son PIB, contre 35,5 % en 1975. La part la plus élevée a été de 104,7 %, en 2022.
Comparer les exportations de Chypre avec celles d'autres pays
Sources :
- TradeMap (2001–2025, mis à jour en octobre 2026)
- Banque mondiale | Économie et croissance (1975–2025, mis à jour en octobre 2026)
Creative Commons Attribution (CC BY) : vous pouvez copier, partager, adapter et réutiliser ce contenu, y compris à des fins commerciales, à condition de citer statistics.wiki et d’indiquer les modifications apportées. Les sources citées ci-dessus peuvent avoir leurs propres conditions de licence.