
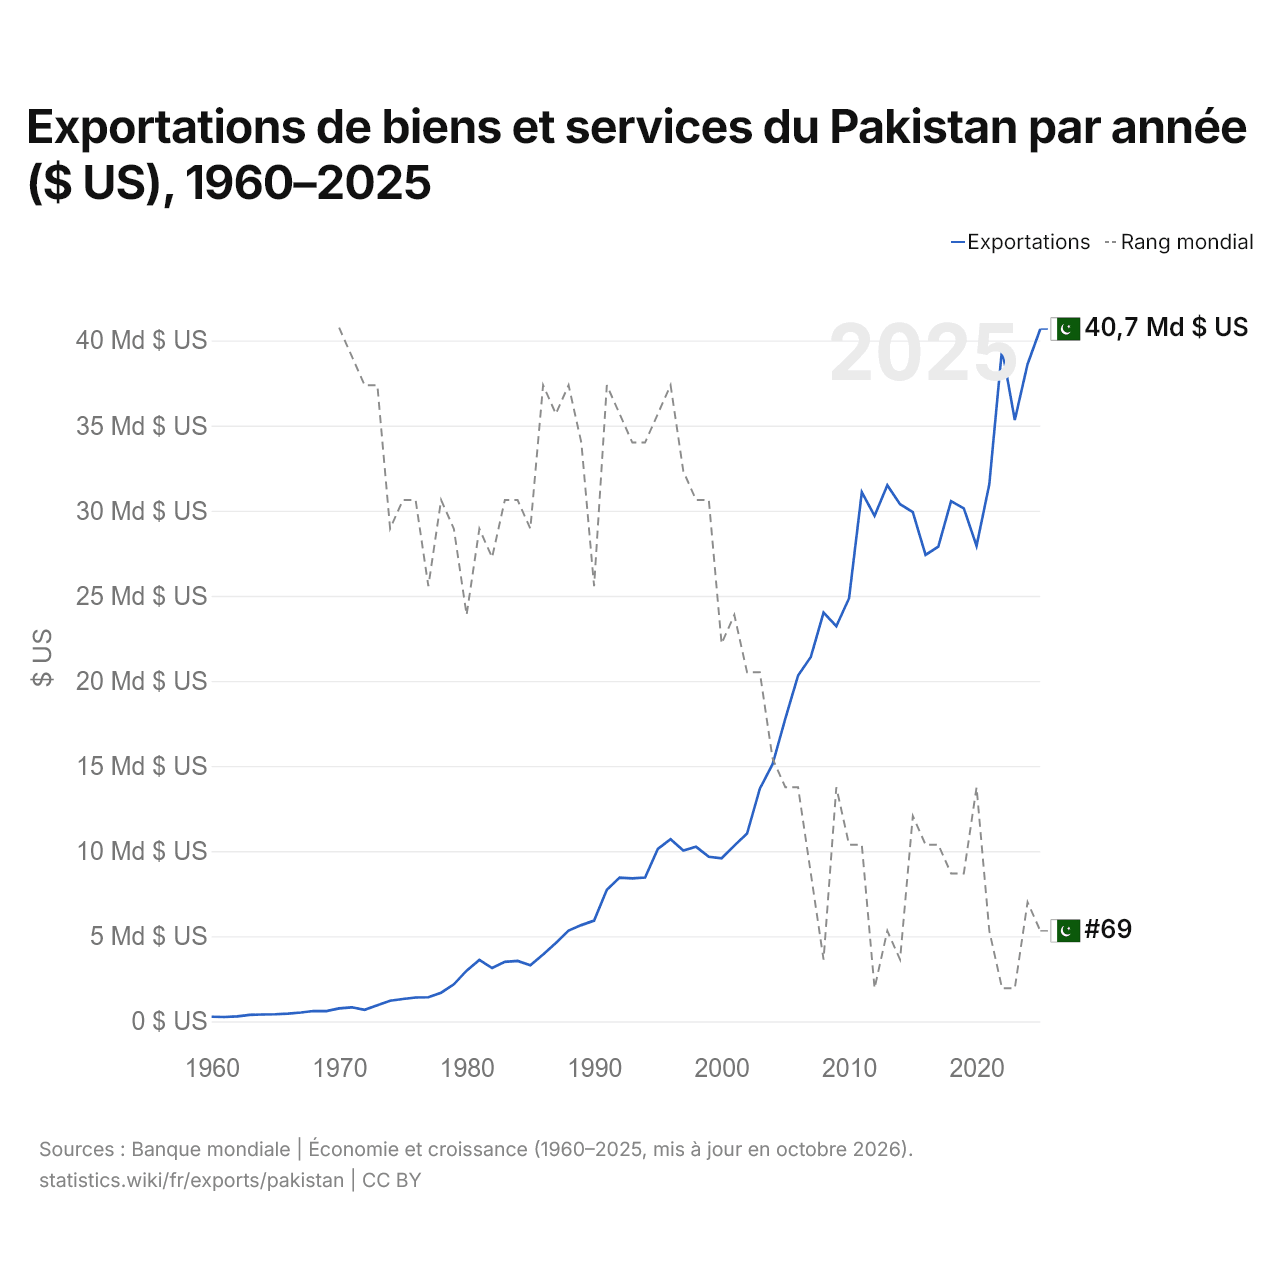
Exportations de biens et services du Pakistan par année ($ US), 1960–2025
| Année | $ US | Rang mondial |
|---|---|---|
| Exportations | Rang mondial | |
| 2025 | 40 670 467 312 $ US | #69 |
| 2024 | 38 607 805 446 $ US | #68 |
| 2023 | 35 331 726 544 $ US | #71 |
| 2022 | 39 515 650 036 $ US | #71 |
| 2021 | 31 546 332 473 $ US | #69 |
| 2020 | 27 935 253 909 $ US | #64 |
| 2019 | 30 136 170 670 $ US | #67 |
| 2018 | 30 562 205 606 $ US | #67 |
| 2017 | 27 888 160 733 $ US | #66 |
| 2016 | 27 400 963 629 $ US | #66 |
| 2015 | 29 920 081 166 $ US | #65 |
| 2014 | 30 382 086 972 $ US | #70 |
| 2013 | 31 497 982 328 $ US | #69 |
| 2012 | 29 697 611 485 $ US | #71 |
| 2011 | 31 088 962 295 $ US | #66 |
| 2010 | 24 858 636 643 $ US | #66 |
| 2009 | 23 213 002 702 $ US | #64 |
| 2008 | 24 013 343 672 $ US | #70 |
| 2007 | 21 406 517 114 $ US | #67 |
| 2006 | 20 313 153 771 $ US | #64 |
| 2005 | 17 790 723 345 $ US | #64 |
| 2004 | 15 103 000 000 $ US | #63 |
| 2003 | 13 669 643 162 $ US | #60 |
| 2002 | 11 029 069 178 $ US | #60 |
| 2001 | 10 322 860 873 $ US | #58 |
| 2000 | 9 580 014 110 $ US | #59 |
| 1999 | 9 668 690 721 $ US | #54 |
| 1998 | 10 252 214 044 $ US | #54 |
| 1997 | 10 040 500 611 $ US | #53 |
| 1996 | 10 703 072 794 $ US | #50 |
| 1995 | 10 132 269 179 $ US | #51 |
| 1994 | 8 449 778 027 $ US | #52 |
| 1993 | 8 394 305 117 $ US | #52 |
| 1992 | 8 442 738 387 $ US | #51 |
| 1991 | 7 725 461 182 $ US | #50 |
| 1990 | 5 917 028 935 $ US | #57 |
| 1989 | 5 652 851 126 $ US | #52 |
| 1988 | 5 331 871 262 $ US | #50 |
| 1987 | 4 605 651 034 $ US | #51 |
| 1986 | 3 922 380 657 $ US | #50 |
| 1985 | 3 290 831 135 $ US | #55 |
| 1984 | 3 549 643 811 $ US | #54 |
| 1983 | 3 495 669 291 $ US | #54 |
| 1982 | 3 131 090 047 $ US | #56 |
| 1981 | 3 606 767 677 $ US | #55 |
| 1980 | 2 978 282 828 $ US | #58 |
| 1979 | 2 174 646 465 $ US | #55 |
| 1978 | 1 679 696 970 $ US | #54 |
| 1977 | 1 413 232 323 $ US | #57 |
| 1976 | 1 402 121 212 $ US | #54 |
| 1975 | 1 312 525 253 $ US | #54 |
| 1974 | 1 208 080 808 $ US | #55 |
| 1973 | 942 116 712 $ US | #50 |
| 1972 | 675 563 975 $ US | #50 |
| 1971 | 823 603 528 $ US | #49 |
| 1970 | 763 754 725 $ US | #48 |
| 1969 | 601 007 980 $ US | - |
| 1968 | 605 837 883 $ US | - |
| 1967 | 516 589 668 $ US | - |
| 1966 | 453 170 937 $ US | - |
| 1965 | 418 311 634 $ US | - |
| 1964 | 401 931 961 $ US | - |
| 1963 | 378 622 428 $ US | - |
| 1962 | 288 744 225 $ US | - |
| 1961 | 255 984 880 $ US | - |
| 1960 | 269 004 620 $ US | - |
En 2025, les exportations de biens et services du Pakistan s'élevaient à 40,7 milliards de dollars, contre 269 millions de dollars en 1960. Le minimum a été de 256 millions de dollars, en 1961. Elles se classaient au 69e rang mondial, en baisse par rapport au 68e rang en 2024. Leur meilleur rang a été le 48e, occupé pour la dernière fois en 1970.
En 2025, les exportations de biens et services du Pakistan étaient les 24es plus élevées de 44 pays situés en Asie. Les importations de biens et services du Pakistan s'élevaient à 70,1 milliards de dollars en 2025, au 56e rang mondial. En 2025, les importations du Pakistan dépassaient ses exportations de 29,4 milliards de dollars, soit un déficit commercial.
Exportations de biens du Pakistan par catégorie, 2025
Exportations de biens, 2025: 30,7 Md $US
En 2025, la première catégorie des exportations de biens du Pakistan était « textiles, vêtements, chaussures, meubles et jouets », avec 63,7 %, suivie de « cultures, plantes et fleurs (céréales, fruits, légumes, café, oléagineux) », avec 11,7 %.
Destinations des exportations de biens du Pakistan : les 10 premières, 2025
| Rang | Pays | Exportations de biens | Part | |
|---|---|---|---|---|
| 1 |
 États-Unis |
5,92 Md $US | 19,3 % | vs USA |
| 2 |
 Chine |
2,28 Md $US | 7,44 % | |
| 3 |
 Royaume-Uni |
2,08 Md $US | 6,79 % | vs R.-U. |
| 4 |
 EAU |
1,92 Md $US | 6,25 % | vs EAU |
| 5 |
 Allemagne |
1,68 Md $US | 5,48 % | |
| 6 |
 Espagne |
1,59 Md $US | 5,2 % | |
| 7 |
 Pays-Bas |
1,55 Md $US | 5,04 % | |
| 8 |
 Italie |
1,17 Md $US | 3,8 % | |
| 9 |
 Afghanistan |
1,10 Md $US | 3,6 % | vs Afghanistan |
| 10 |
 Bangladesh |
727 M $US | 2,37 % | vs Bangladesh |
| Autres partenaires et non précisés | 10,7 Md $US | 34,7 % |
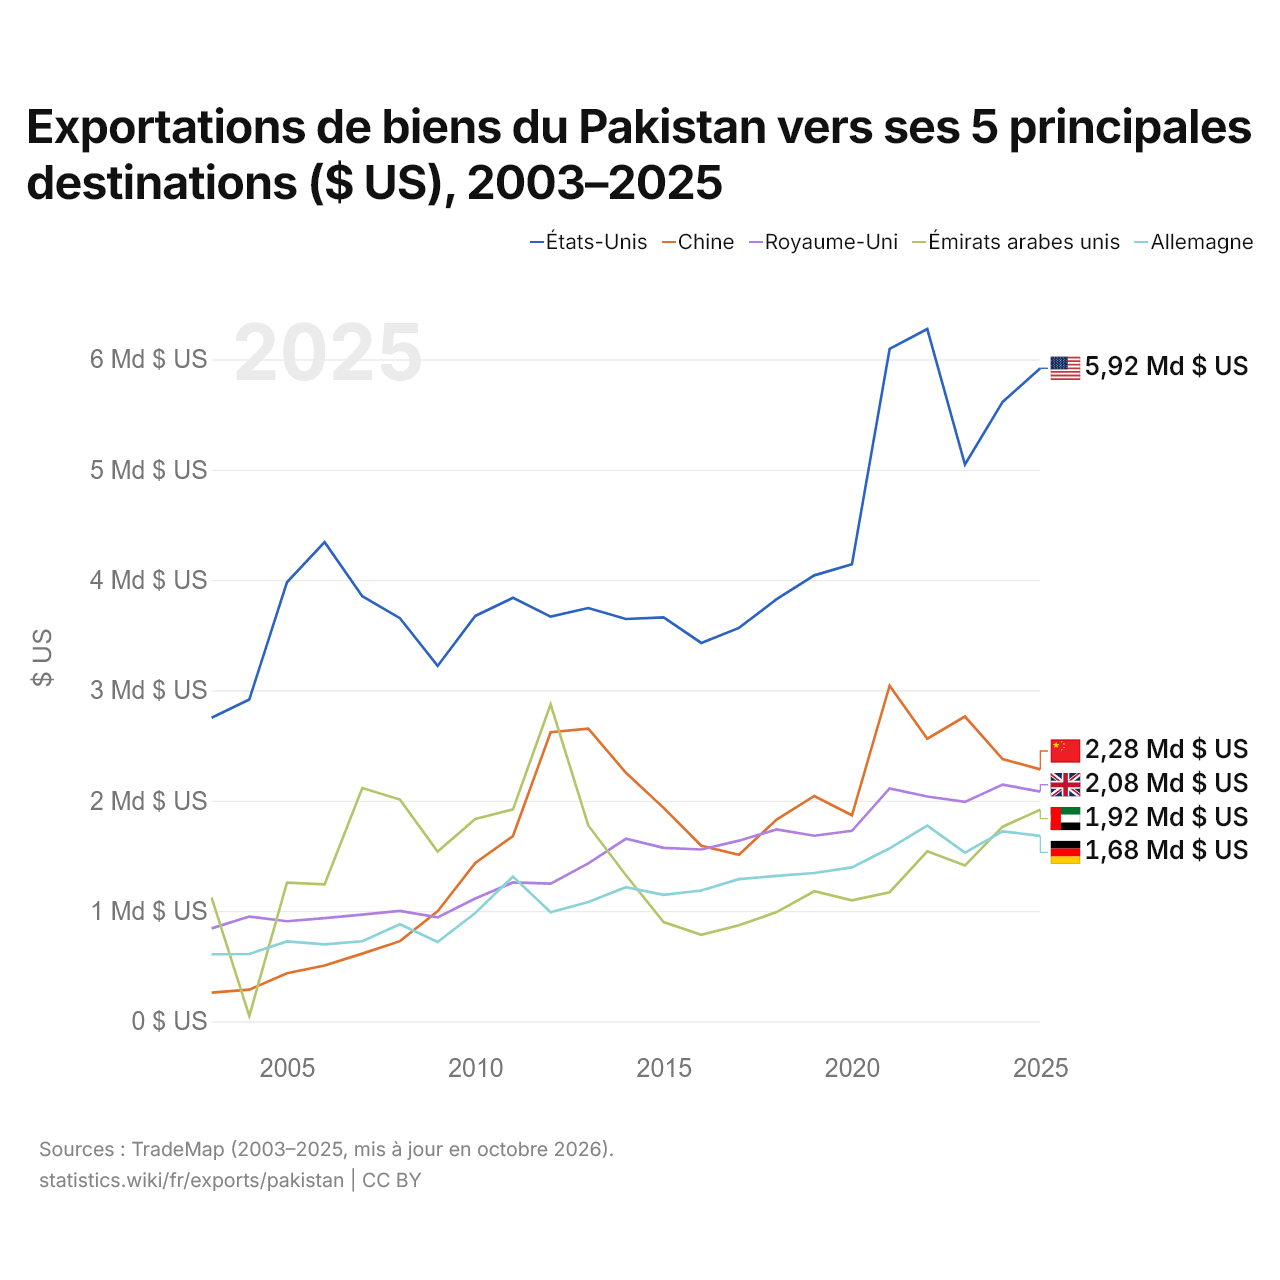
Exportations de biens du Pakistan vers ses 5 principales destinations ($ US), 2003–2025
| Année | $ US | ||||
|---|---|---|---|---|---|
| États-Unis | Chine | Royaume-Uni | Émirats arabes unis | Allemagne | |
| 2025 | 5 919 050 000 $ US | 2 283 531 000 $ US | 2 082 408 000 $ US | 1 917 571 000 $ US | 1 680 457 000 $ US |
| 2024 | 5 614 623 000 $ US | 2 377 244 000 $ US | 2 145 854 000 $ US | 1 764 399 000 $ US | 1 722 069 000 $ US |
| 2023 | 5 046 317 000 $ US | 2 762 635 000 $ US | 1 989 329 000 $ US | 1 413 370 000 $ US | 1 528 385 000 $ US |
| 2022 | 6 275 021 000 $ US | 2 561 413 000 $ US | 2 037 900 000 $ US | 1 540 873 000 $ US | 1 774 639 000 $ US |
| 2021 | 6 094 814 000 $ US | 3 042 838 000 $ US | 2 110 649 000 $ US | 1 170 170 000 $ US | 1 568 420 000 $ US |
| 2020 | 4 143 434 000 $ US | 1 867 755 000 $ US | 1 726 855 000 $ US | 1 097 303 000 $ US | 1 395 550 000 $ US |
| 2019 | 4 042 271 000 $ US | 2 042 893 000 $ US | 1 682 328 000 $ US | 1 179 059 000 $ US | 1 344 826 000 $ US |
| 2018 | 3 826 257 000 $ US | 1 829 435 000 $ US | 1 739 452 000 $ US | 989 724 000 $ US | 1 318 636 000 $ US |
| 2017 | 3 565 800 000 $ US | 1 510 410 000 $ US | 1 637 489 000 $ US | 870 393 000 $ US | 1 288 479 000 $ US |
| 2016 | 3 429 743 000 $ US | 1 590 858 000 $ US | 1 557 630 000 $ US | 784 747 000 $ US | 1 186 247 000 $ US |
| 2015 | 3 661 588 000 $ US | 1 934 926 000 $ US | 1 572 801 000 $ US | 899 030 000 $ US | 1 146 261 000 $ US |
| 2014 | 3 646 509 000 $ US | 2 252 900 000 $ US | 1 654 645 000 $ US | 1 324 075 000 $ US | 1 215 478 000 $ US |
| 2013 | 3 746 252 000 $ US | 2 652 223 000 $ US | 1 431 956 000 $ US | 1 775 143 000 $ US | 1 080 984 000 $ US |
| 2012 | 3 668 507 000 $ US | 2 619 944 000 $ US | 1 247 437 000 $ US | 2 872 869 000 $ US | 988 518 000 $ US |
| 2011 | 3 839 158 000 $ US | 1 678 959 000 $ US | 1 258 789 000 $ US | 1 920 961 000 $ US | 1 312 204 000 $ US |
| 2010 | 3 674 481 000 $ US | 1 435 944 000 $ US | 1 113 869 000 $ US | 1 834 906 000 $ US | 981 216 000 $ US |
| 2009 | 3 220 948 000 $ US | 997 854 000 $ US | 942 610 000 $ US | 1 538 588 000 $ US | 719 250 000 $ US |
| 2008 | 3 653 923 000 $ US | 726 711 000 $ US | 1 000 423 000 $ US | 2 009 811 000 $ US | 879 997 000 $ US |
| 2007 | 3 853 467 000 $ US | 613 759 000 $ US | 967 379 000 $ US | 2 114 709 000 $ US | 725 954 000 $ US |
| 2006 | 4 343 424 000 $ US | 506 642 000 $ US | 935 871 000 $ US | 1 241 818 000 $ US | 697 539 000 $ US |
| 2005 | 3 979 485 000 $ US | 435 682 000 $ US | 907 496 000 $ US | 1 256 776 000 $ US | 724 412 000 $ US |
| 2004 | 2 916 696 000 $ US | 287 017 000 $ US | 949 616 000 $ US | 48 569 000 $ US | 609 976 000 $ US |
| 2003 | 2 751 521 000 $ US | 259 637 000 $ US | 842 309 000 $ US | 1 121 667 000 $ US | 608 147 000 $ US |
En 2025, les exportations de biens s'élevaient à 5,92 milliards de dollars vers les États-Unis, 2,28 milliards de dollars vers la Chine, 2,08 milliards de dollars vers le Royaume-Uni, 1,92 milliard de dollars vers les Émirats arabes unis et 1,68 milliard de dollars vers l'Allemagne. Le premier rang des cinq destinations du Pakistan est occupé par les États-Unis chaque année depuis 2003. Le changement le plus récent dans leur ordre remonte à 2024, quand les exportations du Pakistan vers les Émirats arabes unis ont dépassé celles vers l'Allemagne.
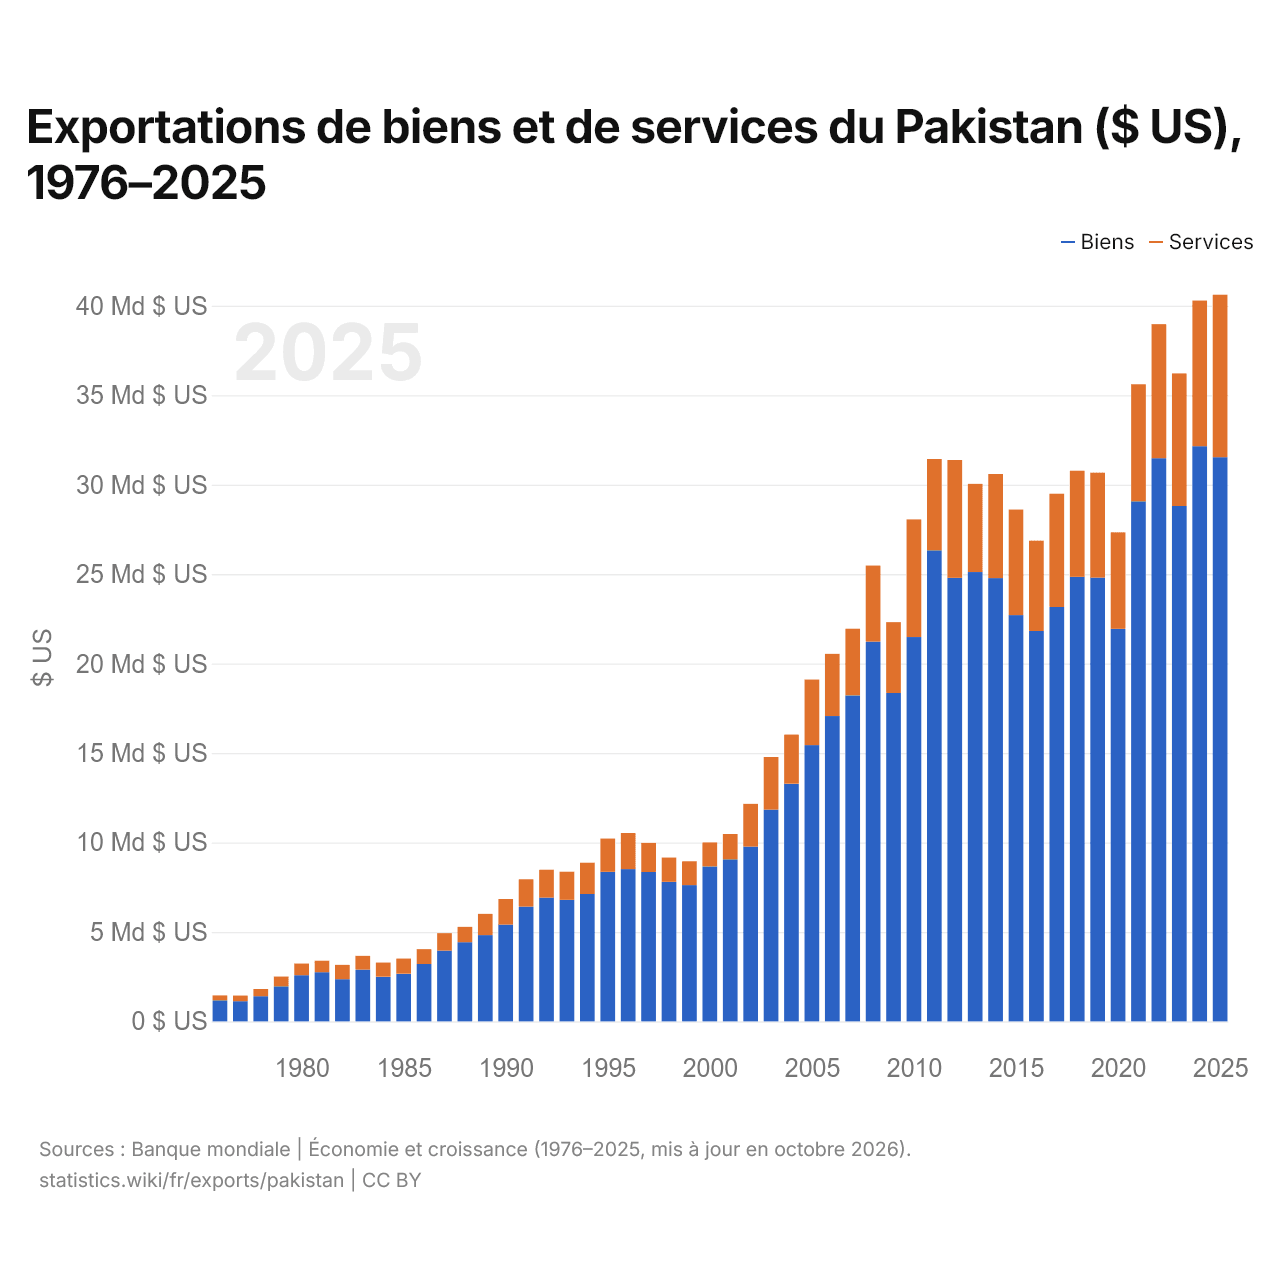
Exportations de biens et de services du Pakistan ($ US), 1976–2025
| Année | $ US | |
|---|---|---|
| Biens | Services | |
| 2025 | 31 532 000 000 $ US | 9 086 005 500 $ US |
| 2024 | 32 150 000 000 $ US | 8 140 732 245 $ US |
| 2023 | 28 809 000 000 $ US | 7 405 547 794 $ US |
| 2022 | 31 473 000 000 $ US | 7 493 760 000 $ US |
| 2021 | 29 068 000 000 $ US | 6 544 020 000 $ US |
| 2020 | 21 941 000 000 $ US | 5 392 070 000 $ US |
| 2019 | 24 800 000 000 $ US | 5 870 150 000 $ US |
| 2018 | 24 842 000 000 $ US | 5 932 890 000 $ US |
| 2017 | 23 163 000 000 $ US | 6 328 440 000 $ US |
| 2016 | 21 820 000 000 $ US | 5 049 211 000 $ US |
| 2015 | 22 707 000 000 $ US | 5 897 000 000 $ US |
| 2014 | 24 777 000 000 $ US | 5 817 000 000 $ US |
| 2013 | 25 115 000 000 $ US | 4 928 000 000 $ US |
| 2012 | 24 792 000 000 $ US | 6 582 000 000 $ US |
| 2011 | 26 328 000 000 $ US | 5 105 000 000 $ US |
| 2010 | 21 481 000 000 $ US | 6 575 000 000 $ US |
| 2009 | 18 356 000 000 $ US | 3 957 000 000 $ US |
| 2008 | 21 223 500 000 $ US | 4 249 000 000 $ US |
| 2007 | 18 218 000 000 $ US | 3 728 000 000 $ US |
| 2006 | 17 065 000 000 $ US | 3 475 000 000 $ US |
| 2005 | 15 441 000 000 $ US | 3 664 000 000 $ US |
| 2004 | 13 281 000 000 $ US | 2 746 010 000 $ US |
| 2003 | 11 836 000 000 $ US | 2 939 000 000 $ US |
| 2002 | 9 773 000 000 $ US | 2 385 000 000 $ US |
| 2001 | 9 053 000 000 $ US | 1 418 000 000 $ US |
| 2000 | 8 657 000 000 $ US | 1 340 000 000 $ US |
| 1999 | 7 615 000 000 $ US | 1 330 000 000 $ US |
| 1998 | 7 796 000 000 $ US | 1 359 000 000 $ US |
| 1997 | 8 350 730 704 $ US | 1 625 164 795 $ US |
| 1996 | 8 507 268 922 $ US | 2 016 215 899 $ US |
| 1995 | 8 356 347 225 $ US | 1 857 254 958 $ US |
| 1994 | 7 116 752 174 $ US | 1 752 703 438 $ US |
| 1993 | 6 793 407 997 $ US | 1 572 960 534 $ US |
| 1992 | 6 913 088 869 $ US | 1 559 484 797 $ US |
| 1991 | 6 410 838 401 $ US | 1 530 898 012 $ US |
| 1990 | 5 405 435 437 $ US | 1 429 290 797 $ US |
| 1989 | 4 818 196 223 $ US | 1 187 461 166 $ US |
| 1988 | 4 425 590 321 $ US | 856 594 093 $ US |
| 1987 | 3 956 371 892 $ US | 971 639 114 $ US |
| 1986 | 3 205 895 888 $ US | 830 087 010 $ US |
| 1985 | 2 660 568 522 $ US | 848 533 185 $ US |
| 1984 | 2 492 105 072 $ US | 794 425 668 $ US |
| 1983 | 2 890 204 231 $ US | 772 416 949 $ US |
| 1982 | 2 351 746 917 $ US | 802 982 604 $ US |
| 1981 | 2 743 119 875 $ US | 646 377 242 $ US |
| 1980 | 2 580 942 009 $ US | 651 959 084 $ US |
| 1979 | 1 957 095 108 $ US | 546 817 488 $ US |
| 1978 | 1 403 680 898 $ US | 401 994 074 $ US |
| 1977 | 1 126 517 097 $ US | 311 771 218 $ US |
| 1976 | 1 172 085 221 $ US | 277 671 241 $ US |
En 2025, les exportations de biens du Pakistan s'élevaient à 31,5 milliards de dollars et celles de services à 9,09 milliards de dollars ; les services représentaient 22,4 % du total, contre 19,2 % en 1976.
Le Pakistan dans le classement mondial des exportations, 2025
| Rang | Pays | Exportations | Part mondiale | |
|---|---|---|---|---|
| 66 |
 Algérie |
48,3 Md $US | 0,14 % | vs Algérie |
| 67 |
 Bahreïn |
43,4 Md $US | 0,12 % | |
| 68 |
 Équateur |
41,0 Md $US | 0,12 % | |
| 69 |
 Pakistan |
40,7 Md $US | 0,12 % | |
| 70 |
 Chypre |
40,2 Md $US | 0,12 % | |
| 71 |
 Costa Rica |
40,0 Md $US | 0,11 % | |
| 72 |
 RDC |
39,5 Md $US | 0,11 % |
Exportations de biens et services du Pakistan, % du PIB, 1960–2025
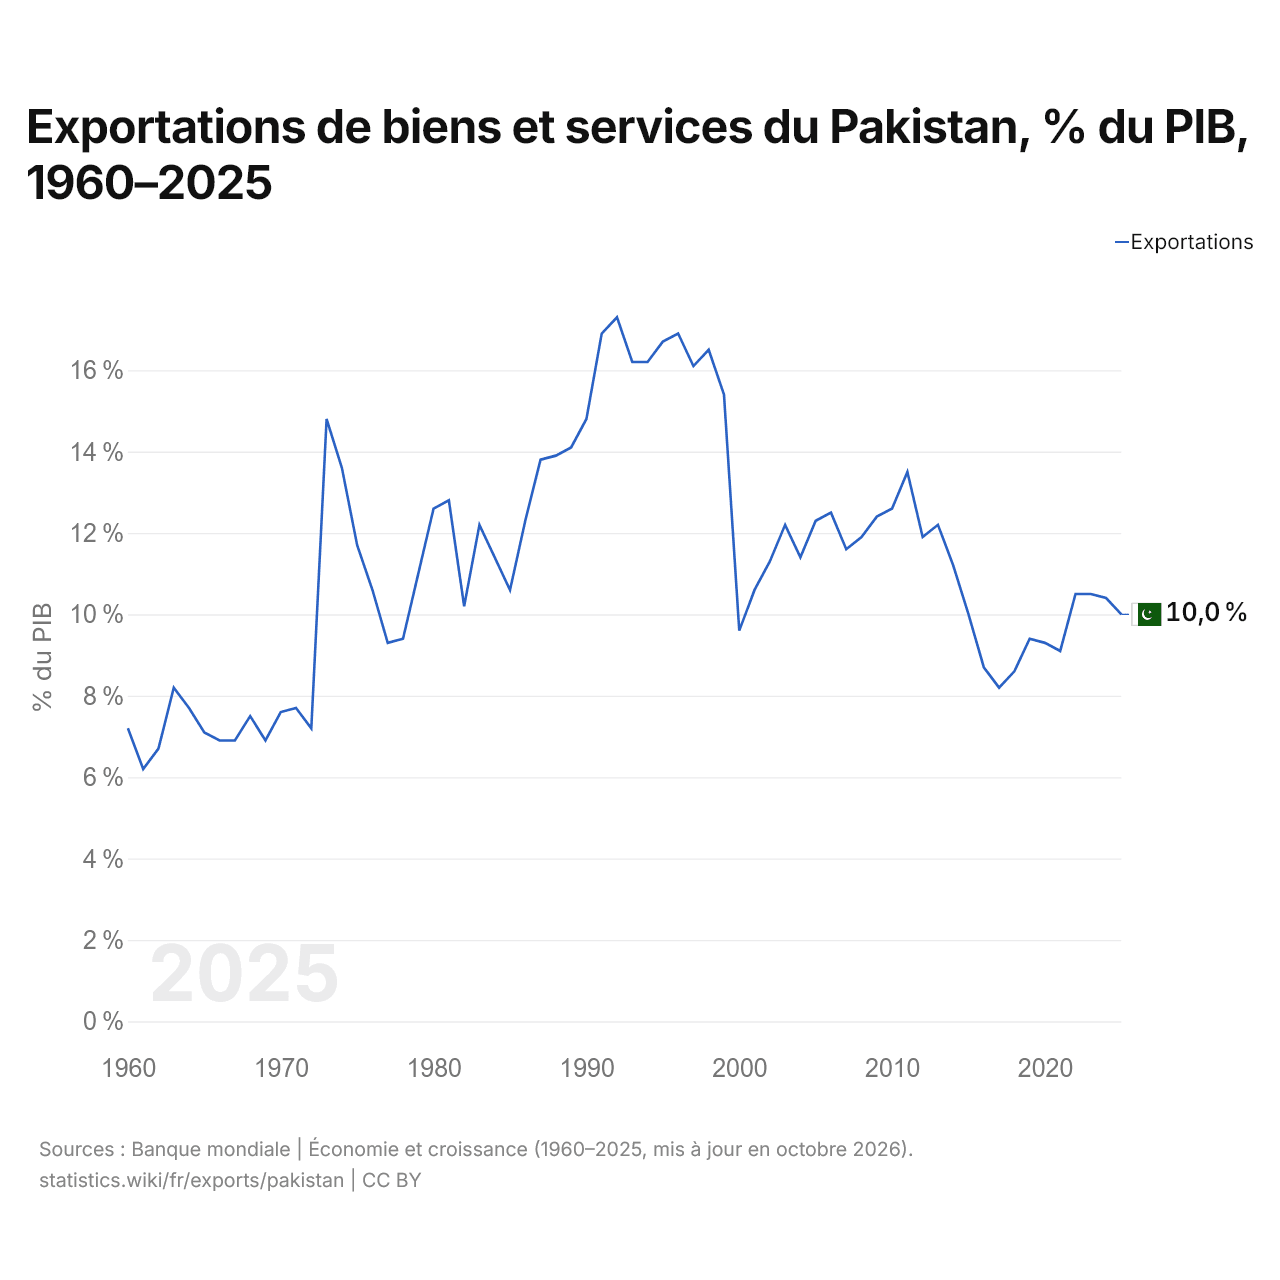
En 2025, les exportations de biens et services du Pakistan équivalaient à 10,0 % de son PIB, contre 7,2 % en 1960. La part la plus élevée a été de 17,3 %, en 1992.
Comparer les exportations du Pakistan avec celles d'autres pays
Sources :
- TradeMap (2003–2025, mis à jour en octobre 2026)
- Banque mondiale | Économie et croissance (1960–2025, mis à jour en octobre 2026)
Creative Commons Attribution (CC BY) : vous pouvez copier, partager, adapter et réutiliser ce contenu, y compris à des fins commerciales, à condition de citer statistics.wiki et d’indiquer les modifications apportées. Les sources citées ci-dessus peuvent avoir leurs propres conditions de licence.