
Exportations de biens et services d'Israël par année ($ US), 1970–2025
| Année | $ US | Rang mondial |
|---|---|---|
| Exportations | Rang mondial | |
| 2025 | 168 320 379 116 $ US | #37 |
| 2024 | 154 003 411 595 $ US | #37 |
| 2023 | 155 704 384 530 $ US | #37 |
| 2022 | 164 717 379 095 $ US | #36 |
| 2021 | 141 134 707 991 $ US | #37 |
| 2020 | 111 580 807 004 $ US | #37 |
| 2019 | 116 111 159 420 $ US | #37 |
| 2018 | 111 732 613 655 $ US | #38 |
| 2017 | 103 870 950 733 $ US | #39 |
| 2016 | 95 603 619 692 $ US | #38 |
| 2015 | 93 656 330 689 $ US | #38 |
| 2014 | 99 195 918 584 $ US | #42 |
| 2013 | 97 916 091 126 $ US | #42 |
| 2012 | 91 513 991 201 $ US | #45 |
| 2011 | 91 640 284 332 $ US | #44 |
| 2010 | 80 360 492 381 $ US | #40 |
| 2009 | 67 908 236 147 $ US | #39 |
| 2008 | 82 239 708 194 $ US | #42 |
| 2007 | 71 528 776 077 $ US | #42 |
| 2006 | 62 029 475 291 $ US | #42 |
| 2005 | 57 267 194 554 $ US | #39 |
| 2004 | 52 102 634 315 $ US | #38 |
| 2003 | 42 956 388 968 $ US | #38 |
| 2002 | 38 693 354 933 $ US | #35 |
| 2001 | 39 833 564 686 $ US | #34 |
| 2000 | 46 101 675 864 $ US | #33 |
| 1999 | 37 397 130 227 $ US | #33 |
| 1998 | 32 433 118 076 $ US | #35 |
| 1997 | 31 397 234 592 $ US | #36 |
| 1996 | 29 283 354 325 $ US | #35 |
| 1995 | 27 269 172 118 $ US | #35 |
| 1994 | 23 692 120 155 $ US | #34 |
| 1993 | 20 845 996 608 $ US | #34 |
| 1992 | 19 453 754 626 $ US | #34 |
| 1991 | 17 025 033 566 $ US | #36 |
| 1990 | 17 331 518 699 $ US | #36 |
| 1989 | 15 487 859 528 $ US | #35 |
| 1988 | 14 461 397 211 $ US | #33 |
| 1987 | 13 110 640 286 $ US | #34 |
| 1986 | 11 055 703 724 $ US | #31 |
| 1985 | 10 087 096 446 $ US | #37 |
| 1984 | 9 523 963 165 $ US | #35 |
| 1983 | 8 754 928 826 $ US | #36 |
| 1982 | 8 537 572 016 $ US | #36 |
| 1981 | 9 097 719 298 $ US | #35 |
| 1980 | 8 875 098 039 $ US | #36 |
| 1979 | 7 529 200 000 $ US | #36 |
| 1978 | 6 385 882 353 $ US | #36 |
| 1977 | 5 514 000 000 $ US | #34 |
| 1976 | 4 155 000 000 $ US | #37 |
| 1975 | 3 653 333 333 $ US | #36 |
| 1974 | 3 690 000 000 $ US | #36 |
| 1973 | 2 645 000 000 $ US | #36 |
| 1972 | 2 117 500 000 $ US | #33 |
| 1971 | 1 580 000 000 $ US | #36 |
| 1970 | 1 516 666 667 $ US | #33 |
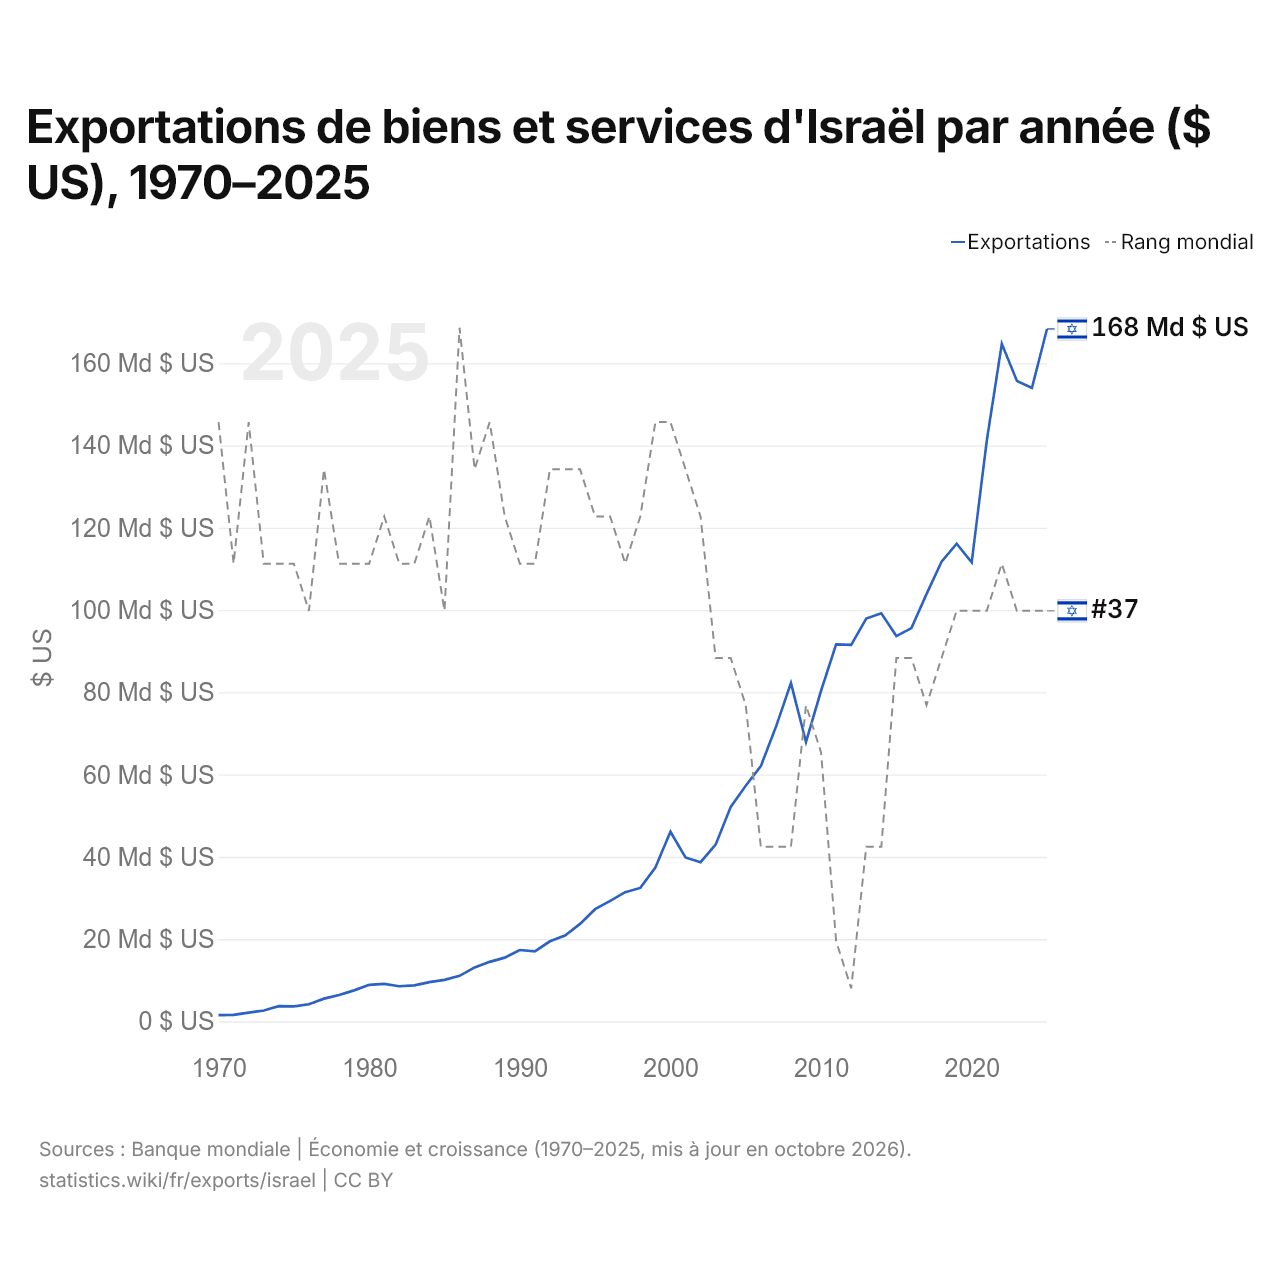
En 2025, les exportations de biens et services d'Israël s'élevaient à 168 milliards de dollars, contre 1,52 milliard de dollars en 1970. Elles se classaient au 37e rang mondial, un rang qu'elles occupent depuis 2023. Leur meilleur rang a été le 31e, occupé pour la dernière fois en 1986.
En 2025, les exportations de biens et services d'Israël étaient les 14es plus élevées de 44 pays situés en Asie. Les importations de biens et services d'Israël s'élevaient à 155 milliards de dollars en 2025, au 39e rang mondial. En 2025, les exportations d'Israël dépassaient ses importations de 13 milliards de dollars, soit un excédent commercial.
Exportations de biens d'Israël par catégorie, 2025
Exportations de biens, 2025: 58,8 Md $US
En 2025, la première catégorie des exportations de biens d'Israël était « machines, électronique et véhicules », avec 48,1 %, suivie de « produits chimiques, pharmaceutiques et plastiques », avec 14,3 %.
Destinations des exportations de biens d'Israël : les 10 premières, 2025
| Rang | Pays | Exportations de biens | Part | |
|---|---|---|---|---|
| 1 |
 États-Unis |
16,1 Md $US | 27,4 % | vs USA |
| 2 |
 Allemagne |
3,03 Md $US | 5,16 % | vs Allemagne |
| 3 |
 Chine |
2,79 Md $US | 4,74 % | vs Chine |
| 4 |
 Pays-Bas |
2,64 Md $US | 4,48 % | vs Pays-Bas |
| 5 |
 Inde |
2,47 Md $US | 4,21 % | vs Inde |
| 6 |
 Irlande |
1,53 Md $US | 2,61 % | vs Irlande |
| 7 |
 Royaume-Uni |
1,52 Md $US | 2,59 % | vs R.-U. |
| 8 |
 France |
1,41 Md $US | 2,4 % | vs France |
| 9 |
 Belgique |
1,33 Md $US | 2,27 % | vs Belgique |
| 10 |
 Italie |
1,29 Md $US | 2,19 % | vs Italie |
| Autres partenaires et non précisés | 24,6 Md $US | 41,9 % |
Exportations de biens d'Israël vers ses 5 principales destinations ($ US), 2001–2025
| Année | $ US | ||||
|---|---|---|---|---|---|
| États-Unis | Allemagne | Chine | Pays-Bas | Inde | |
| 2025 | 16 105 959 000 $ US | 3 032 858 000 $ US | 2 787 091 000 $ US | 2 635 381 000 $ US | 2 473 117 000 $ US |
| 2024 | 17 126 854 000 $ US | 2 277 631 000 $ US | 2 831 249 000 $ US | 2 702 054 000 $ US | 2 211 745 000 $ US |
| 2023 | 17 332 451 000 $ US | 2 118 594 000 $ US | 3 399 990 000 $ US | 2 399 324 000 $ US | 2 239 612 000 $ US |
| 2022 | 18 623 337 000 $ US | 1 880 346 000 $ US | 4 631 325 000 $ US | 2 439 178 000 $ US | 3 354 491 000 $ US |
| 2021 | 16 322 520 000 $ US | 1 792 353 000 $ US | 4 398 394 000 $ US | 2 233 835 000 $ US | 2 735 097 000 $ US |
| 2020 | 13 136 457 000 $ US | 1 680 936 000 $ US | 4 240 429 000 $ US | 2 462 845 000 $ US | 1 598 998 000 $ US |
| 2019 | 15 958 882 000 $ US | 1 671 156 000 $ US | 4 421 873 000 $ US | 2 176 035 000 $ US | 1 989 400 000 $ US |
| 2018 | 16 781 286 000 $ US | 1 786 021 000 $ US | 4 794 376 000 $ US | 2 272 169 000 $ US | 2 146 323 000 $ US |
| 2017 | 17 051 770 000 $ US | 1 637 954 000 $ US | 3 309 936 000 $ US | 2 303 768 000 $ US | 1 934 298 000 $ US |
| 2016 | 17 597 523 000 $ US | 1 519 514 000 $ US | 3 327 625 000 $ US | 2 139 523 000 $ US | 2 399 407 000 $ US |
| 2015 | 18 124 360 000 $ US | 1 440 448 000 $ US | 3 251 439 000 $ US | 2 153 780 000 $ US | 2 252 948 000 $ US |
| 2014 | 18 573 786 000 $ US | 1 726 840 000 $ US | 2 792 891 000 $ US | 2 484 702 000 $ US | 2 202 593 000 $ US |
| 2013 | 17 505 368 000 $ US | 1 762 169 000 $ US | 2 886 195 000 $ US | 2 094 879 000 $ US | 2 237 992 000 $ US |
| 2012 | 17 523 043 000 $ US | 1 631 071 000 $ US | 2 758 007 000 $ US | 2 248 714 000 $ US | 2 460 832 000 $ US |
| 2011 | 19 433 059 000 $ US | 1 948 949 000 $ US | 2 718 198 000 $ US | 2 160 547 000 $ US | 3 036 385 000 $ US |
| 2010 | 18 488 492 000 $ US | 1 701 039 000 $ US | 2 046 856 000 $ US | 1 817 946 000 $ US | 2 890 155 000 $ US |
| 2009 | 16 776 223 000 $ US | 1 440 165 000 $ US | 1 044 572 000 $ US | 1 550 807 000 $ US | 1 810 744 000 $ US |
| 2008 | 19 972 146 000 $ US | 1 950 437 000 $ US | 1 293 392 000 $ US | 2 035 154 000 $ US | 2 361 225 000 $ US |
| 2007 | 18 906 355 000 $ US | 1 913 080 000 $ US | 1 040 682 000 $ US | 1 609 354 000 $ US | 1 613 630 000 $ US |
| 2006 | 17 956 971 000 $ US | 1 757 763 000 $ US | 958 661 000 $ US | 1 312 159 000 $ US | 1 289 329 000 $ US |
| 2005 | 15 499 491 000 $ US | 1 345 946 000 $ US | 747 983 000 $ US | 1 259 606 000 $ US | 1 222 754 000 $ US |
| 2004 | 14 175 333 000 $ US | 1 361 038 000 $ US | 786 971 000 $ US | 1 232 896 000 $ US | 1 037 793 000 $ US |
| 2003 | 12 089 090 000 $ US | 1 123 447 000 $ US | 612 588 000 $ US | 1 085 124 000 $ US | 717 936 000 $ US |
| 2002 | 11 876 548 000 $ US | 1 029 867 000 $ US | 426 538 000 $ US | 909 150 000 $ US | 613 829 000 $ US |
| 2001 | 11 112 218 000 $ US | 1 287 851 000 $ US | 349 575 000 $ US | 829 606 000 $ US | 473 430 000 $ US |
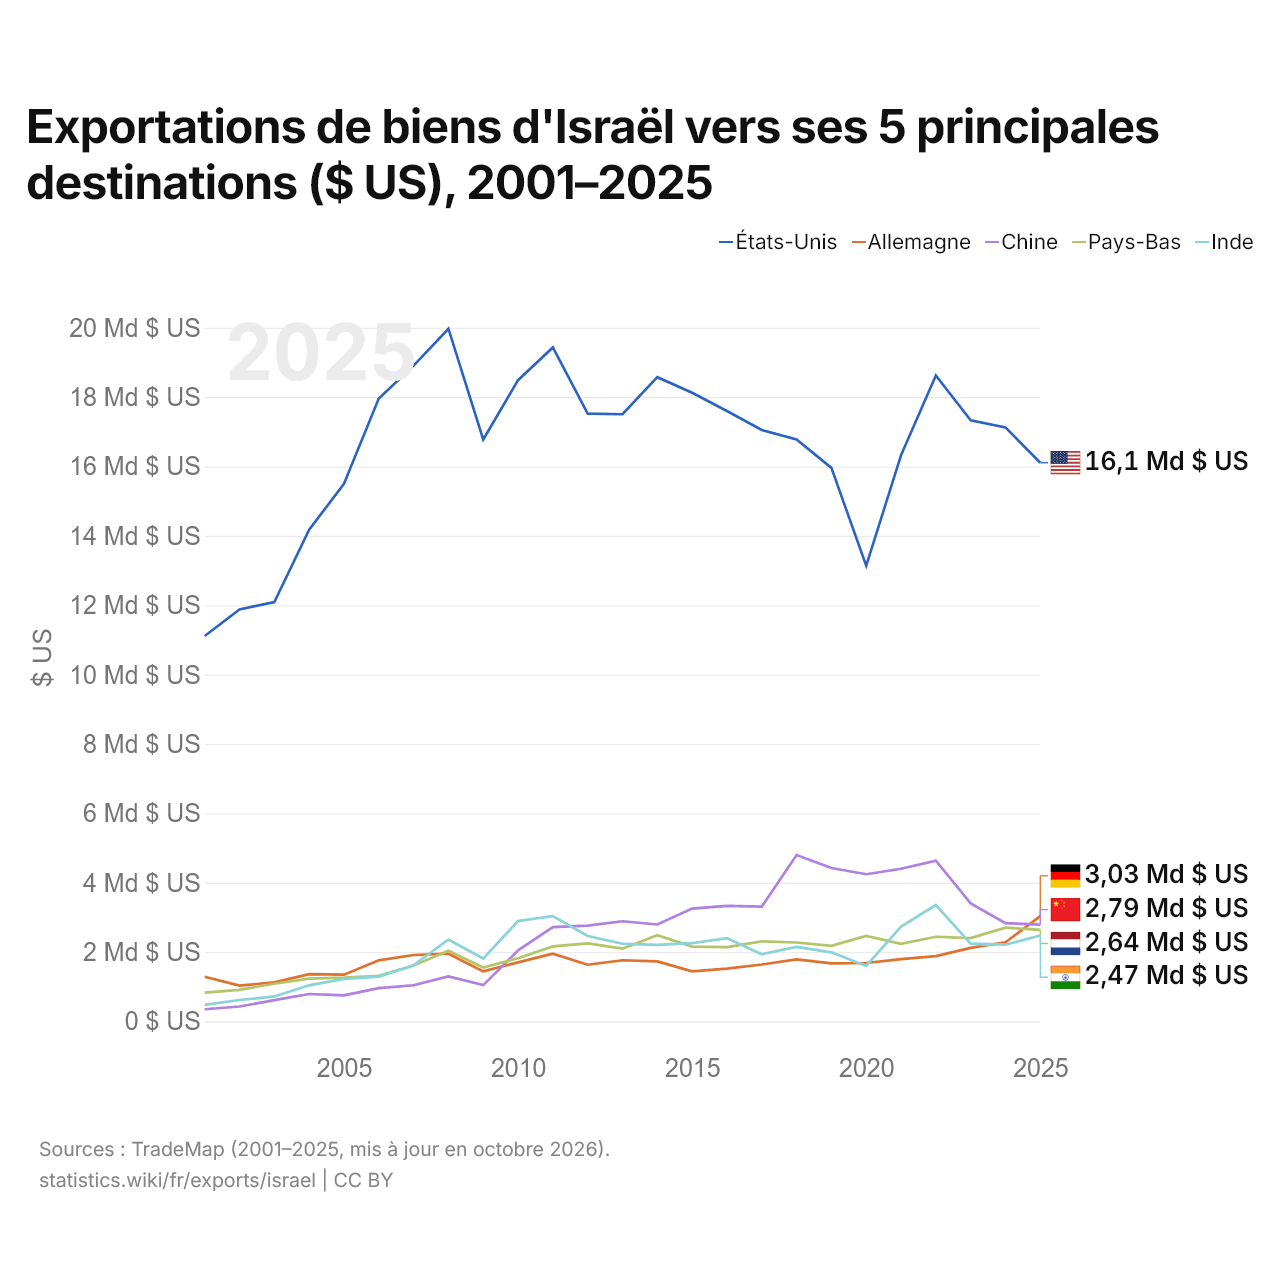
En 2025, les exportations de biens s'élevaient à 16,1 milliards de dollars vers les États-Unis, 3,03 milliards de dollars vers l'Allemagne, 2,79 milliards de dollars vers la Chine, 2,64 milliards de dollars vers les Pays-Bas et 2,47 milliards de dollars vers l'Inde. Le premier rang des cinq destinations d'Israël est occupé par les États-Unis chaque année depuis 2001. Le changement le plus récent dans leur ordre remonte à 2025, quand les exportations d'Israël vers l'Allemagne ont dépassé celles vers la Chine.
Exportations de biens et de services d'Israël ($ US), 1960–2025
| Année | $ US | |
|---|---|---|
| Biens | Services | |
| 2025 | 83 270 000 000 $ US | 90 718 200 000 $ US |
| 2024 | 72 670 700 000 $ US | 81 780 000 000 $ US |
| 2023 | 71 999 300 000 $ US | 79 737 700 000 $ US |
| 2022 | 79 630 100 000 $ US | 82 099 400 000 $ US |
| 2021 | 70 153 700 000 $ US | 70 093 800 000 $ US |
| 2020 | 58 988 800 000 $ US | 52 580 500 000 $ US |
| 2019 | 60 360 100 000 $ US | 55 543 200 000 $ US |
| 2018 | 60 170 200 000 $ US | 51 201 400 000 $ US |
| 2017 | 58 178 700 000 $ US | 45 632 600 000 $ US |
| 2016 | 55 928 300 000 $ US | 39 556 300 000 $ US |
| 2015 | 57 075 200 000 $ US | 36 416 200 000 $ US |
| 2014 | 63 219 300 000 $ US | 35 847 000 000 $ US |
| 2013 | 62 949 900 000 $ US | 34 933 800 000 $ US |
| 2012 | 60 739 800 000 $ US | 30 681 600 000 $ US |
| 2011 | 63 044 400 000 $ US | 28 558 000 000 $ US |
| 2010 | 56 247 300 000 $ US | 24 315 400 000 $ US |
| 2009 | 46 716 900 000 $ US | 21 403 800 000 $ US |
| 2008 | 58 589 500 000 $ US | 24 012 200 000 $ US |
| 2007 | 51 302 100 000 $ US | 20 398 300 000 $ US |
| 2006 | 43 958 900 000 $ US | 18 149 500 000 $ US |
| 2005 | 40 725 500 000 $ US | 16 517 100 000 $ US |
| 2004 | 37 157 700 000 $ US | 14 939 000 000 $ US |
| 2003 | 30 536 800 000 $ US | 12 478 700 000 $ US |
| 2002 | 27 714 000 000 $ US | 10 875 500 000 $ US |
| 2001 | 27 982 800 000 $ US | 11 778 300 000 $ US |
| 2000 | 30 890 200 000 $ US | 15 266 600 000 $ US |
| 1999 | 25 456 800 000 $ US | 11 989 500 000 $ US |
| 1998 | 22 778 300 000 $ US | 9 723 500 000 $ US |
| 1997 | 22 573 300 000 $ US | 8 908 200 000 $ US |
| 1996 | 21 289 100 000 $ US | 8 133 200 000 $ US |
| 1995 | 19 525 700 000 $ US | 7 974 100 000 $ US |
| 1994 | 17 241 800 000 $ US | 6 578 700 000 $ US |
| 1993 | 14 925 900 000 $ US | 5 966 800 000 $ US |
| 1992 | 13 620 800 000 $ US | 5 811 200 000 $ US |
| 1991 | 12 232 700 000 $ US | 4 670 900 000 $ US |
| 1990 | 12 743 400 000 $ US | 4 568 600 000 $ US |
| 1989 | 11 142 400 000 $ US | 4 347 900 000 $ US |
| 1988 | 10 350 300 000 $ US | 4 123 600 000 $ US |
| 1987 | 9 311 000 000 $ US | 3 798 000 000 $ US |
| 1986 | 7 893 900 000 $ US | 3 121 700 000 $ US |
| 1985 | 6 825 600 000 $ US | 3 151 700 000 $ US |
| 1984 | 6 380 100 000 $ US | 2 818 400 000 $ US |
| 1983 | 5 721 600 000 $ US | 2 750 200 000 $ US |
| 1982 | 5 749 700 000 $ US | 2 642 700 000 $ US |
| 1981 | 6 094 600 000 $ US | 2 724 100 000 $ US |
| 1980 | 5 946 000 000 $ US | 2 722 000 000 $ US |
| 1979 | 4 841 000 000 $ US | 2 318 000 000 $ US |
| 1978 | 4 104 000 000 $ US | 1 954 000 000 $ US |
| 1977 | 3 422 000 000 $ US | 1 606 000 000 $ US |
| 1976 | 2 688 000 000 $ US | 1 338 000 000 $ US |
| 1975 | 2 192 000 000 $ US | 1 126 000 000 $ US |
| 1974 | 2 029 000 000 $ US | 1 140 000 000 $ US |
| 1973 | 1 571 000 000 $ US | 848 000 000 $ US |
| 1972 | 1 227 000 000 $ US | 727 000 000 $ US |
| 1971 | 1 012 000 000 $ US | 702 000 000 $ US |
| 1970 | 814 000 000 $ US | 496 000 000 $ US |
| 1969 | 758 000 000 $ US | 455 000 000 $ US |
| 1968 | 657 000 000 $ US | 425 000 000 $ US |
| 1967 | 535 000 000 $ US | 317 000 000 $ US |
| 1966 | 480 000 000 $ US | 301 000 000 $ US |
| 1965 | 408 000 000 $ US | 264 000 000 $ US |
| 1964 | - | - |
| 1963 | - | - |
| 1962 | - | - |
| 1961 | 240 000 000 $ US | 121 000 000 $ US |
| 1960 | 213 000 000 $ US | 95 000 000 $ US |
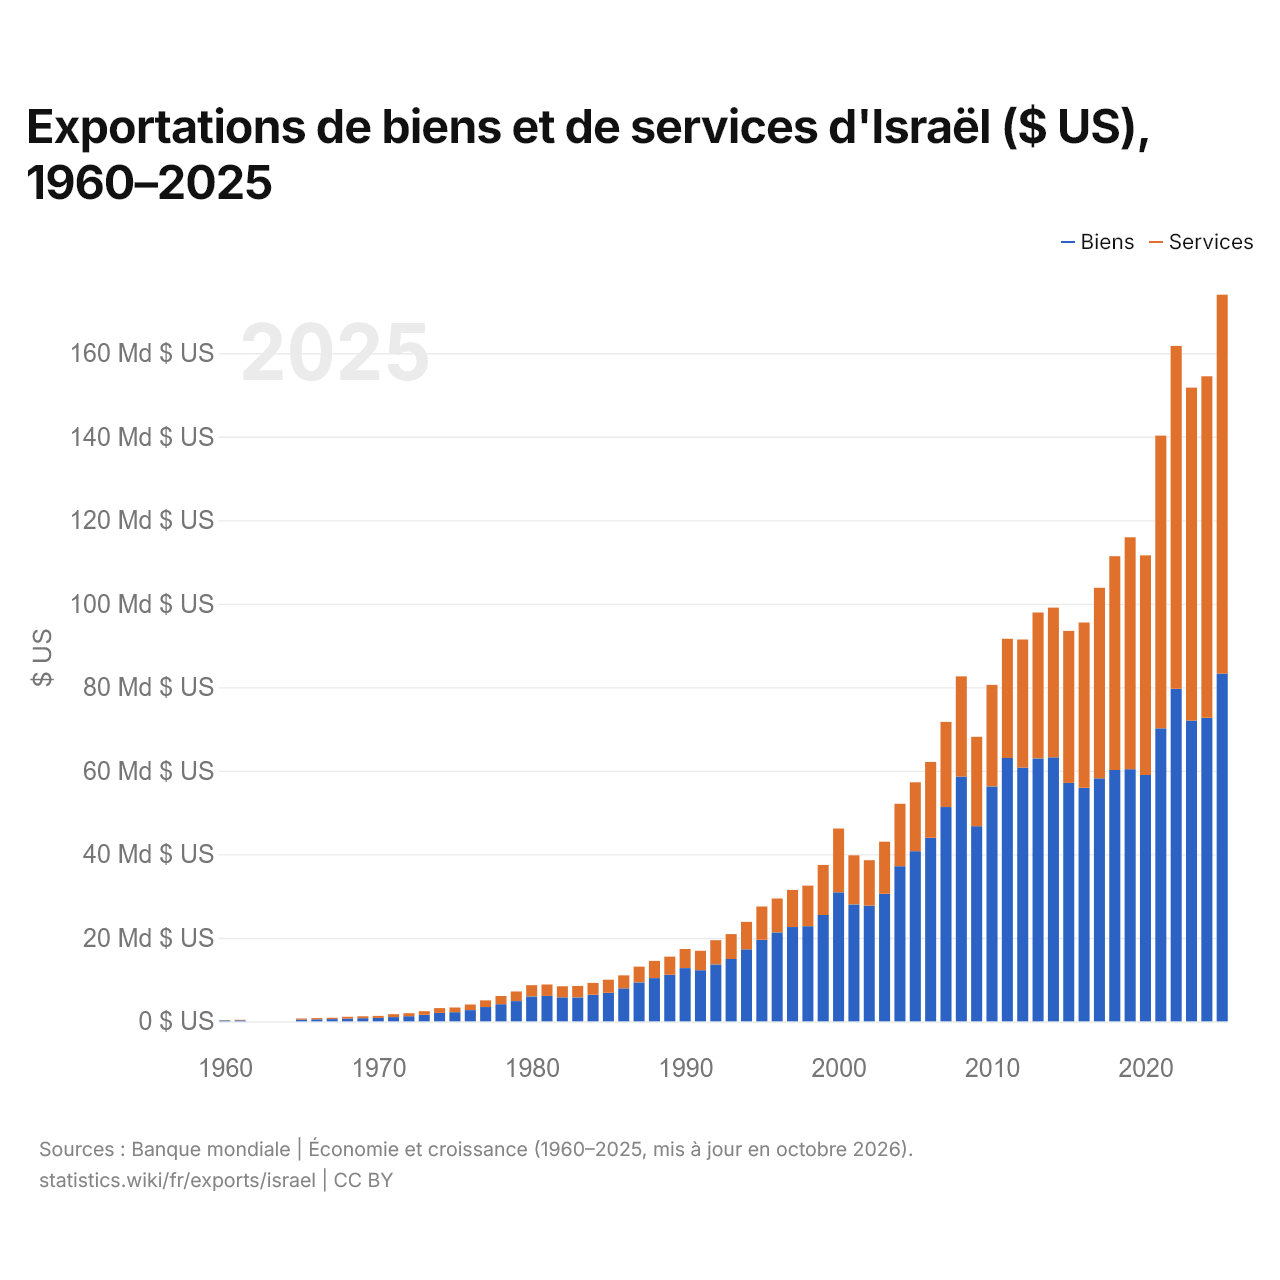
En 2025, les exportations de biens d'Israël s'élevaient à 83,3 milliards de dollars et celles de services à 90,7 milliards de dollars ; les services représentaient 52,1 % du total, contre 30,8 % en 1960.
Israël dans le classement mondial des exportations, 2025
| Rang | Pays | Exportations | Part mondiale | |
|---|---|---|---|---|
| 34 |
 Norvège |
241 Md $US | 0,69 % | |
| 35 |
 Luxembourg |
193 Md $US | 0,55 % | vs Luxembourg |
| 36 |
 Hongrie |
179 Md $US | 0,51 % | |
| 37 |
 Israël |
168 Md $US | 0,48 % | |
| 38 |
 Roumanie |
152 Md $US | 0,44 % | |
| 39 |
 Portugal |
151 Md $US | 0,43 % | vs Portugal |
| 40 |
 Finlande |
134 Md $US | 0,38 % |
Exportations de biens et services d'Israël, % du PIB, 1970–2025
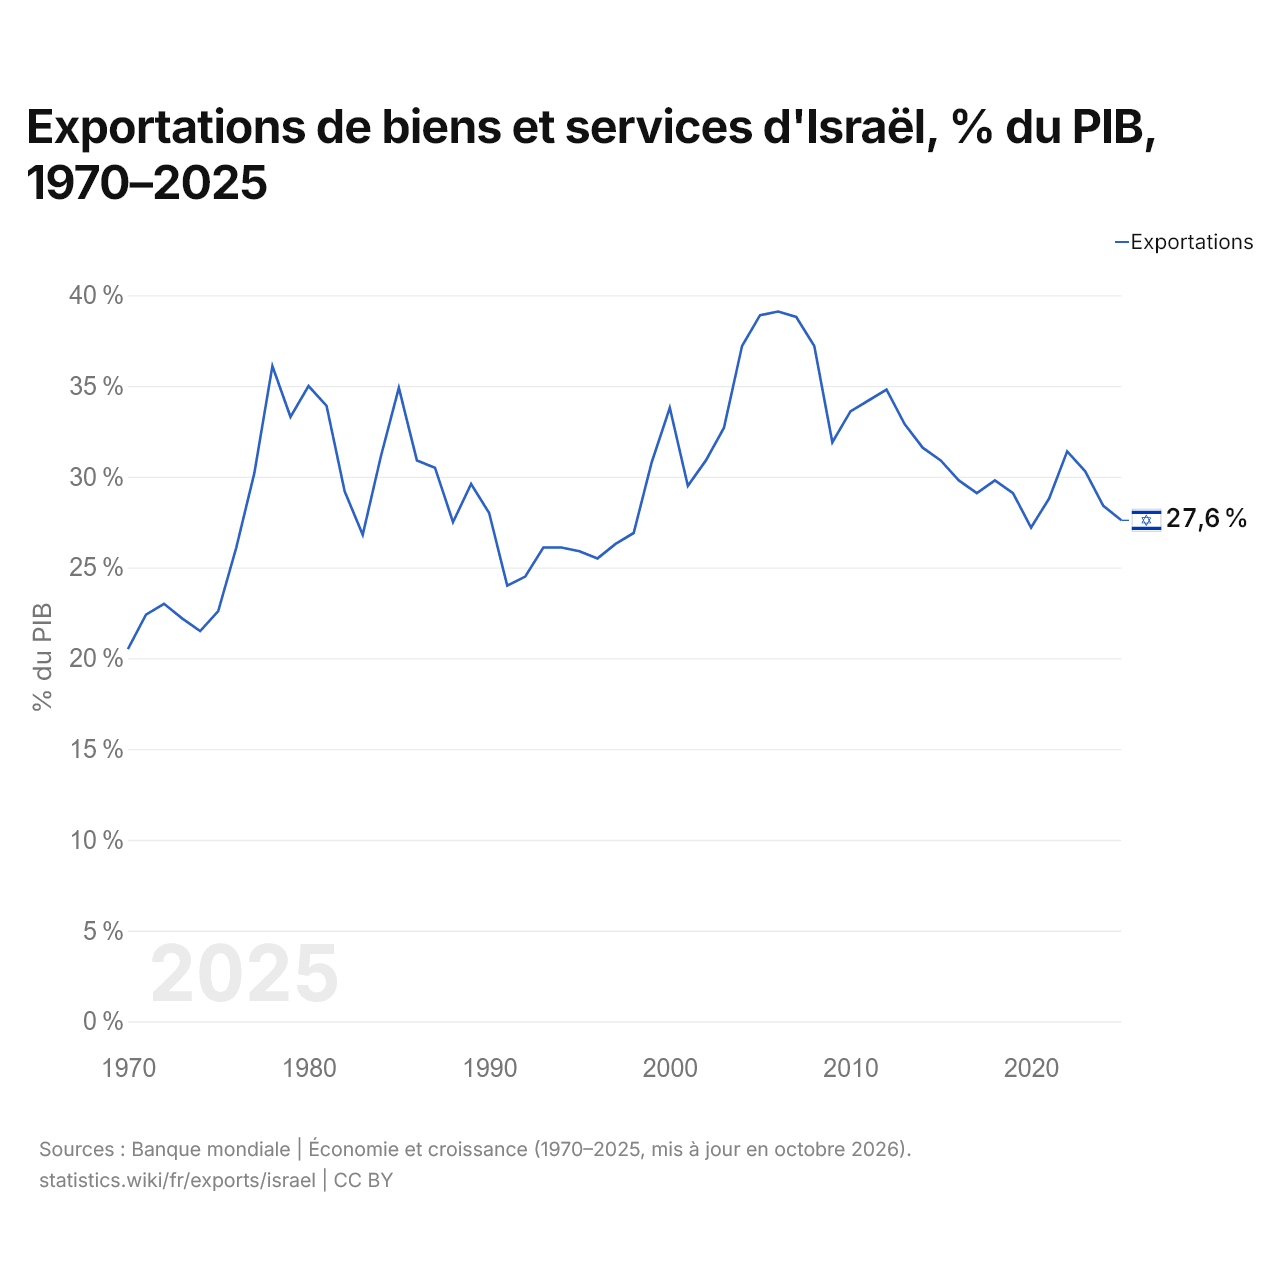
En 2025, les exportations de biens et services d'Israël équivalaient à 27,6 % de son PIB, contre 20,5 % en 1970. La part la plus élevée a été de 39,1 %, en 2006.
Comparer les exportations d'Israël avec celles d'autres pays
Sources :
- Banque mondiale | Économie et croissance (1960–2025, mis à jour en octobre 2026)
- TradeMap (2001–2025, mis à jour en octobre 2026)
Creative Commons Attribution (CC BY) : vous pouvez copier, partager, adapter et réutiliser ce contenu, y compris à des fins commerciales, à condition de citer statistics.wiki et d’indiquer les modifications apportées. Les sources citées ci-dessus peuvent avoir leurs propres conditions de licence.