
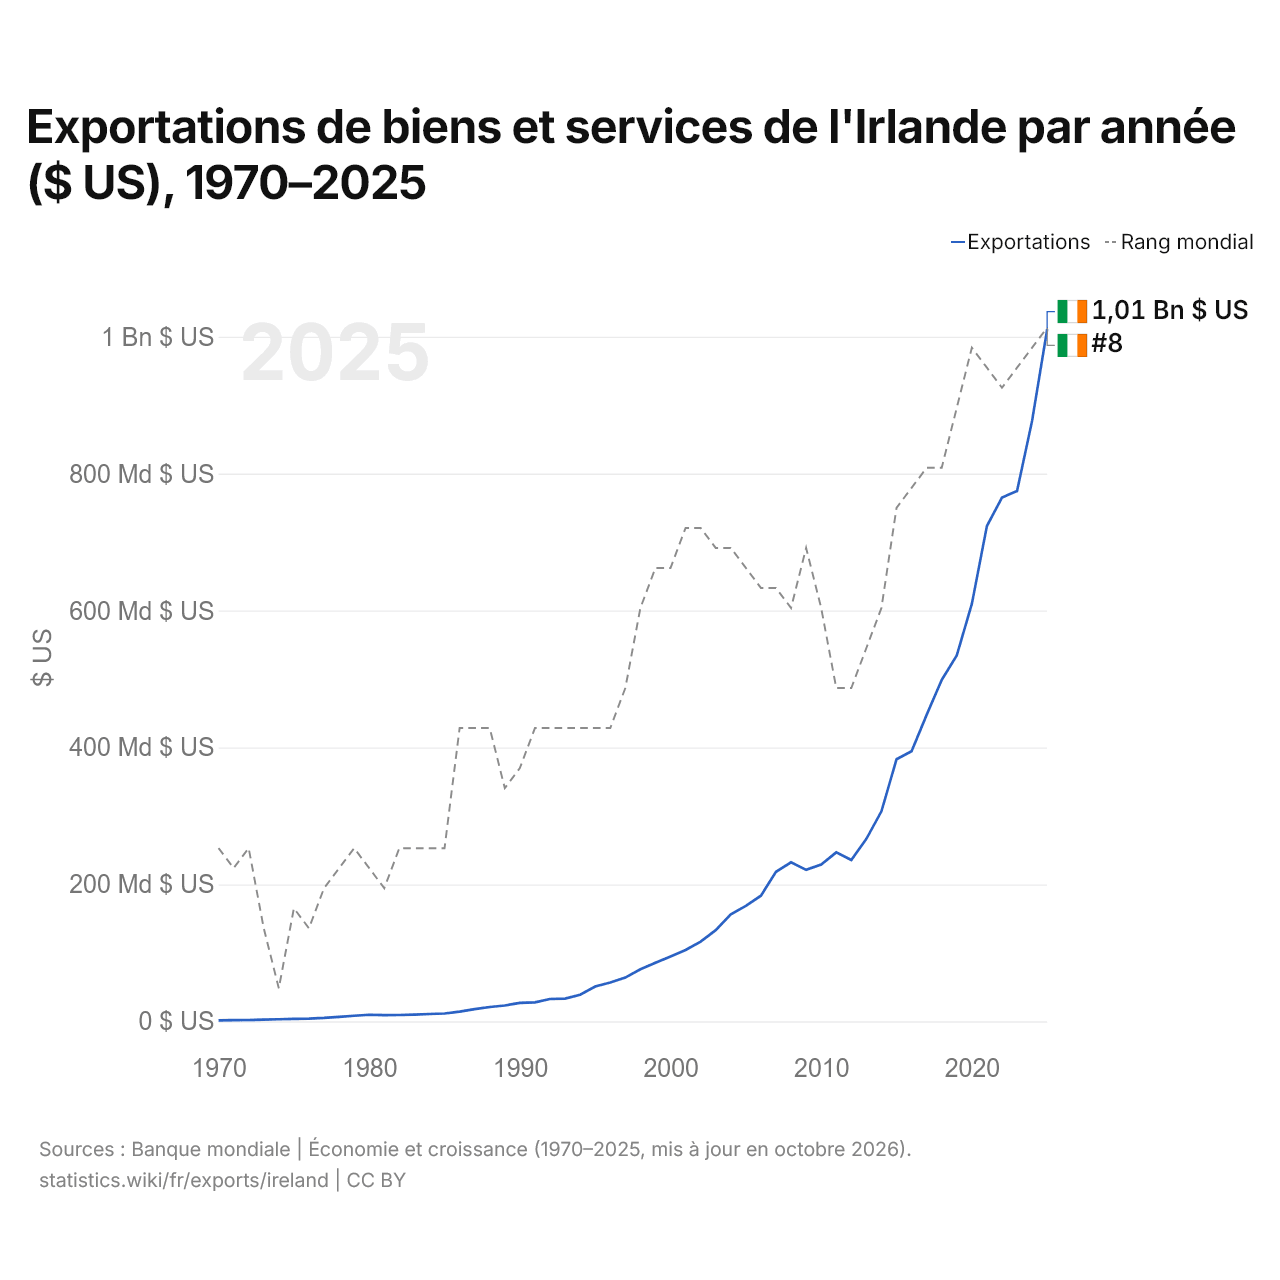
Exportations de biens et services de l'Irlande par année ($ US), 1970–2025
| Année | $ US | Rang mondial |
|---|---|---|
| Exportations | Rang mondial | |
| 2025 | 1 010 863 026 885 $ US | #8 |
| 2024 | 877 092 941 905 $ US | #9 |
| 2023 | 774 613 383 952 $ US | #10 |
| 2022 | 764 969 597 259 $ US | #11 |
| 2021 | 723 445 227 903 $ US | #10 |
| 2020 | 609 592 461 958 $ US | #9 |
| 2019 | 534 361 678 398 $ US | #12 |
| 2018 | 498 559 384 825 $ US | #15 |
| 2017 | 447 623 457 263 $ US | #15 |
| 2016 | 394 551 308 719 $ US | #16 |
| 2015 | 382 724 762 971 $ US | #17 |
| 2014 | 306 723 211 567 $ US | #22 |
| 2013 | 266 600 810 534 $ US | #24 |
| 2012 | 235 594 088 469 $ US | #26 |
| 2011 | 246 785 523 404 $ US | #26 |
| 2010 | 229 110 049 419 $ US | #22 |
| 2009 | 221 207 094 301 $ US | #19 |
| 2008 | 232 293 869 047 $ US | #22 |
| 2007 | 218 323 414 732 $ US | #21 |
| 2006 | 183 503 168 969 $ US | #21 |
| 2005 | 168 500 867 903 $ US | #20 |
| 2004 | 156 422 059 727 $ US | #19 |
| 2003 | 133 120 814 360 $ US | #19 |
| 2002 | 116 314 428 261 $ US | #18 |
| 2001 | 104 124 679 774 $ US | #18 |
| 2000 | 94 585 397 045 $ US | #20 |
| 1999 | 85 503 791 297 $ US | #20 |
| 1998 | 76 059 795 895 $ US | #22 |
| 1997 | 63 903 008 596 $ US | #26 |
| 1996 | 56 772 605 847 $ US | #28 |
| 1995 | 50 831 584 596 $ US | #28 |
| 1994 | 38 803 585 395 $ US | #28 |
| 1993 | 33 215 365 740 $ US | #28 |
| 1992 | 32 659 481 442 $ US | #28 |
| 1991 | 27 672 807 707 $ US | #28 |
| 1990 | 26 973 247 362 $ US | #30 |
| 1989 | 23 122 490 233 $ US | #31 |
| 1988 | 20 998 862 627 $ US | #28 |
| 1987 | 17 787 856 976 $ US | #28 |
| 1986 | 14 098 603 222 $ US | #28 |
| 1985 | 11 493 857 750 $ US | #34 |
| 1984 | 10 718 897 046 $ US | #34 |
| 1983 | 9 750 540 276 $ US | #34 |
| 1982 | 9 241 993 070 $ US | #34 |
| 1981 | 8 965 729 497 $ US | #36 |
| 1980 | 9 647 826 509 $ US | #35 |
| 1979 | 8 154 121 534 $ US | #34 |
| 1978 | 6 547 731 803 $ US | #35 |
| 1977 | 4 973 657 096 $ US | #36 |
| 1976 | 3 914 804 699 $ US | #38 |
| 1975 | 3 624 897 213 $ US | #37 |
| 1974 | 3 009 300 313 $ US | #41 |
| 1973 | 2 545 049 199 $ US | #38 |
| 1972 | 1 954 551 534 $ US | #34 |
| 1971 | 1 647 964 737 $ US | #35 |
| 1970 | 1 454 713 665 $ US | #34 |
En 2025, les exportations de biens et services de l'Irlande s'élevaient à 1,01 billion de dollars, contre 1,45 milliard de dollars en 1970. Elles se classaient au 8e rang mondial, en hausse par rapport au 9e rang en 2024.
En 2025, les exportations de biens et services de l'Irlande étaient les 5es plus élevées de 41 pays situés en Europe. Les importations de biens et services de l'Irlande s'élevaient à 721 milliards de dollars en 2025, au 15e rang mondial. En 2025, les exportations de l'Irlande dépassaient ses importations de 290 milliards de dollars, soit un excédent commercial.
Exportations de biens de l'Irlande par catégorie, 2025
Exportations de biens, 2025: 291 Md $US
En 2025, la première catégorie des exportations de biens de l'Irlande était « produits chimiques, pharmaceutiques et plastiques », avec 67,2 %, suivie de « machines, électronique et véhicules », avec 21,7 %.
Destinations des exportations de biens de l'Irlande : les 10 premières, 2025
| Rang | Pays | Exportations de biens | Part | |
|---|---|---|---|---|
| 1 |
 États-Unis |
124 Md $US | 42,5 % | vs USA |
| 2 |
 Pays-Bas |
29,0 Md $US | 9,94 % | vs Pays-Bas |
| 3 |
 Royaume-Uni |
23,3 Md $US | 7,99 % | vs R.-U. |
| 4 |
 Belgique |
17,7 Md $US | 6,08 % | vs Belgique |
| 5 |
 Allemagne |
17,3 Md $US | 5,93 % | vs Allemagne |
| 6 |
 Chine |
9,35 Md $US | 3,21 % | |
| 7 |
 Italie |
7,98 Md $US | 2,74 % | vs Italie |
| 8 |
 France |
6,50 Md $US | 2,23 % | vs France |
| 9 |
 Espagne |
4,55 Md $US | 1,56 % | vs Espagne |
| 10 |
 Japon |
4,26 Md $US | 1,46 % | |
| Autres partenaires et non précisés | 47,5 Md $US | 16,3 % |
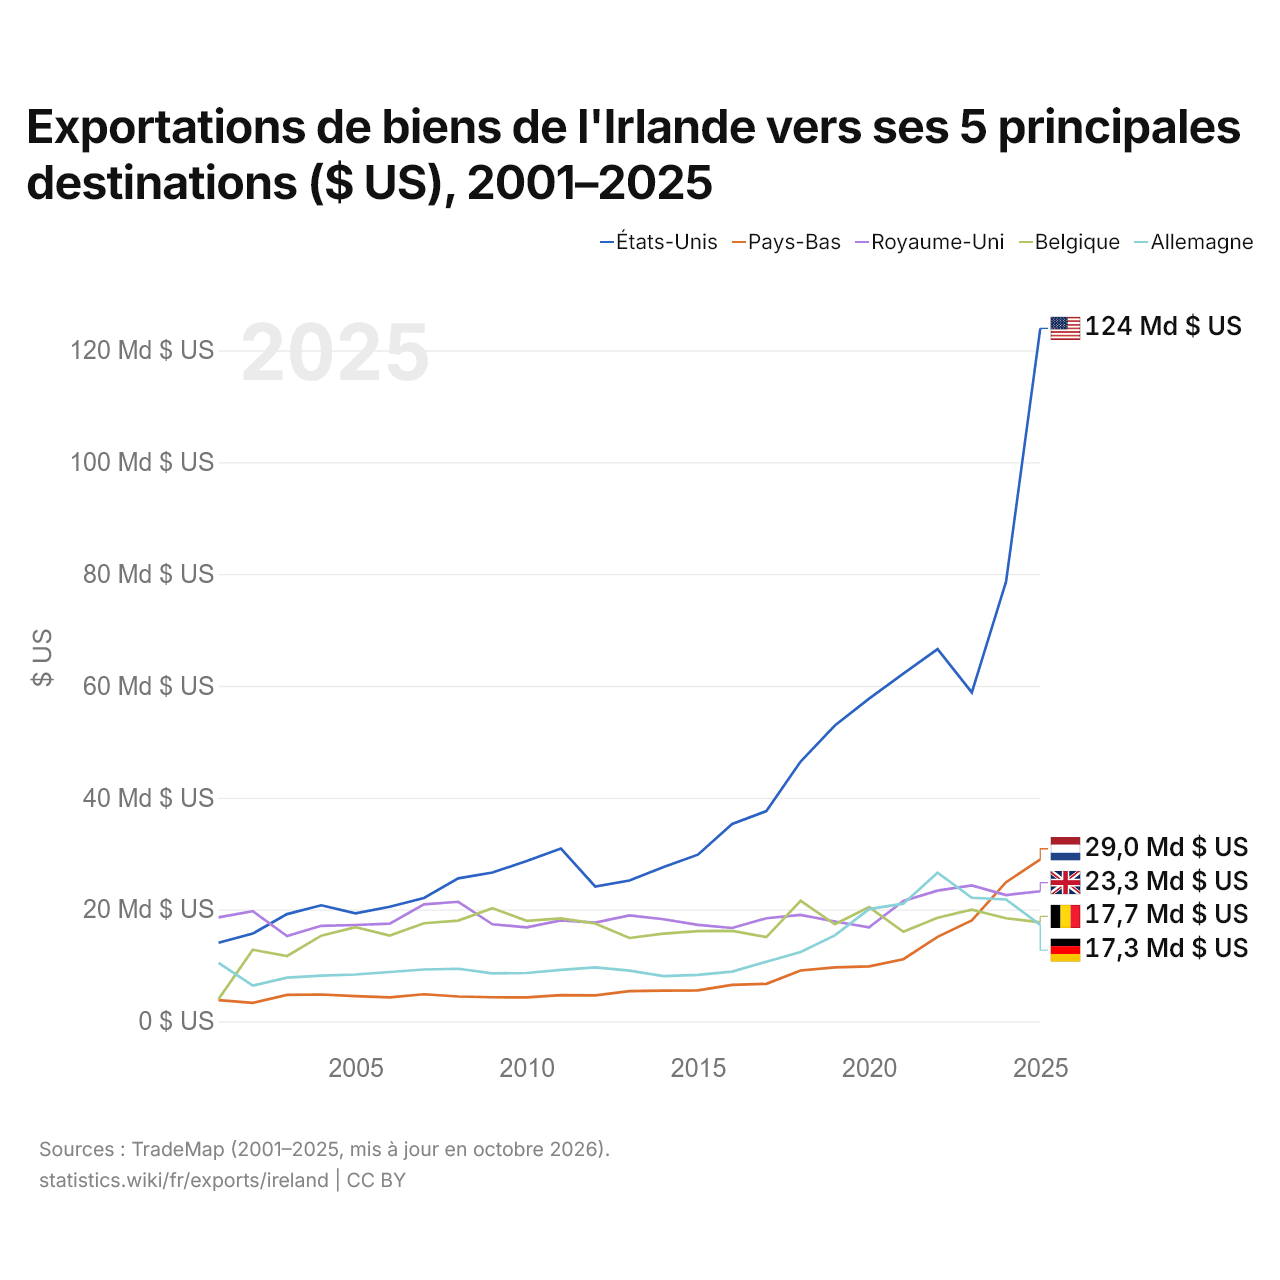
Exportations de biens de l'Irlande vers ses 5 principales destinations ($ US), 2001–2025
| Année | $ US | ||||
|---|---|---|---|---|---|
| États-Unis | Pays-Bas | Royaume-Uni | Belgique | Allemagne | |
| 2025 | 123 929 698 000 $ US | 28 951 183 000 $ US | 23 273 276 000 $ US | 17 711 284 000 $ US | 17 259 151 000 $ US |
| 2024 | 78 611 987 000 $ US | 24 887 001 000 $ US | 22 583 569 000 $ US | 18 434 405 000 $ US | 21 789 562 000 $ US |
| 2023 | 58 828 192 000 $ US | 18 049 777 000 $ US | 24 306 655 000 $ US | 19 965 103 000 $ US | 22 092 336 000 $ US |
| 2022 | 66 570 622 000 $ US | 15 100 975 000 $ US | 23 369 838 000 $ US | 18 537 731 000 $ US | 26 577 652 000 $ US |
| 2021 | 62 173 544 000 $ US | 11 113 210 000 $ US | 21 521 971 000 $ US | 16 002 665 000 $ US | 21 039 433 000 $ US |
| 2020 | 57 722 044 000 $ US | 9 821 650 000 $ US | 16 807 291 000 $ US | 20 425 495 000 $ US | 20 077 695 000 $ US |
| 2019 | 52 913 042 000 $ US | 9 652 374 000 $ US | 17 853 895 000 $ US | 17 357 207 000 $ US | 15 371 668 000 $ US |
| 2018 | 46 466 807 000 $ US | 9 097 519 000 $ US | 19 041 187 000 $ US | 21 552 678 000 $ US | 12 388 472 000 $ US |
| 2017 | 37 600 169 000 $ US | 6 701 155 000 $ US | 18 427 900 000 $ US | 15 058 444 000 $ US | 10 662 606 000 $ US |
| 2016 | 35 308 078 000 $ US | 6 523 016 000 $ US | 16 697 795 000 $ US | 16 178 613 000 $ US | 8 884 699 000 $ US |
| 2015 | 29 803 356 000 $ US | 5 532 568 000 $ US | 17 257 528 000 $ US | 16 134 586 000 $ US | 8 296 096 000 $ US |
| 2014 | 27 585 868 000 $ US | 5 504 221 000 $ US | 18 256 928 000 $ US | 15 683 181 000 $ US | 8 078 826 000 $ US |
| 2013 | 25 180 779 000 $ US | 5 408 392 000 $ US | 18 954 378 000 $ US | 14 910 373 000 $ US | 9 080 902 000 $ US |
| 2012 | 24 120 240 000 $ US | 4 633 815 000 $ US | 17 652 160 000 $ US | 17 507 819 000 $ US | 9 635 101 000 $ US |
| 2011 | 30 906 687 000 $ US | 4 690 021 000 $ US | 18 050 074 000 $ US | 18 411 644 000 $ US | 9 200 266 000 $ US |
| 2010 | 28 661 248 000 $ US | 4 279 480 000 $ US | 16 806 253 000 $ US | 17 967 132 000 $ US | 8 637 907 000 $ US |
| 2009 | 26 627 823 000 $ US | 4 302 216 000 $ US | 17 355 175 000 $ US | 20 238 105 000 $ US | 8 580 670 000 $ US |
| 2008 | 25 578 086 000 $ US | 4 447 668 000 $ US | 21 380 694 000 $ US | 18 021 364 000 $ US | 9 403 456 000 $ US |
| 2007 | 22 071 511 000 $ US | 4 849 384 000 $ US | 20 918 973 000 $ US | 17 534 337 000 $ US | 9 268 934 000 $ US |
| 2006 | 20 484 086 000 $ US | 4 271 486 000 $ US | 17 473 091 000 $ US | 15 338 620 000 $ US | 8 817 991 000 $ US |
| 2005 | 19 301 630 000 $ US | 4 502 338 000 $ US | 17 233 276 000 $ US | 16 838 505 000 $ US | 8 370 843 000 $ US |
| 2004 | 20 759 009 000 $ US | 4 804 868 000 $ US | 17 085 395 000 $ US | 15 319 680 000 $ US | 8 184 629 000 $ US |
| 2003 | 19 179 177 000 $ US | 4 731 862 000 $ US | 15 252 411 000 $ US | 11 686 526 000 $ US | 7 821 542 000 $ US |
| 2002 | 15 695 289 000 $ US | 3 299 297 000 $ US | 19 705 158 000 $ US | 12 794 113 000 $ US | 6 385 806 000 $ US |
| 2001 | 14 063 327 000 $ US | 3 794 671 000 $ US | 18 598 084 000 $ US | 3 968 475 000 $ US | 10 458 368 000 $ US |
En 2025, les exportations de biens s'élevaient à 124 milliards de dollars vers les États-Unis, 29 milliards de dollars vers les Pays-Bas, 23,3 milliards de dollars vers le Royaume-Uni, 17,7 milliards de dollars vers la Belgique et 17,3 milliards de dollars vers l'Allemagne. Le premier rang des cinq destinations de l'Irlande est occupé par les États-Unis depuis 2003. Le changement le plus récent dans leur ordre remonte à 2025, quand les exportations de l'Irlande vers la Belgique ont dépassé celles vers l'Allemagne.
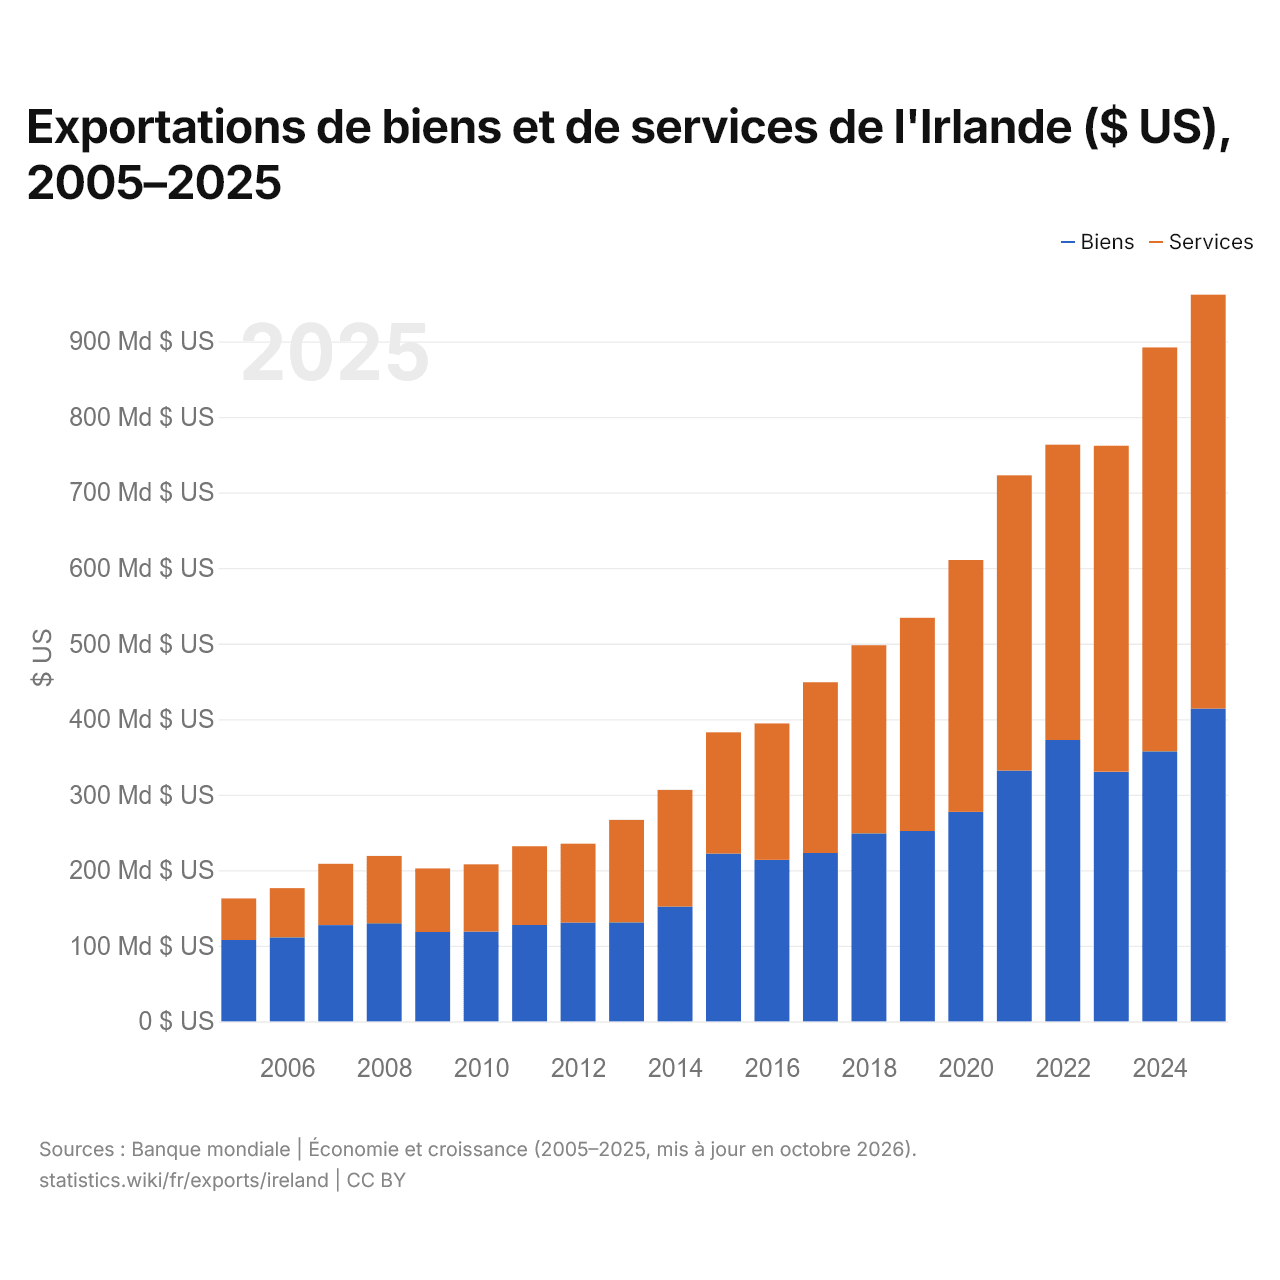
Exportations de biens et de services de l'Irlande ($ US), 2005–2025
| Année | $ US | |
|---|---|---|
| Biens | Services | |
| 2025 | 413 880 764 608 $ US | 547 958 263 897 $ US |
| 2024 | 357 422 118 184 $ US | 534 519 423 294 $ US |
| 2023 | 330 408 271 578 $ US | 431 467 530 708 $ US |
| 2022 | 372 476 025 312 $ US | 390 757 463 858 $ US |
| 2021 | 331 824 330 110 $ US | 390 830 860 371 $ US |
| 2020 | 277 233 362 824 $ US | 333 358 995 512 $ US |
| 2019 | 251 976 604 138 $ US | 282 182 753 737 $ US |
| 2018 | 248 886 212 786 $ US | 248 972 747 084 $ US |
| 2017 | 222 837 314 081 $ US | 225 947 927 597 $ US |
| 2016 | 213 776 428 562 $ US | 180 552 347 118 $ US |
| 2015 | 222 192 699 653 $ US | 160 363 162 758 $ US |
| 2014 | 151 914 173 062 $ US | 154 449 639 839 $ US |
| 2013 | 131 062 218 460 $ US | 135 554 803 593 $ US |
| 2012 | 130 884 847 746 $ US | 104 209 198 410 $ US |
| 2011 | 127 554 813 253 $ US | 104 212 480 396 $ US |
| 2010 | 118 764 060 275 $ US | 89 075 445 635 $ US |
| 2009 | 118 315 187 802 $ US | 84 029 042 130 $ US |
| 2008 | 129 847 702 586 $ US | 89 062 745 475 $ US |
| 2007 | 127 342 559 641 $ US | 81 157 647 642 $ US |
| 2006 | 111 216 079 273 $ US | 65 095 994 817 $ US |
| 2005 | 107 715 281 320 $ US | 54 956 632 354 $ US |
En 2025, les exportations de biens de l'Irlande s'élevaient à 414 milliards de dollars et celles de services à 548 milliards de dollars ; les services représentaient 57,0 % du total, contre 33,8 % en 2005.
L'Irlande dans le classement mondial des exportations, 2025
| Rang | Pays | Exportations | Part mondiale | |
|---|---|---|---|---|
| 5 |
France
|
1,12 Bn $US | 3,22 % | vs France |
| 6 |
Pays-Bas
|
1,08 Bn $US | 3,08 % | vs Pays-Bas |
| 7 |
 Singapour |
1,07 Bn $US | 3,08 % | |
| 8 |
 Irlande |
1,01 Bn $US | 2,9 % | |
| 9 |
Japon
|
971 Md $US | 2,78 % | |
| 10 |
 Inde |
881 Md $US | 2,52 % | |
| 11 |
 Corée du Sud |
857 Md $US | 2,46 % |
Exportations de biens et services de l'Irlande, % du PIB, 1970–2025
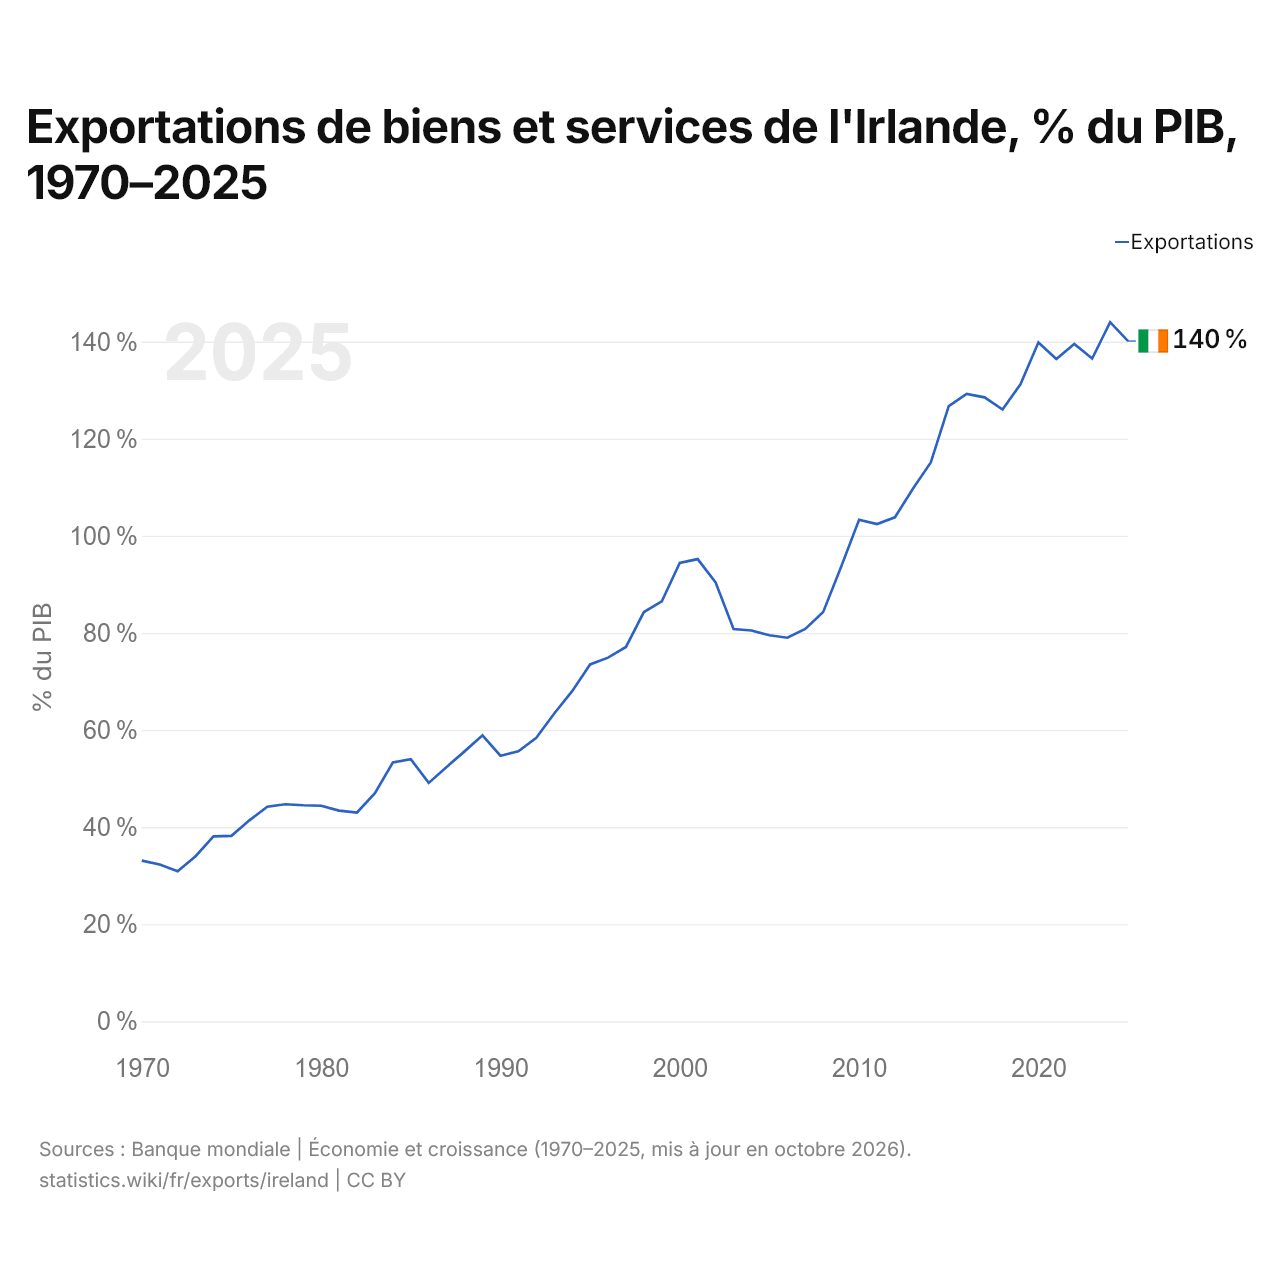
En 2025, les exportations de biens et services de l'Irlande équivalaient à 140,1 % de son PIB, contre 33,1 % en 1970. La part la plus élevée a été de 144,0 %, en 2024.
Comparer les exportations de l'Irlande avec celles d'autres pays
Sources :
- TradeMap (2001–2025, mis à jour en octobre 2026)
- Banque mondiale | Économie et croissance (1970–2025, mis à jour en octobre 2026)
Creative Commons Attribution (CC BY) : vous pouvez copier, partager, adapter et réutiliser ce contenu, y compris à des fins commerciales, à condition de citer statistics.wiki et d’indiquer les modifications apportées. Les sources citées ci-dessus peuvent avoir leurs propres conditions de licence.