
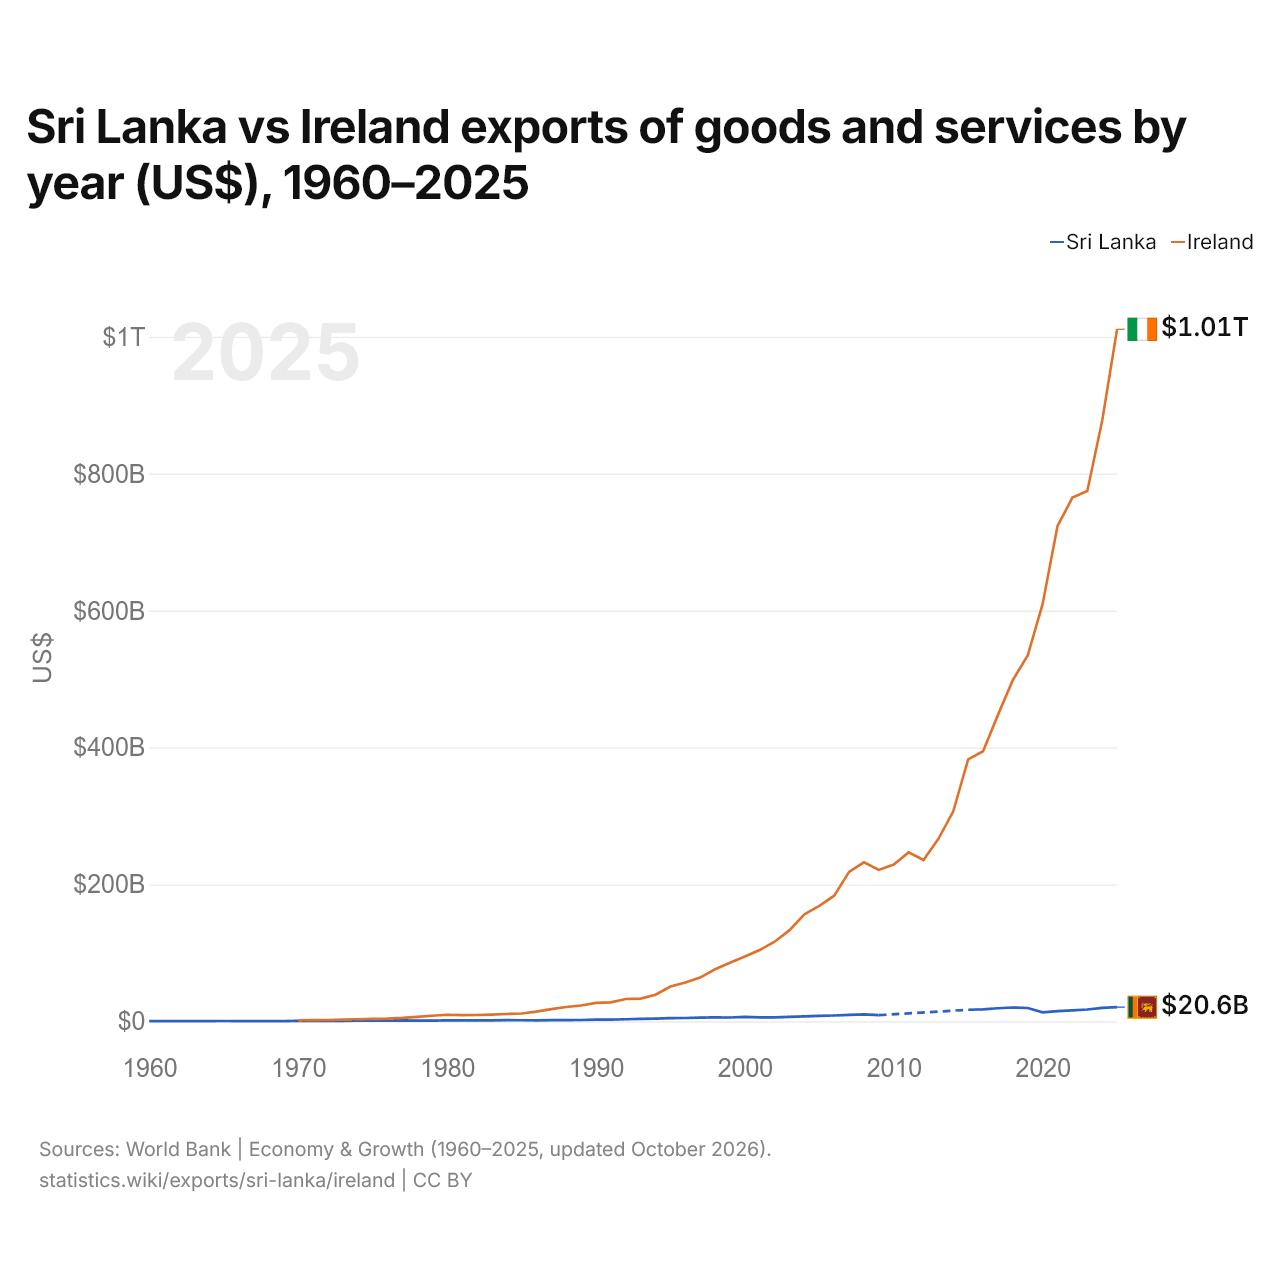
Sri Lanka vs Irlande : exportations de biens et services par année ($ US), 1960–2025
| Année | $ US | |
|---|---|---|
 Sri Lanka |
 Irlande |
|
| 2025 | 20 641 294 806 $ US | 1 010 863 026 885 $ US |
| 2024 | 19 680 136 442 $ US | 877 092 941 905 $ US |
| 2023 | 17 320 146 765 $ US | 774 613 383 952 $ US |
| 2022 | 15 984 910 773 $ US | 764 969 597 259 $ US |
| 2021 | 14 985 052 393 $ US | 723 445 227 903 $ US |
| 2020 | 13 036 289 408 $ US | 609 592 461 958 $ US |
| 2019 | 19 422 660 165 $ US | 534 361 678 398 $ US |
| 2018 | 20 255 985 244 $ US | 498 559 384 825 $ US |
| 2017 | 19 085 446 206 $ US | 447 623 457 263 $ US |
| 2016 | 17 445 193 522 $ US | 394 551 308 719 $ US |
| 2015 | 16 927 340 151 $ US | 382 724 762 971 $ US |
| 2014 | - | 306 723 211 567 $ US |
| 2013 | - | 266 600 810 534 $ US |
| 2012 | - | 235 594 088 469 $ US |
| 2011 | - | 246 785 523 404 $ US |
| 2010 | - | 229 110 049 419 $ US |
| 2009 | 8 972 038 339 $ US | 221 207 094 301 $ US |
| 2008 | 10 113 919 887 $ US | 232 293 869 047 $ US |
| 2007 | 9 418 771 914 $ US | 218 323 414 732 $ US |
| 2006 | 8 516 554 444 $ US | 183 503 168 969 $ US |
| 2005 | 7 892 069 652 $ US | 168 500 867 903 $ US |
| 2004 | 7 300 256 942 $ US | 156 422 059 727 $ US |
| 2003 | 6 543 193 121 $ US | 133 120 814 360 $ US |
| 2002 | 5 773 455 294 $ US | 116 314 428 261 $ US |
| 2001 | 5 879 570 278 $ US | 104 124 679 774 $ US |
| 2000 | 6 475 000 000 $ US | 94 585 397 045 $ US |
| 1999 | 5 575 176 093 $ US | 85 503 791 297 $ US |
| 1998 | 5 712 292 925 $ US | 76 059 795 895 $ US |
| 1997 | 5 514 301 315 $ US | 63 903 008 596 $ US |
| 1996 | 4 860 502 985 $ US | 56 772 605 847 $ US |
| 1995 | 4 638 263 415 $ US | 50 831 584 596 $ US |
| 1994 | 3 962 059 895 $ US | 38 803 585 395 $ US |
| 1993 | 3 494 577 815 $ US | 33 215 365 740 $ US |
| 1992 | 3 082 683 094 $ US | 32 659 481 442 $ US |
| 1991 | 2 586 802 030 $ US | 27 672 807 707 $ US |
| 1990 | 2 424 288 567 $ US | 26 973 247 362 $ US |
| 1989 | 1 904 743 412 $ US | 23 122 490 233 $ US |
| 1988 | 1 819 710 783 $ US | 20 998 862 627 $ US |
| 1987 | 1 683 389 946 $ US | 17 787 856 976 $ US |
| 1986 | 1 519 200 571 $ US | 14 098 603 222 $ US |
| 1985 | 1 555 117 820 $ US | 11 493 857 750 $ US |
| 1984 | 1 740 762 579 $ US | 10 718 897 046 $ US |
| 1983 | 1 360 645 984 $ US | 9 750 540 276 $ US |
| 1982 | 1 304 565 113 $ US | 9 241 993 070 $ US |
| 1981 | 1 345 038 961 $ US | 8 965 729 497 $ US |
| 1980 | 1 296 672 716 $ US | 9 647 826 509 $ US |
| 1979 | 1 134 232 498 $ US | 8 154 121 534 $ US |
| 1978 | 950 352 338 $ US | 6 547 731 803 $ US |
| 1977 | 1 387 936 866 $ US | 4 973 657 096 $ US |
| 1976 | 1 043 162 901 $ US | 3 914 804 699 $ US |
| 1975 | 1 042 225 392 $ US | 3 624 897 213 $ US |
| 1974 | 944 812 030 $ US | 3 009 300 313 $ US |
| 1973 | 700 156 250 $ US | 2 545 049 199 $ US |
| 1972 | 570 184 255 $ US | 1 954 551 534 $ US |
| 1971 | 583 136 594 $ US | 1 647 964 737 $ US |
| 1970 | 584 537 815 $ US | 1 454 713 665 $ US |
| 1969 | 361 512 605 $ US | - |
| 1968 | 371 463 229 $ US | - |
| 1967 | 380 452 675 $ US | - |
| 1966 | 391 806 723 $ US | - |
| 1965 | 439 915 966 $ US | - |
| 1964 | 322 401 284 $ US | - |
| 1963 | 319 557 569 $ US | - |
| 1962 | 398 590 402 $ US | - |
| 1961 | 397 732 380 $ US | - |
| 1960 | 422 303 067 $ US | - |
En 2025, les exportations de biens et services du Sri Lanka s'élevaient à 20,6 milliards de dollars et celles de l'Irlande à 1,01 billion de dollars : celles de l'Irlande étaient 49 fois plus élevées. En 1970, les exportations de l'Irlande étaient 2,5 fois plus élevées : 585 millions de dollars pour le Sri Lanka et 1,45 milliard de dollars pour l'Irlande.
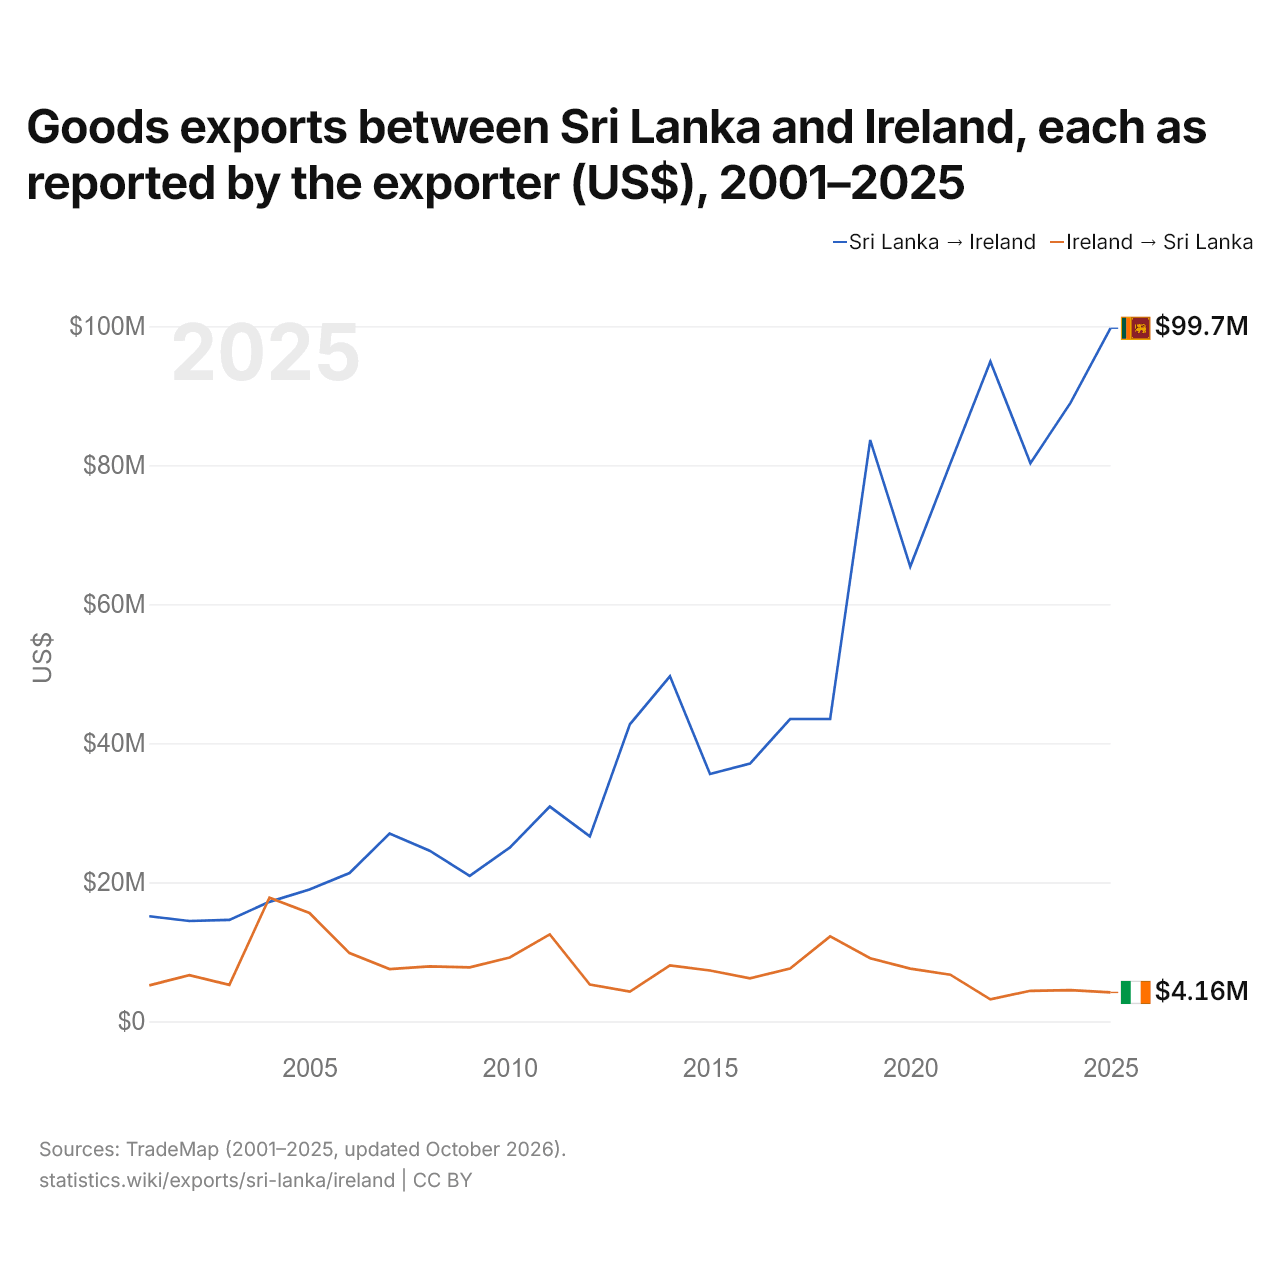
Exportations de biens entre le Sri Lanka et l'Irlande, selon chaque exportateur ($ US), 2001–2025
| Année | $ US | |
|---|---|---|
| Sri Lanka → Irlande | Irlande → Sri Lanka | |
| 2025 | 99 701 000 $ US | 4 159 000 $ US |
| 2024 | 88 957 000 $ US | 4 500 000 $ US |
| 2023 | 80 291 000 $ US | 4 390 000 $ US |
| 2022 | 94 908 000 $ US | 3 165 000 $ US |
| 2021 | 80 235 000 $ US | 6 706 000 $ US |
| 2020 | 65 409 000 $ US | 7 576 000 $ US |
| 2019 | 83 615 000 $ US | 9 085 000 $ US |
| 2018 | 43 492 000 $ US | 12 212 000 $ US |
| 2017 | 43 492 000 $ US | 7 592 000 $ US |
| 2016 | 37 075 000 $ US | 6 182 000 $ US |
| 2015 | 35 581 000 $ US | 7 317 000 $ US |
| 2014 | 49 631 000 $ US | 8 040 000 $ US |
| 2013 | 42 731 000 $ US | 4 267 000 $ US |
| 2012 | 26 598 000 $ US | 5 291 000 $ US |
| 2011 | 30 890 000 $ US | 12 497 000 $ US |
| 2010 | 24 982 000 $ US | 9 189 000 $ US |
| 2009 | 20 930 000 $ US | 7 770 000 $ US |
| 2008 | 24 553 000 $ US | 7 900 000 $ US |
| 2007 | 27 009 000 $ US | 7 516 000 $ US |
| 2006 | 21 328 000 $ US | 9 813 000 $ US |
| 2005 | 18 976 000 $ US | 15 592 000 $ US |
| 2004 | 17 186 000 $ US | 17 794 000 $ US |
| 2003 | 14 591 000 $ US | 5 248 000 $ US |
| 2002 | 14 437 000 $ US | 6 647 000 $ US |
| 2001 | 15 115 000 $ US | 5 173 000 $ US |
En 2025, les exportations de biens du Sri Lanka vers l'Irlande, selon le Sri Lanka, s'élevaient à 99,7 millions de dollars, et celles de l'Irlande vers le Sri Lanka, selon l'Irlande, à 4,16 millions de dollars : 24 fois plus pour celles du Sri Lanka. En 2001, elles s'élevaient à 15,1 millions de dollars pour le Sri Lanka et à 5,17 millions de dollars pour l'Irlande.
Sri Lanka vs Irlande : chiffres des exportations
|
Sri Lanka
|
Irlande
|
|
|---|---|---|
| Exportations | 20,6 Md $US (2025) | 1,01 Bn $US (2025) |
| Rang mondial | 89/176 | 8/176 |
| Part mondiale | 0,06 % | 2,9 % |
| % du PIB | 19,0 % | 140,1 % |
| Première catégorie de biens | Textiles, vêtements, chaussures, meubles et jouets (44,1 %, 2025) | Produits chimiques, pharmaceutiques et plastiques (67,2 %, 2025) |
| Première destination des biens | États-Unis (22,7 %, 2025) | États-Unis (42,5 %, 2025) |
Comparer les exportations de 2 pays au choix
Sources :
- Banque mondiale | Économie et croissance (1960–2025, mis à jour en octobre 2026)
- TradeMap (2001–2025, mis à jour en octobre 2026)
Creative Commons Attribution (CC BY) : vous pouvez copier, partager, adapter et réutiliser ce contenu, y compris à des fins commerciales, à condition de citer statistics.wiki et d’indiquer les modifications apportées. Les sources citées ci-dessus peuvent avoir leurs propres conditions de licence.