
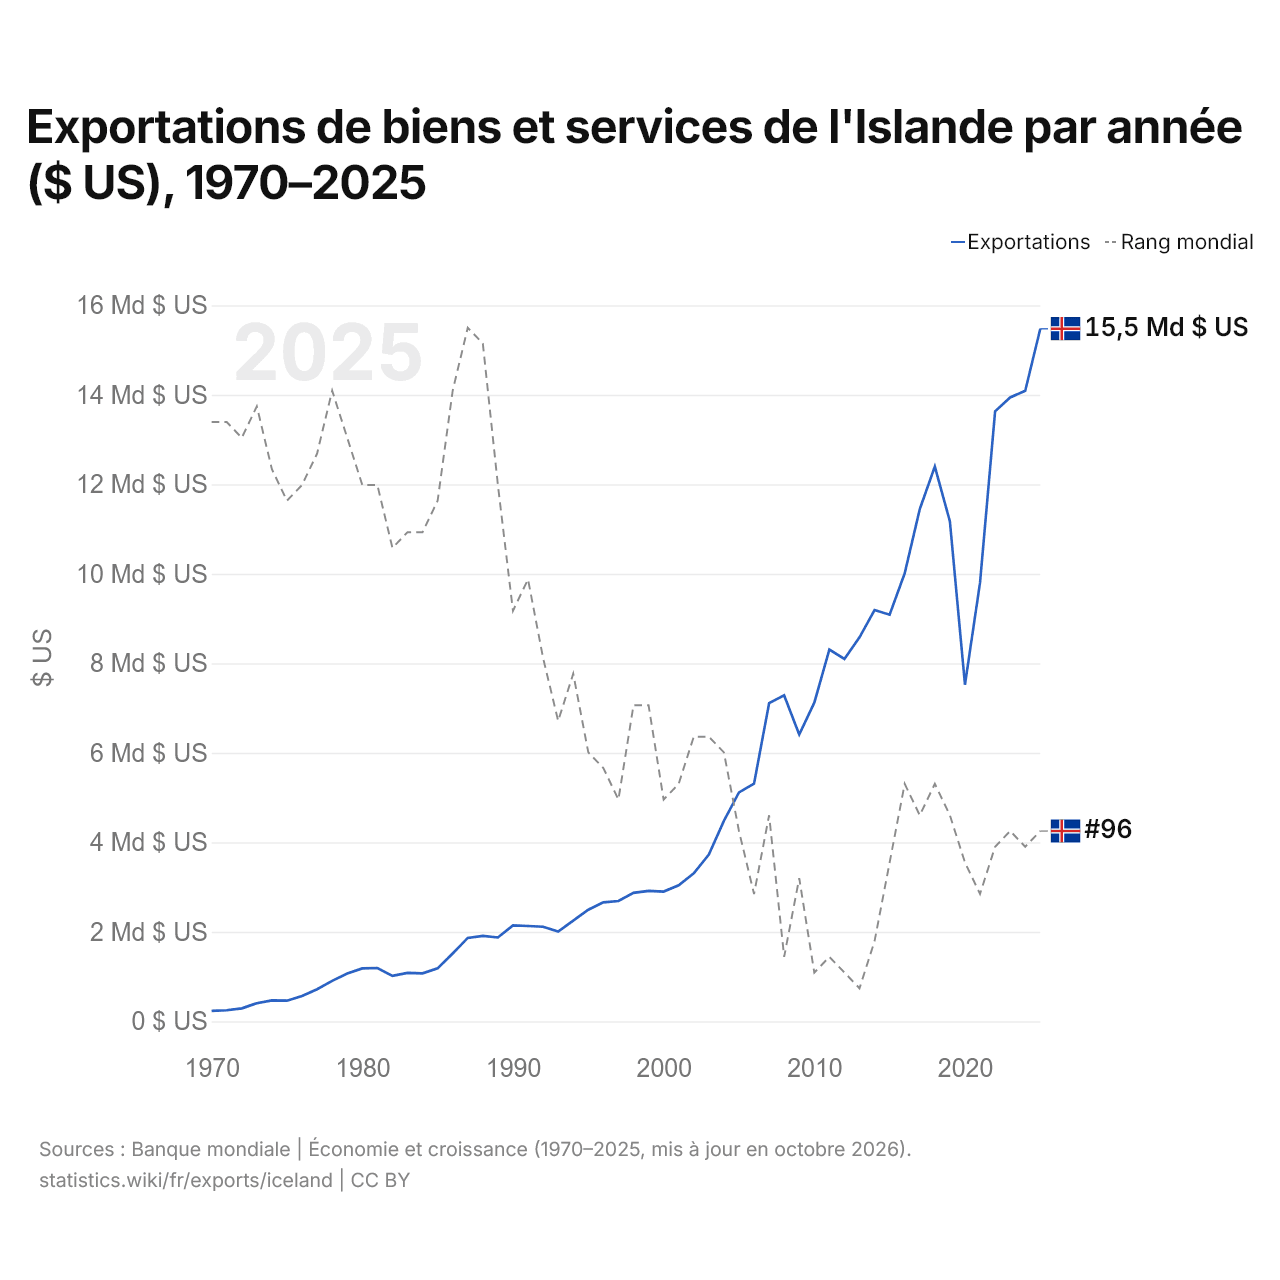
Exportations de biens et services de l'Islande par année ($ US), 1970–2025
| Année | $ US | Rang mondial |
|---|---|---|
| Exportations | Rang mondial | |
| 2025 | 15 476 918 000 $ US | #96 |
| 2024 | 14 090 127 915 $ US | #97 |
| 2023 | 13 940 823 776 $ US | #96 |
| 2022 | 13 632 709 462 $ US | #97 |
| 2021 | 9 802 647 461 $ US | #100 |
| 2020 | 7 522 355 306 $ US | #98 |
| 2019 | 11 172 065 684 $ US | #95 |
| 2018 | 12 397 616 650 $ US | #93 |
| 2017 | 11 445 214 118 $ US | #95 |
| 2016 | 10 012 449 483 $ US | #93 |
| 2015 | 9 086 505 055 $ US | #98 |
| 2014 | 9 191 034 651 $ US | #103 |
| 2013 | 8 580 915 713 $ US | #106 |
| 2012 | 8 097 199 624 $ US | #105 |
| 2011 | 8 306 196 645 $ US | #104 |
| 2010 | 7 121 350 039 $ US | #105 |
| 2009 | 6 408 804 967 $ US | #99 |
| 2008 | 7 284 145 795 $ US | #104 |
| 2007 | 7 110 704 785 $ US | #95 |
| 2006 | 5 310 428 256 $ US | #100 |
| 2005 | 5 116 287 715 $ US | #96 |
| 2004 | 4 480 777 642 $ US | #91 |
| 2003 | 3 728 493 371 $ US | #90 |
| 2002 | 3 309 446 650 $ US | #90 |
| 2001 | 3 042 019 192 $ US | #93 |
| 2000 | 2 899 936 222 $ US | #94 |
| 1999 | 2 915 299 612 $ US | #88 |
| 1998 | 2 871 539 298 $ US | #88 |
| 1997 | 2 689 829 672 $ US | #94 |
| 1996 | 2 658 458 135 $ US | #92 |
| 1995 | 2 493 202 436 $ US | #91 |
| 1994 | 2 251 420 757 $ US | #86 |
| 1993 | 2 007 806 139 $ US | #89 |
| 1992 | 2 113 685 423 $ US | #85 |
| 1991 | 2 130 770 692 $ US | #80 |
| 1990 | 2 144 153 418 $ US | #82 |
| 1989 | 1 873 815 640 $ US | #74 |
| 1988 | 1 910 725 694 $ US | #65 |
| 1987 | 1 864 331 518 $ US | #64 |
| 1986 | 1 516 684 791 $ US | #68 |
| 1985 | 1 183 251 903 $ US | #75 |
| 1984 | 1 072 642 449 $ US | #77 |
| 1983 | 1 081 525 794 $ US | #77 |
| 1982 | 1 016 617 901 $ US | #78 |
| 1981 | 1 191 331 358 $ US | #74 |
| 1980 | 1 182 341 379 $ US | #74 |
| 1979 | 1 066 704 197 $ US | #71 |
| 1978 | 903 769 319 $ US | #68 |
| 1977 | 716 305 627 $ US | #72 |
| 1976 | 568 047 977 $ US | #74 |
| 1975 | 461 359 141 $ US | #75 |
| 1974 | 468 893 447 $ US | #73 |
| 1973 | 404 493 509 $ US | #69 |
| 1972 | 289 636 302 $ US | #71 |
| 1971 | 247 179 545 $ US | #70 |
| 1970 | 233 403 409 $ US | #70 |
En 2025, les exportations de biens et services de l'Islande s'élevaient à 15,5 milliards de dollars, contre 233 millions de dollars en 1970. Elles se classaient au 96e rang mondial, en hausse par rapport au 97e rang en 2024. Leur meilleur rang a été le 64e, occupé pour la dernière fois en 1987.
En 2025, les exportations de biens et services de l'Islande étaient les 35es plus élevées de 41 pays situés en Europe. Les importations de biens et services de l'Islande s'élevaient à 16,3 milliards de dollars en 2025, au 99e rang mondial. En 2025, les importations de l'Islande dépassaient ses exportations de 872 millions de dollars, soit un déficit commercial.
Exportations de biens de l'Islande par catégorie, 2025
Exportations de biens, 2025: 7,20 Md $US
En 2025, la première catégorie des exportations de biens de l'Islande était « animaux, viande, poisson, produits laitiers, cuirs et peaux », avec 40,5 %, suivie de « métaux communs (fer, acier, cuivre, aluminium) », avec 38,1 %.
Destinations des exportations de biens de l'Islande : les 10 premières, 2025
| Rang | Pays | Exportations de biens | Part | |
|---|---|---|---|---|
| 1 |
 Pays-Bas |
2,48 Md $US | 34,4 % | |
| 2 |
 Royaume-Uni |
714 M $US | 9,91 % | |
| 3 |
 États-Unis |
668 M $US | 9,27 % | |
| 4 |
 France |
527 M $US | 7,32 % | vs France |
| 5 |
 Espagne |
375 M $US | 5,21 % | |
| 6 |
 Allemagne |
316 M $US | 4,38 % | |
| 7 |
 Norvège |
262 M $US | 3,64 % | vs Norvège |
| 8 |
 Pologne |
217 M $US | 3,01 % | |
| 9 |
 Chine |
198 M $US | 2,75 % | |
| 10 |
 Lituanie |
192 M $US | 2,67 % | |
| Autres partenaires et non précisés | 1,26 Md $US | 17,4 % |
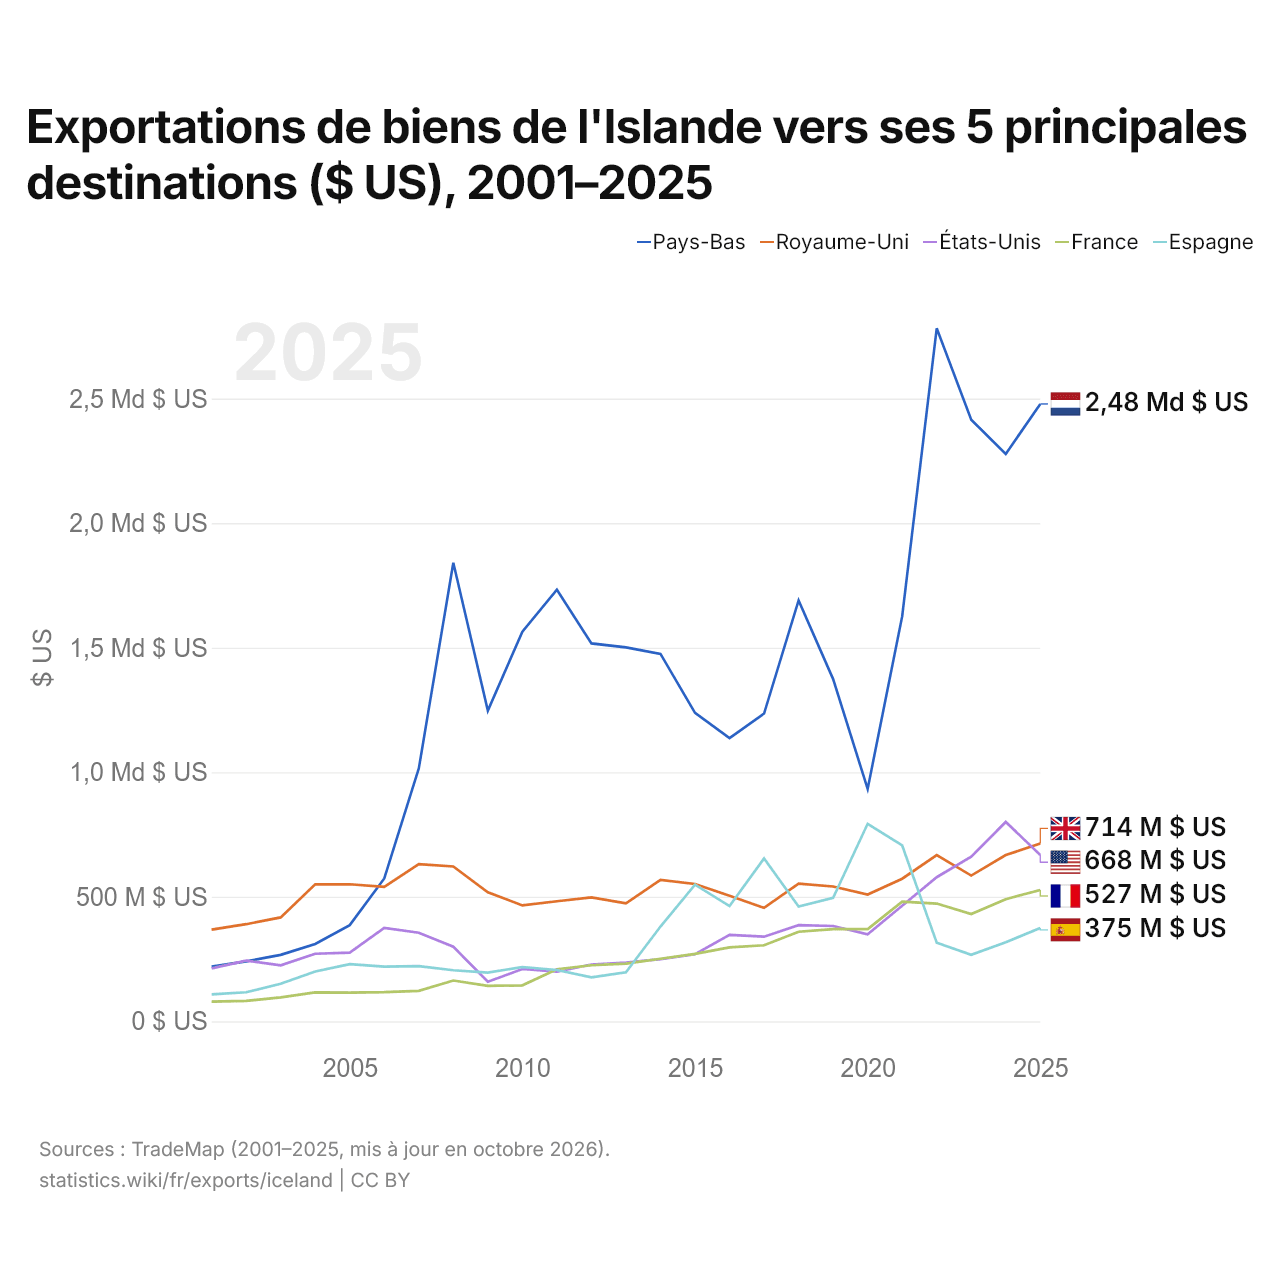
Exportations de biens de l'Islande vers ses 5 principales destinations ($ US), 2001–2025
| Année | $ US | ||||
|---|---|---|---|---|---|
| Pays-Bas | Royaume-Uni | États-Unis | France | Espagne | |
| 2025 | 2 478 351 000 $ US | 713 918 000 $ US | 667 587 000 $ US | 526 923 000 $ US | 374 932 000 $ US |
| 2024 | 2 277 679 000 $ US | 667 373 000 $ US | 800 482 000 $ US | 490 296 000 $ US | 317 316 000 $ US |
| 2023 | 2 414 953 000 $ US | 585 137 000 $ US | 661 096 000 $ US | 430 441 000 $ US | 267 304 000 $ US |
| 2022 | 2 781 903 000 $ US | 667 202 000 $ US | 578 481 000 $ US | 472 827 000 $ US | 315 738 000 $ US |
| 2021 | 1 626 214 000 $ US | 572 535 000 $ US | 464 115 000 $ US | 480 231 000 $ US | 706 128 000 $ US |
| 2020 | 932 909 000 $ US | 508 935 000 $ US | 348 928 000 $ US | 370 133 000 $ US | 793 019 000 $ US |
| 2019 | 1 373 906 000 $ US | 541 229 000 $ US | 382 777 000 $ US | 370 140 000 $ US | 495 467 000 $ US |
| 2018 | 1 689 785 000 $ US | 552 523 000 $ US | 385 887 000 $ US | 359 578 000 $ US | 461 164 000 $ US |
| 2017 | 1 235 608 000 $ US | 455 661 000 $ US | 339 955 000 $ US | 305 457 000 $ US | 654 013 000 $ US |
| 2016 | 1 137 132 000 $ US | 503 894 000 $ US | 347 009 000 $ US | 297 057 000 $ US | 462 867 000 $ US |
| 2015 | 1 238 333 000 $ US | 551 386 000 $ US | 269 167 000 $ US | 271 046 000 $ US | 548 656 000 $ US |
| 2014 | 1 475 088 000 $ US | 567 379 000 $ US | 249 529 000 $ US | 251 210 000 $ US | 380 522 000 $ US |
| 2013 | 1 500 910 000 $ US | 473 791 000 $ US | 235 416 000 $ US | 231 938 000 $ US | 196 875 000 $ US |
| 2012 | 1 516 998 000 $ US | 497 288 000 $ US | 228 305 000 $ US | 225 038 000 $ US | 176 581 000 $ US |
| 2011 | 1 732 724 000 $ US | 481 974 000 $ US | 199 429 000 $ US | 209 196 000 $ US | 206 132 000 $ US |
| 2010 | 1 564 072 000 $ US | 465 306 000 $ US | 210 141 000 $ US | 144 553 000 $ US | 218 149 000 $ US |
| 2009 | 1 247 264 000 $ US | 518 165 000 $ US | 158 753 000 $ US | 142 409 000 $ US | 195 459 000 $ US |
| 2008 | 1 840 866 000 $ US | 621 612 000 $ US | 299 422 000 $ US | 163 900 000 $ US | 204 886 000 $ US |
| 2007 | 1 014 887 000 $ US | 630 866 000 $ US | 355 667 000 $ US | 122 505 000 $ US | 221 460 000 $ US |
| 2006 | 573 548 000 $ US | 539 712 000 $ US | 374 848 000 $ US | 117 053 000 $ US | 219 819 000 $ US |
| 2005 | 386 353 000 $ US | 550 419 000 $ US | 275 542 000 $ US | 115 126 000 $ US | 229 654 000 $ US |
| 2004 | 310 642 000 $ US | 550 082 000 $ US | 271 179 000 $ US | 116 493 000 $ US | 200 281 000 $ US |
| 2003 | 266 756 000 $ US | 417 087 000 $ US | 225 029 000 $ US | 96 303 000 $ US | 150 544 000 $ US |
| 2002 | 240 706 000 $ US | 389 975 000 $ US | 243 533 000 $ US | 81 872 000 $ US | 116 690 000 $ US |
| 2001 | 220 226 000 $ US | 368 095 000 $ US | 212 766 000 $ US | 78 977 000 $ US | 108 240 000 $ US |
En 2025, les exportations de biens s'élevaient à 2,48 milliards de dollars vers les Pays-Bas, 714 millions de dollars vers le Royaume-Uni, 668 millions de dollars vers les États-Unis, 527 millions de dollars vers la France et 375 millions de dollars vers l'Espagne. Le premier rang des cinq destinations de l'Islande est occupé par les Pays-Bas depuis 2006. Le changement le plus récent dans leur ordre remonte à 2025, quand les exportations de l'Islande vers le Royaume-Uni ont dépassé celles vers les États-Unis.
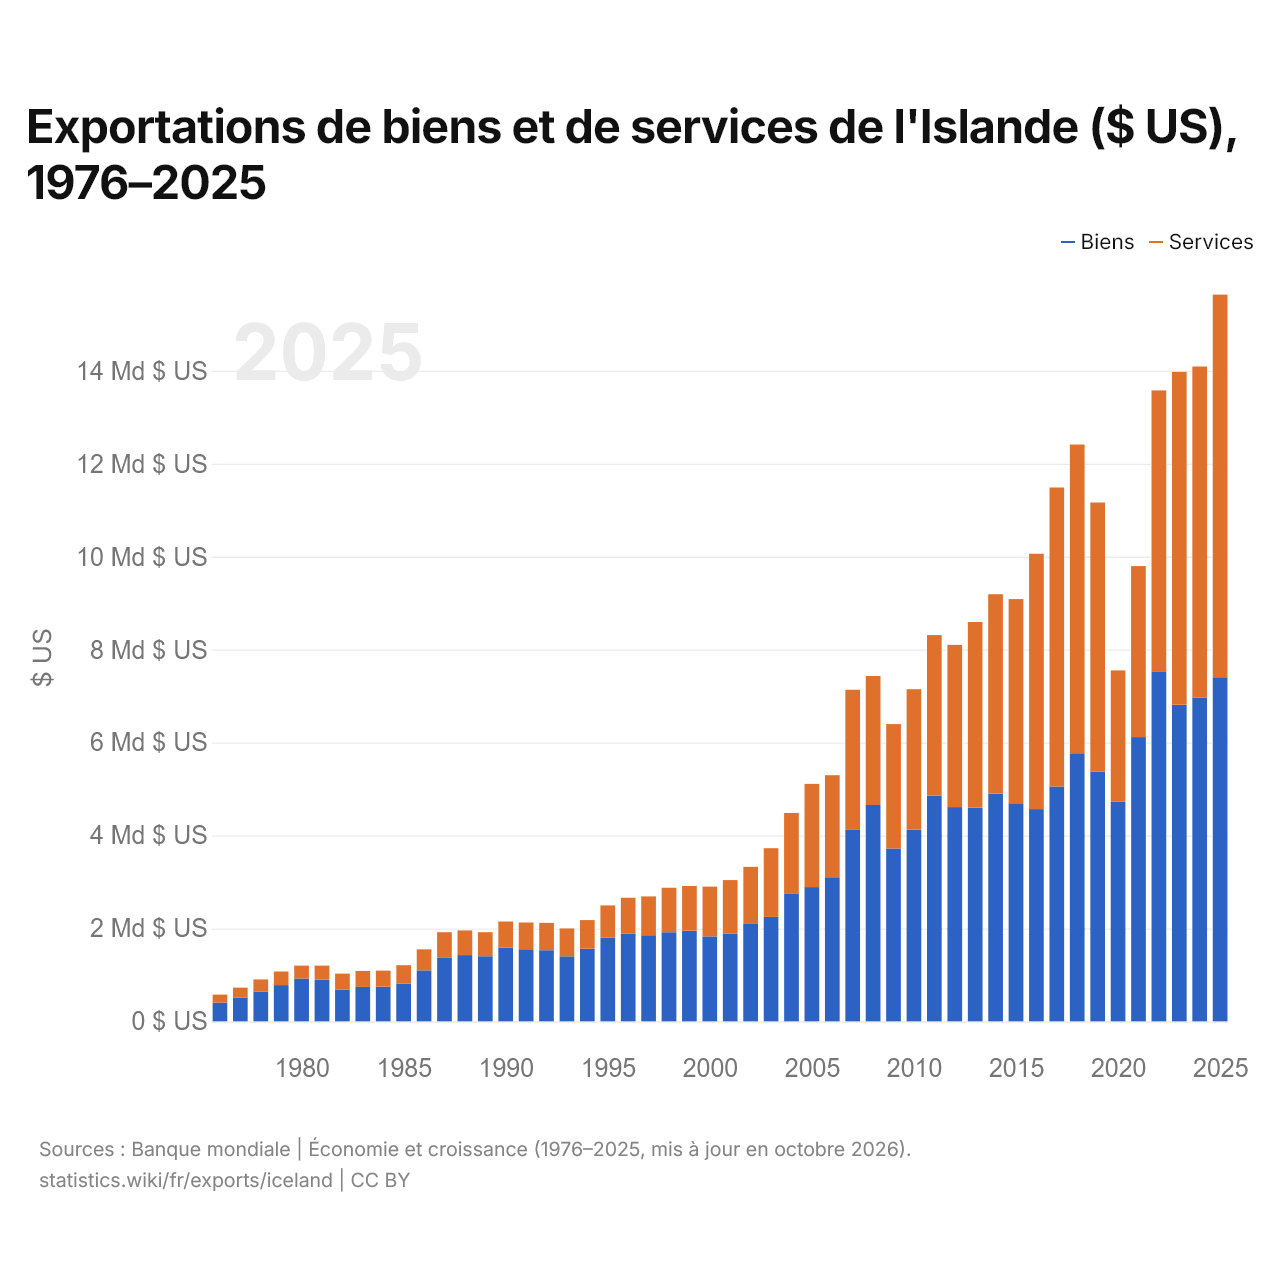
Exportations de biens et de services de l'Islande ($ US), 1976–2025
| Année | $ US | |
|---|---|---|
| Biens | Services | |
| 2025 | 7 403 471 213 $ US | 8 232 503 696 $ US |
| 2024 | 6 966 198 643 $ US | 7 123 276 845 $ US |
| 2023 | 6 812 440 408 $ US | 7 163 830 780 $ US |
| 2022 | 7 531 445 202 $ US | 6 045 107 638 $ US |
| 2021 | 6 116 334 341 $ US | 3 678 787 079 $ US |
| 2020 | 4 727 026 656 $ US | 2 823 713 523 $ US |
| 2019 | 5 374 491 484 $ US | 5 789 908 506 $ US |
| 2018 | 5 769 081 849 $ US | 6 642 158 808 $ US |
| 2017 | 5 054 159 950 $ US | 6 431 965 235 $ US |
| 2016 | 4 566 443 305 $ US | 5 495 302 195 $ US |
| 2015 | 4 692 820 137 $ US | 4 393 182 783 $ US |
| 2014 | 4 895 694 603 $ US | 4 293 530 299 $ US |
| 2013 | 4 595 544 708 $ US | 3 998 911 220 $ US |
| 2012 | 4 608 969 569 $ US | 3 492 424 894 $ US |
| 2011 | 4 852 948 532 $ US | 3 456 579 676 $ US |
| 2010 | 4 123 232 726 $ US | 3 021 800 495 $ US |
| 2009 | 3 718 839 976 $ US | 2 677 961 163 $ US |
| 2008 | 4 654 249 887 $ US | 2 777 319 610 $ US |
| 2007 | 4 118 761 333 $ US | 3 015 555 051 $ US |
| 2006 | 3 099 263 874 $ US | 2 197 393 641 $ US |
| 2005 | 2 889 198 763 $ US | 2 221 513 928 $ US |
| 2004 | 2 741 066 106 $ US | 1 742 965 557 $ US |
| 2003 | 2 246 154 626 $ US | 1 480 003 666 $ US |
| 2002 | 2 109 265 078 $ US | 1 214 721 350 $ US |
| 2001 | 1 890 585 937 $ US | 1 147 148 048 $ US |
| 2000 | 1 828 277 795 $ US | 1 070 883 261 $ US |
| 1999 | 1 950 022 115 $ US | 963 803 400 $ US |
| 1998 | 1 917 572 130 $ US | 957 012 447 $ US |
| 1997 | 1 851 783 899 $ US | 836 711 890 $ US |
| 1996 | 1 889 498 251 $ US | 768 866 794 $ US |
| 1995 | 1 803 609 058 $ US | 690 958 843 $ US |
| 1994 | 1 560 040 901 $ US | 619 167 242 $ US |
| 1993 | 1 398 537 999 $ US | 600 995 676 $ US |
| 1992 | 1 528 960 412 $ US | 589 998 785 $ US |
| 1991 | 1 551 428 276 $ US | 573 971 073 $ US |
| 1990 | 1 588 537 736 $ US | 559 991 754 $ US |
| 1989 | 1 401 500 000 $ US | 516 900 000 $ US |
| 1988 | 1 425 400 000 $ US | 531 600 000 $ US |
| 1987 | 1 376 100 000 $ US | 541 900 000 $ US |
| 1986 | 1 096 800 000 $ US | 453 200 000 $ US |
| 1985 | 814 000 000 $ US | 394 300 000 $ US |
| 1984 | 743 200 000 $ US | 347 100 000 $ US |
| 1983 | 742 000 000 $ US | 342 500 000 $ US |
| 1982 | 685 500 000 $ US | 340 600 000 $ US |
| 1981 | 896 400 000 $ US | 302 800 000 $ US |
| 1980 | 919 800 000 $ US | 279 800 000 $ US |
| 1979 | 779 600 000 $ US | 292 800 000 $ US |
| 1978 | 640 300 000 $ US | 262 000 000 $ US |
| 1977 | 512 600 000 $ US | 212 100 000 $ US |
| 1976 | 402 000 000 $ US | 172 500 000 $ US |
En 2025, les exportations de biens de l'Islande s'élevaient à 7,4 milliards de dollars et celles de services à 8,23 milliards de dollars ; les services représentaient 52,7 % du total, contre 30,0 % en 1976.
L'Islande dans le classement mondial des exportations, 2025







Exportations de biens et services de l'Islande, % du PIB, 1970–2025
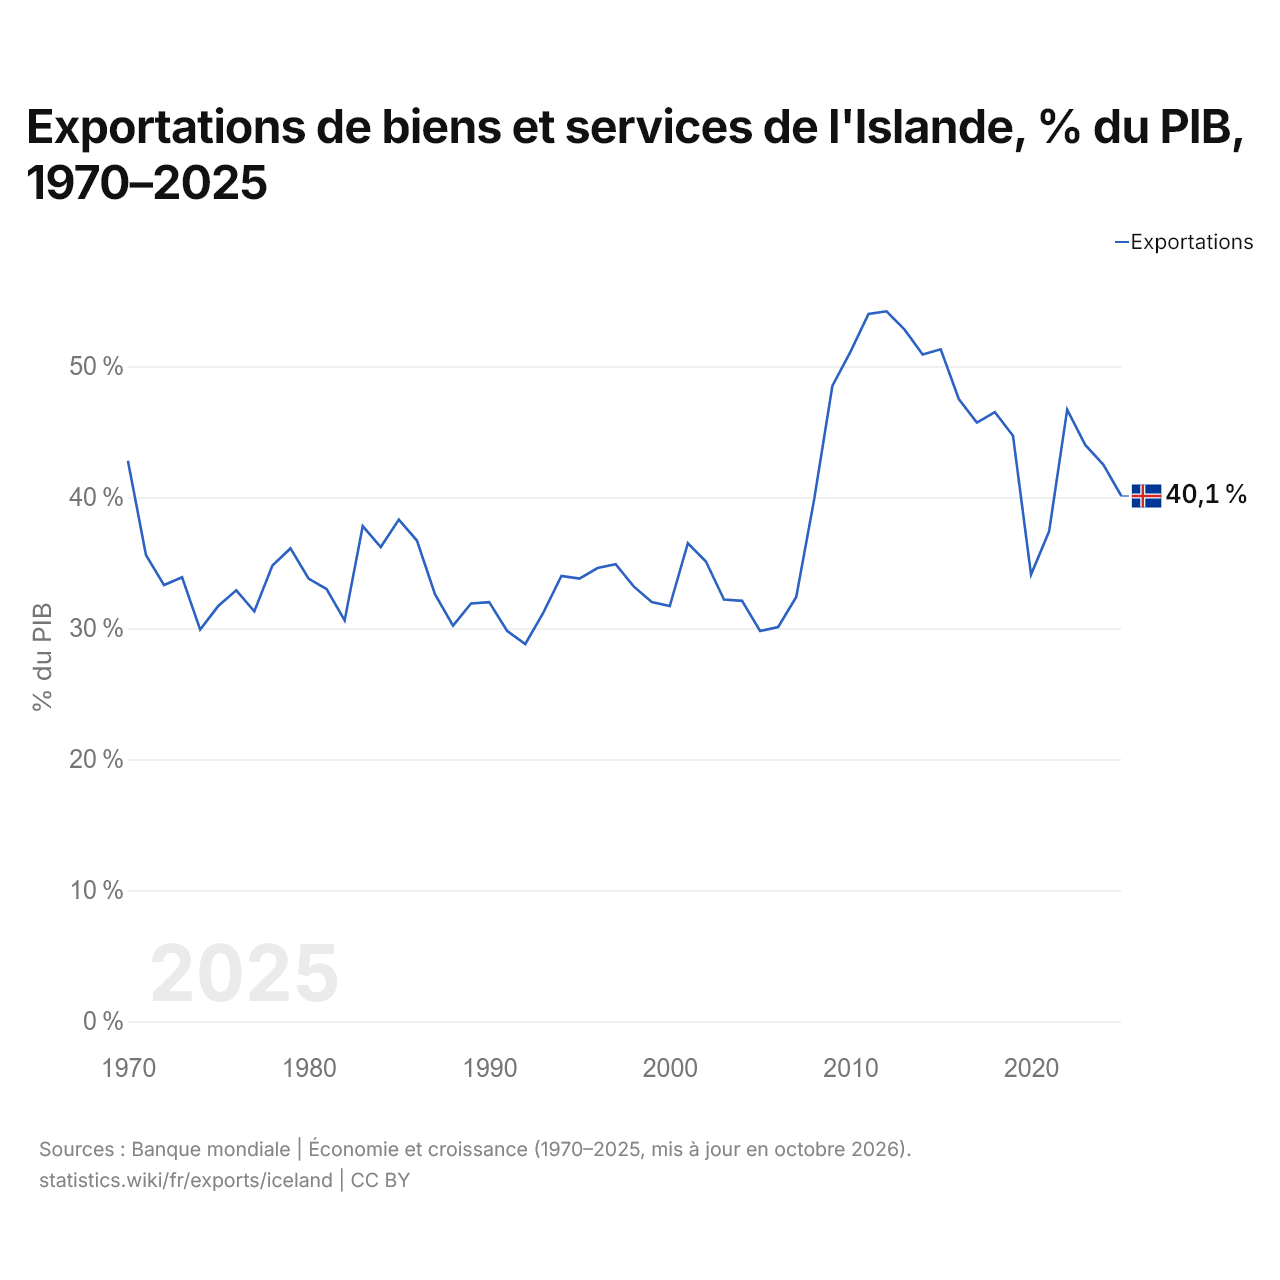
En 2025, les exportations de biens et services de l'Islande équivalaient à 40,1 % de son PIB, contre 42,8 % en 1970. La part la plus élevée a été de 54,2 %, en 2012.
Comparer les exportations de l'Islande avec celles d'autres pays
Sources :
- Banque mondiale | Économie et croissance (1970–2025, mis à jour en octobre 2026)
- TradeMap (2001–2025, mis à jour en octobre 2026)
Creative Commons Attribution (CC BY) : vous pouvez copier, partager, adapter et réutiliser ce contenu, y compris à des fins commerciales, à condition de citer statistics.wiki et d’indiquer les modifications apportées. Les sources citées ci-dessus peuvent avoir leurs propres conditions de licence.