
Exportations de biens et services de l'Éthiopie par année ($ US), 2011–2025
| Année | $ US | Rang mondial |
|---|---|---|
| Exportations | Rang mondial | |
| 2025 | 16 785 187 368 $ US | #95 |
| 2024 | 8 294 520 633 $ US | #117 |
| 2023 | 8 962 144 166 $ US | #112 |
| 2022 | 10 151 637 926 $ US | #106 |
| 2021 | 8 323 978 508 $ US | #107 |
| 2020 | 7 032 893 577 $ US | #102 |
| 2019 | 7 291 628 540 $ US | #112 |
| 2018 | 6 977 614 239 $ US | #115 |
| 2017 | 5 826 254 533 $ US | #114 |
| 2016 | 5 349 377 913 $ US | #113 |
| 2015 | 5 814 937 799 $ US | #110 |
| 2014 | 6 474 164 234 $ US | #112 |
| 2013 | 5 948 445 901 $ US | #113 |
| 2012 | 5 962 716 169 $ US | #113 |
| 2011 | 5 331 910 670 $ US | #117 |
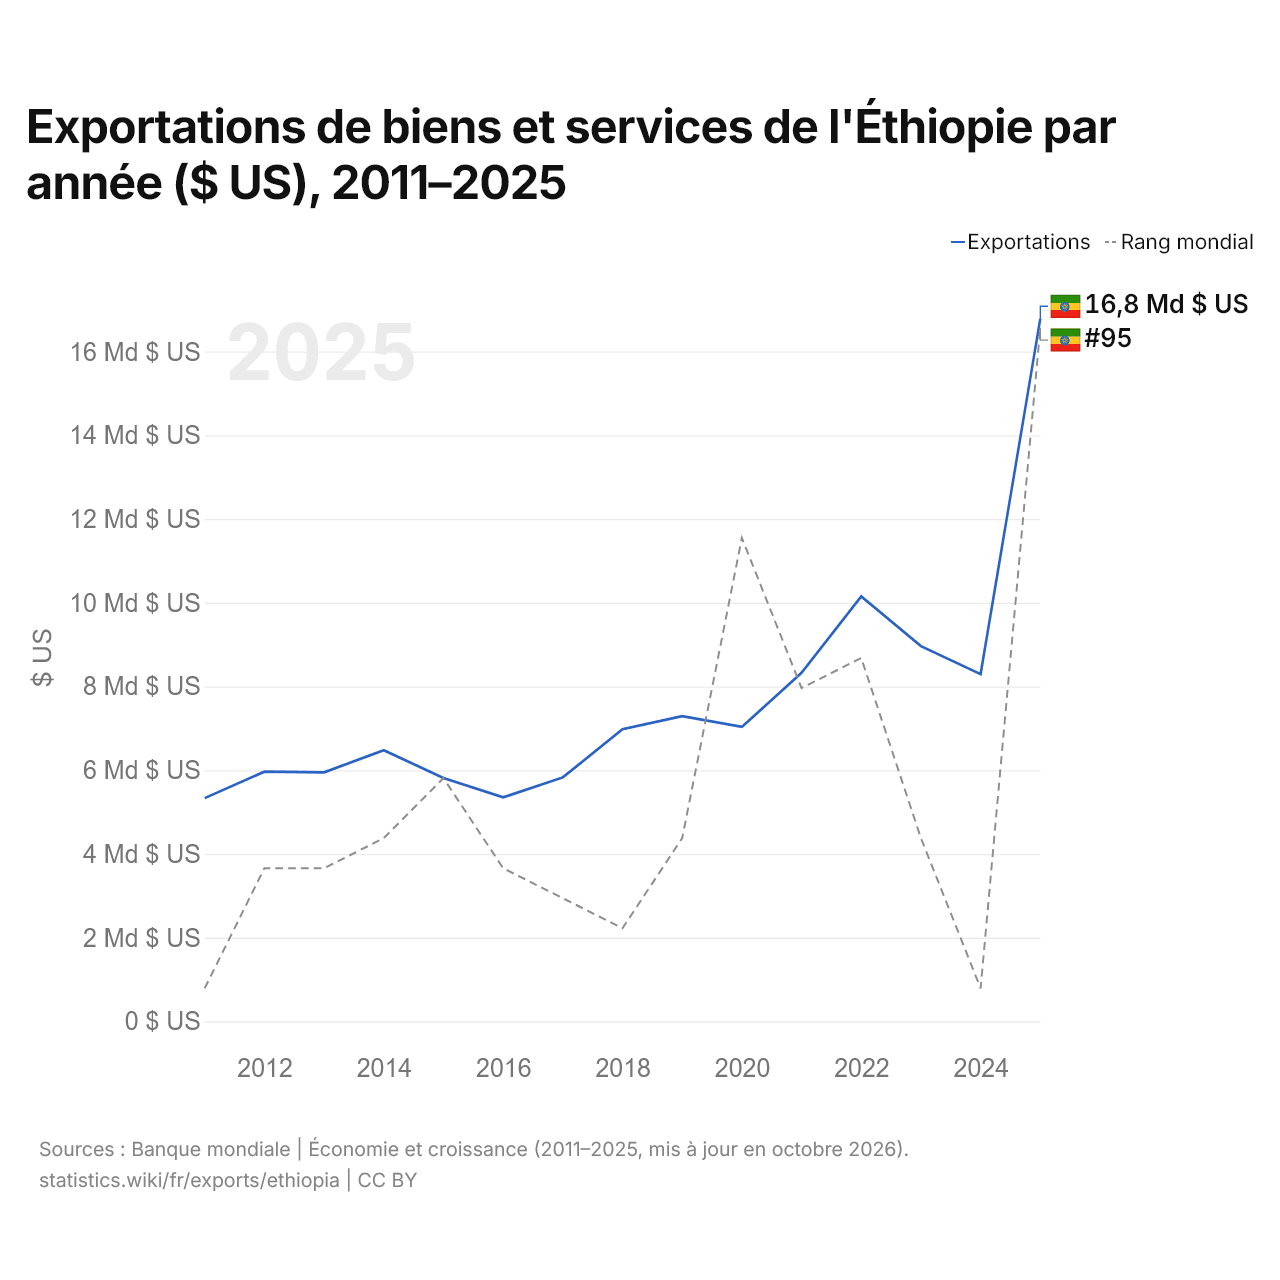
En 2025, les exportations de biens et services de l'Éthiopie s'élevaient à 16,8 milliards de dollars, contre 5,33 milliards de dollars en 2011. Elles se classaient au 95e rang mondial, en hausse par rapport au 117e rang en 2024.
En 2025, les exportations de biens et services de l'Éthiopie étaient les 13es plus élevées de 50 pays situés en Afrique. Les importations de biens et services de l'Éthiopie s'élevaient à 25,5 milliards de dollars en 2025, au 87e rang mondial. En 2025, les importations de l'Éthiopie dépassaient ses exportations de 8,71 milliards de dollars, soit un déficit commercial.
Exportations de biens de l'Éthiopie par catégorie
Exportations de biens, 2023: 2,86 Md $US
La première catégorie des exportations de biens de l'Éthiopie est « cultures, plantes et fleurs (céréales, fruits, légumes, café, oléagineux) », avec 85,5 %, suivie de « textiles, vêtements, chaussures, meubles et jouets », avec 5,2 %.
Destinations des exportations de biens de l'Éthiopie : les 10 premières
| Rang | Pays | Exportations de biens | Part | |
|---|---|---|---|---|
| 1 |
 Arabie saoudite |
298 M $US | 10,4 % | vs Arabie saoudite |
| 2 |
 États-Unis |
276 M $US | 9,67 % | |
| 3 |
 Pays-Bas |
219 M $US | 7,65 % | |
| 4 |
 EAU |
164 M $US | 5,73 % | |
| 5 |
 Somalie |
142 M $US | 4,97 % | vs Somalie |
| 6 |
 Inde |
139 M $US | 4,87 % | vs Inde |
| 7 |
 Allemagne |
135 M $US | 4,74 % | |
| 8 |
 Chine |
132 M $US | 4,6 % | |
| 9 |
 Corée du Sud |
116 M $US | 4,06 % | |
| 10 |
 Japon |
104 M $US | 3,64 % | |
| Autres partenaires et non précisés | 1,13 Md $US | 39,6 % |
Exportations de biens de l'Éthiopie vers ses 5 principales destinations ($ US)
| Année | $ US | ||||
|---|---|---|---|---|---|
| Arabie saoudite | États-Unis | Pays-Bas | Émirats arabes unis | Somalie | |
| 2023 | 297 762 000 $ US | 276 310 000 $ US | 218 596 000 $ US | 163 815 000 $ US | 142 082 000 $ US |
| 2022 | 267 939 000 $ US | 334 495 000 $ US | 216 917 000 $ US | 205 681 000 $ US | 264 805 000 $ US |
| 2021 | 215 538 000 $ US | 330 215 000 $ US | 229 347 000 $ US | 189 768 000 $ US | 360 838 000 $ US |
| 2020 | 186 925 000 $ US | 258 691 000 $ US | 189 746 000 $ US | 168 916 000 $ US | 293 673 000 $ US |
| 2019 | 177 062 000 $ US | 293 384 000 $ US | 190 726 000 $ US | 154 811 000 $ US | 271 908 000 $ US |
| 2018 | 180 790 000 $ US | 272 751 000 $ US | 190 687 000 $ US | 124 942 000 $ US | 260 319 000 $ US |
| 2017 | 206 154 000 $ US | 227 292 000 $ US | 188 862 000 $ US | 127 638 000 $ US | 243 590 000 $ US |
| 2016 | 184 655 000 $ US | 180 021 000 $ US | 181 403 000 $ US | 91 159 000 $ US | 271 215 000 $ US |
| 2015 | 197 213 000 $ US | 190 424 000 $ US | 190 025 000 $ US | 87 357 000 $ US | 303 581 000 $ US |
| 2014 | 194 685 000 $ US | 148 521 000 $ US | 175 435 000 $ US | 83 941 000 $ US | 330 363 000 $ US |
| 2013 | 165 419 000 $ US | 121 264 000 $ US | 168 874 000 $ US | 75 599 000 $ US | 319 844 000 $ US |
| 2012 | 188 646 000 $ US | 107 957 000 $ US | 169 056 000 $ US | 77 513 000 $ US | 256 093 000 $ US |
| 2011 | 165 253 000 $ US | 94 766 000 $ US | 178 455 000 $ US | 75 521 000 $ US | 239 257 000 $ US |
| 2010 | 141 289 000 $ US | 96 872 000 $ US | 149 384 000 $ US | 78 037 000 $ US | 216 830 000 $ US |
| 2009 | 109 160 000 $ US | 68 801 000 $ US | 136 301 000 $ US | 68 169 000 $ US | 131 742 000 $ US |
| 2008 | 120 732 000 $ US | 111 976 000 $ US | 116 935 000 $ US | 66 516 000 $ US | 76 954 000 $ US |
| 2007 | 85 598 000 $ US | 67 828 000 $ US | 78 172 000 $ US | 32 599 000 $ US | 72 236 000 $ US |
| 2006 | 418 000 $ US | 601 000 $ US | 77 000 $ US | 438 000 $ US | 20 000 $ US |
| 2005 | 31 724 000 $ US | 24 684 000 $ US | 19 328 000 $ US | 17 252 000 $ US | 19 641 000 $ US |
| 2004 | 39 215 000 $ US | 35 623 000 $ US | 17 730 000 $ US | 11 949 000 $ US | 17 992 000 $ US |
| 2003 | 35 382 000 $ US | 22 704 000 $ US | 5 658 000 $ US | 10 758 000 $ US | 28 820 000 $ US |
| 2002 | 27 844 000 $ US | 16 545 000 $ US | 4 714 000 $ US | 8 585 000 $ US | 8 485 000 $ US |
| 2001 | 36 316 000 $ US | 19 088 000 $ US | 4 308 000 $ US | 6 023 000 $ US | 14 010 000 $ US |
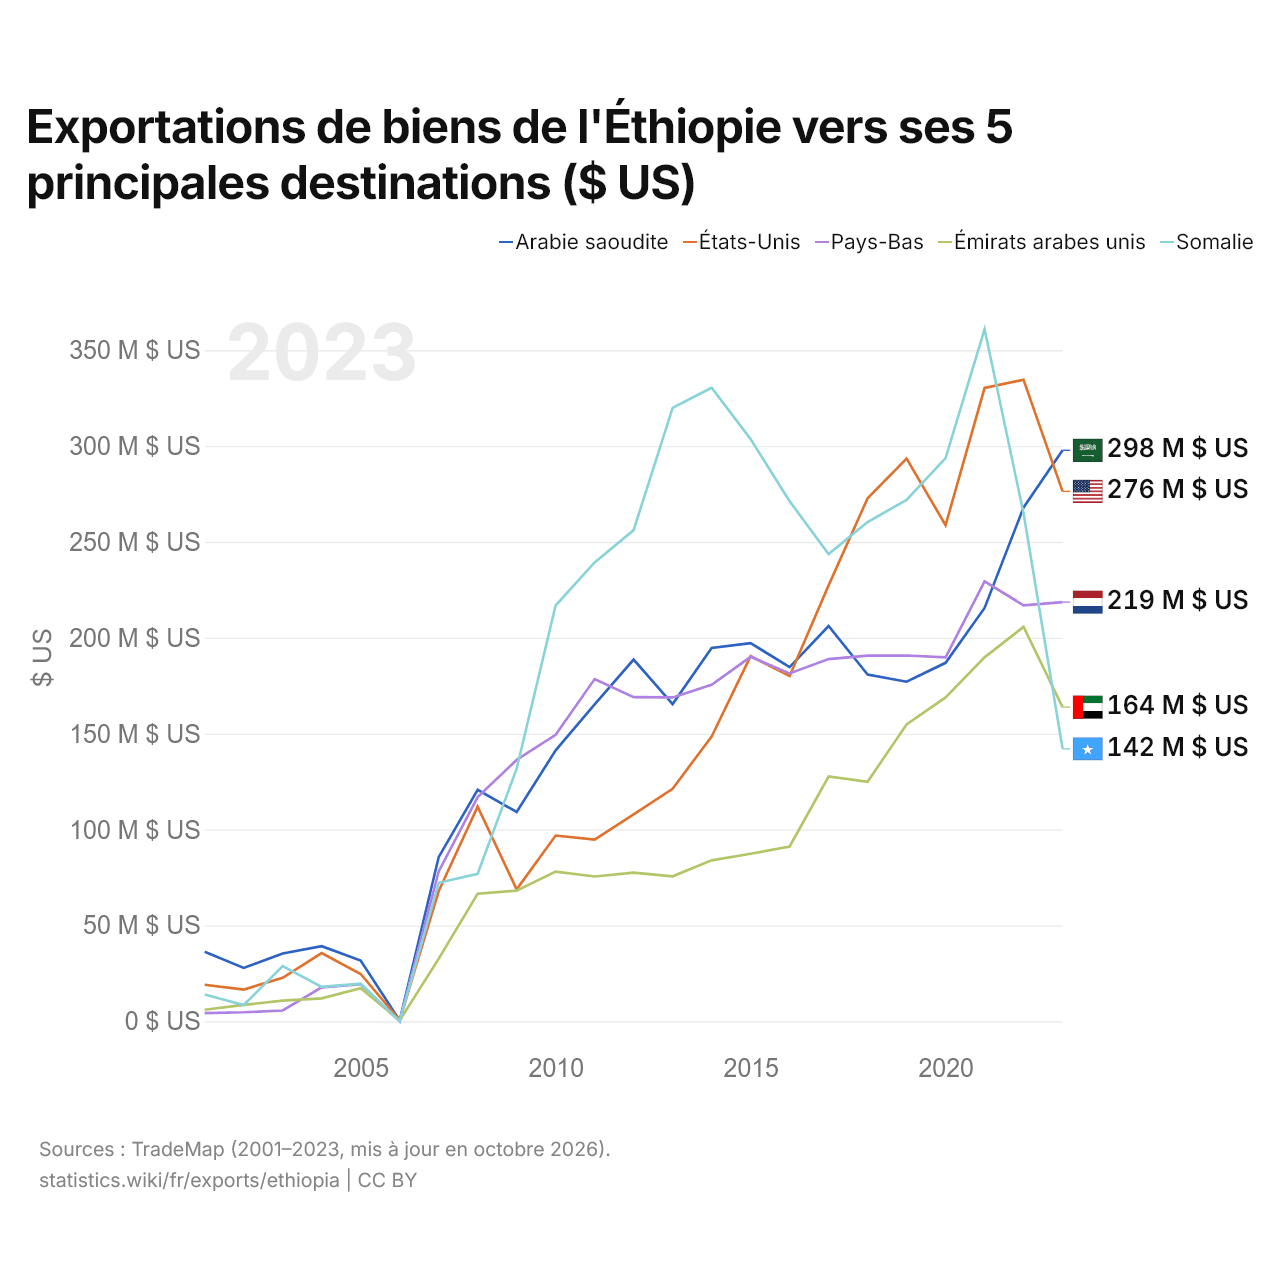
Les exportations de biens s'élèvent à 298 millions de dollars vers l'Arabie saoudite (2023), 276 millions de dollars vers les États-Unis (2023), 219 millions de dollars vers les Pays-Bas (2023), 164 millions de dollars vers les Émirats arabes unis (2023) et 142 millions de dollars vers la Somalie (2023). Le changement le plus récent dans leur ordre remonte à 2023, quand les exportations de l'Éthiopie vers l'Arabie saoudite ont dépassé celles vers les États-Unis.
Exportations de biens et de services de l'Éthiopie ($ US)
| Année | $ US | |
|---|---|---|
| Biens | Services | |
| 2024 | 5 581 453 417 $ US | 7 608 411 739 $ US |
| 2023 | 3 469 616 199 $ US | 7 395 866 095 $ US |
| 2022 | 3 969 724 083 $ US | 7 000 872 482 $ US |
| 2021 | 3 929 967 919 $ US | 5 565 857 943 $ US |
| 2020 | 3 252 826 739 $ US | 4 461 774 238 $ US |
| 2019 | 2 745 929 327 $ US | 4 842 257 161 $ US |
| 2018 | 2 705 000 196 $ US | 4 919 331 157 $ US |
| 2017 | 3 030 123 288 $ US | 3 607 741 789 $ US |
| 2016 | 2 810 825 746 $ US | 3 094 746 062 $ US |
| 2015 | 2 920 026 146 $ US | 3 087 170 087 $ US |
| 2014 | 3 418 298 315 $ US | 2 967 393 372 $ US |
| 2013 | 3 014 456 726 $ US | 3 102 019 297 $ US |
| 2012 | 3 257 974 059 $ US | 2 736 954 646 $ US |
| 2011 | 3 029 375 494 $ US | 2 802 162 978 $ US |
| 2010 | 2 479 500 108 $ US | 2 164 718 234 $ US |
| 2009 | 1 694 678 621 $ US | 1 735 246 083 $ US |
| 2008 | 1 718 581 217 $ US | 1 776 704 854 $ US |
| 2007 | 1 350 794 630 $ US | 1 298 848 906 $ US |
| 2006 | 1 055 546 060 $ US | 1 142 944 754 $ US |
| 2005 | 917 349 757 $ US | 1 012 133 942 $ US |
| 2004 | 678 301 895 $ US | 1 005 460 767 $ US |
| 2003 | 496 388 183 $ US | 761 738 028 $ US |
| 2002 | 550 935 675 $ US | 513 034 270 $ US |
| 2001 | 508 324 153 $ US | 467 364 938 $ US |
| 2000 | 486 065 462 $ US | 506 201 908 $ US |
| 1999 | 467 354 434 $ US | 473 621 264 $ US |
| 1998 | 560 345 146 $ US | 391 545 133 $ US |
| 1997 | 588 275 137 $ US | 390 725 027 $ US |
| 1996 | 417 479 307 $ US | 377 174 484 $ US |
| 1995 | 423 017 569 $ US | 344 540 720 $ US |
| 1994 | 371 965 735 $ US | 294 606 672 $ US |
| 1993 | 198 840 000 $ US | 277 240 000 $ US |
| 1992 | 169 883 575 $ US | 267 601 739 $ US |
| 1991 | 167 632 850 $ US | 268 260 870 $ US |
| 1990 | 291 980 676 $ US | 304 637 681 $ US |
| 1989 | 443 816 425 $ US | 289 178 744 $ US |
| 1988 | 400 000 000 $ US | 271 739 130 $ US |
| 1987 | 355 217 391 $ US | 296 859 903 $ US |
| 1986 | 477 149 758 $ US | 243 913 043 $ US |
| 1985 | 332 850 242 $ US | 288 840 580 $ US |
| 1984 | 416 811 594 $ US | 186 473 430 $ US |
| 1983 | 402 608 696 $ US | 138 937 198 $ US |
| 1982 | 402 801 933 $ US | 135 120 773 $ US |
| 1981 | 374 106 280 $ US | 132 367 150 $ US |
| 1980 | 419 323 672 $ US | 125 410 628 $ US |
| 1979 | 430 338 164 $ US | 86 328 502 $ US |
| 1978 | 306 183 575 $ US | 79 468 599 $ US |
| 1977 | 333 285 024 $ US | 83 913 044 $ US |
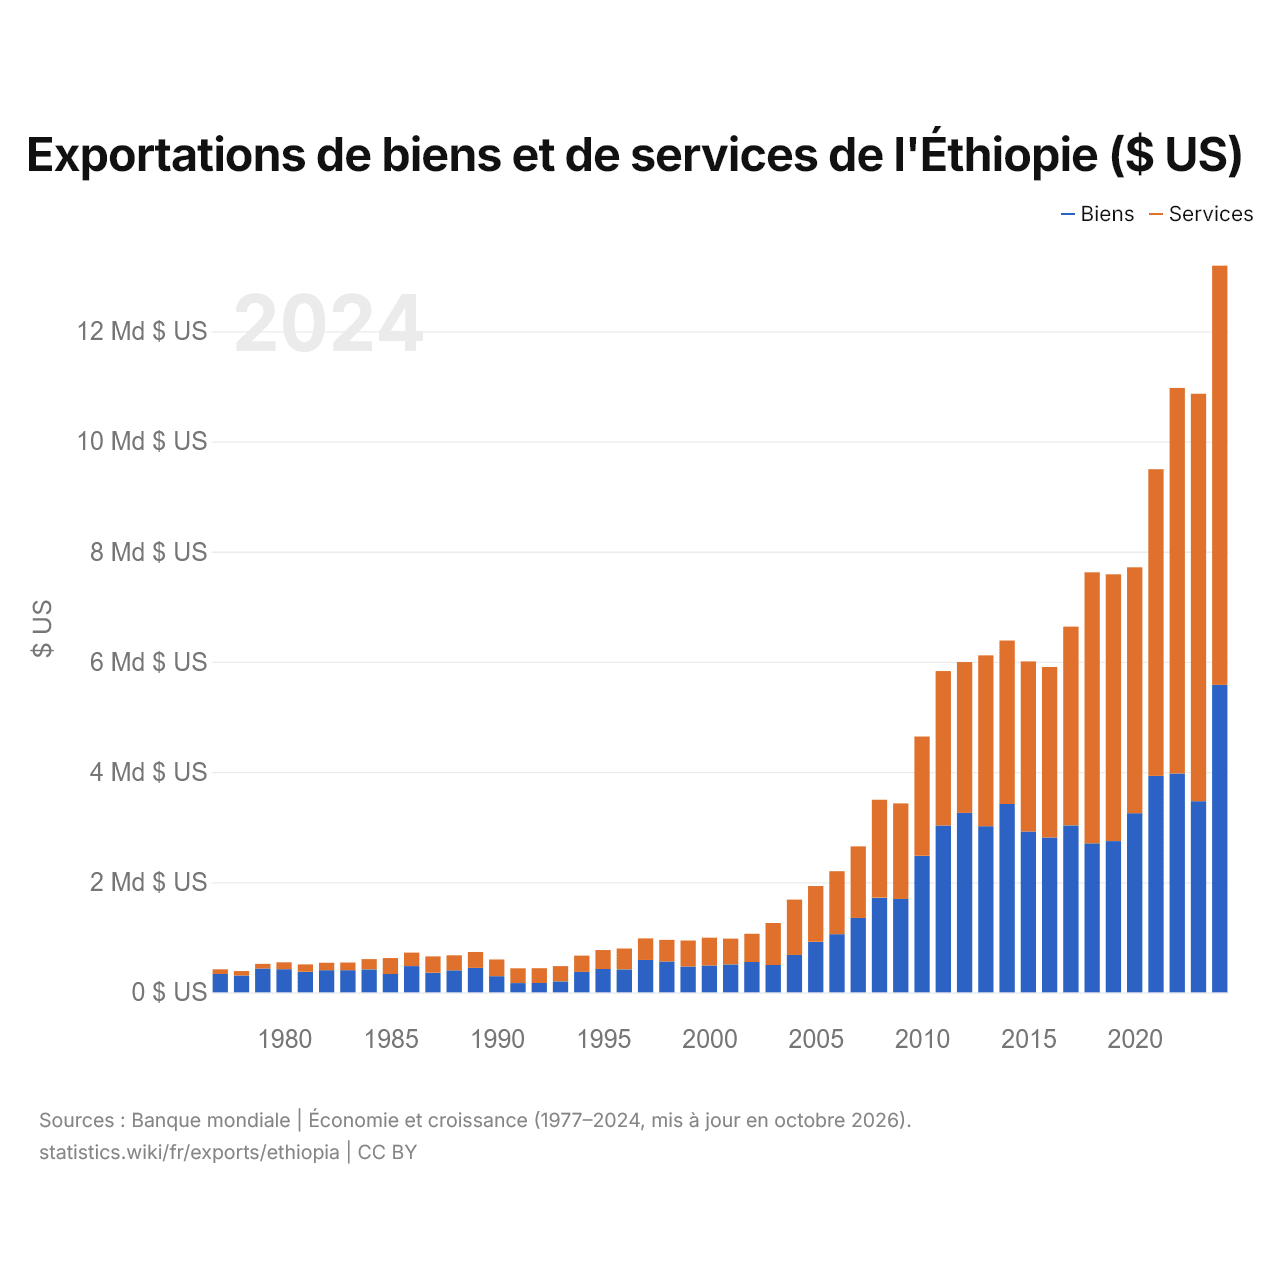
Les exportations de biens de l'Éthiopie s'élèvent à 5,58 milliards de dollars (2024) et celles de services à 7,61 milliards de dollars ; les services représentent 57,7 % du total, contre 20,1 % en 1977.
L'Éthiopie dans le classement mondial des exportations, 2025







Exportations de biens et services de l'Éthiopie, % du PIB, 2011–2025
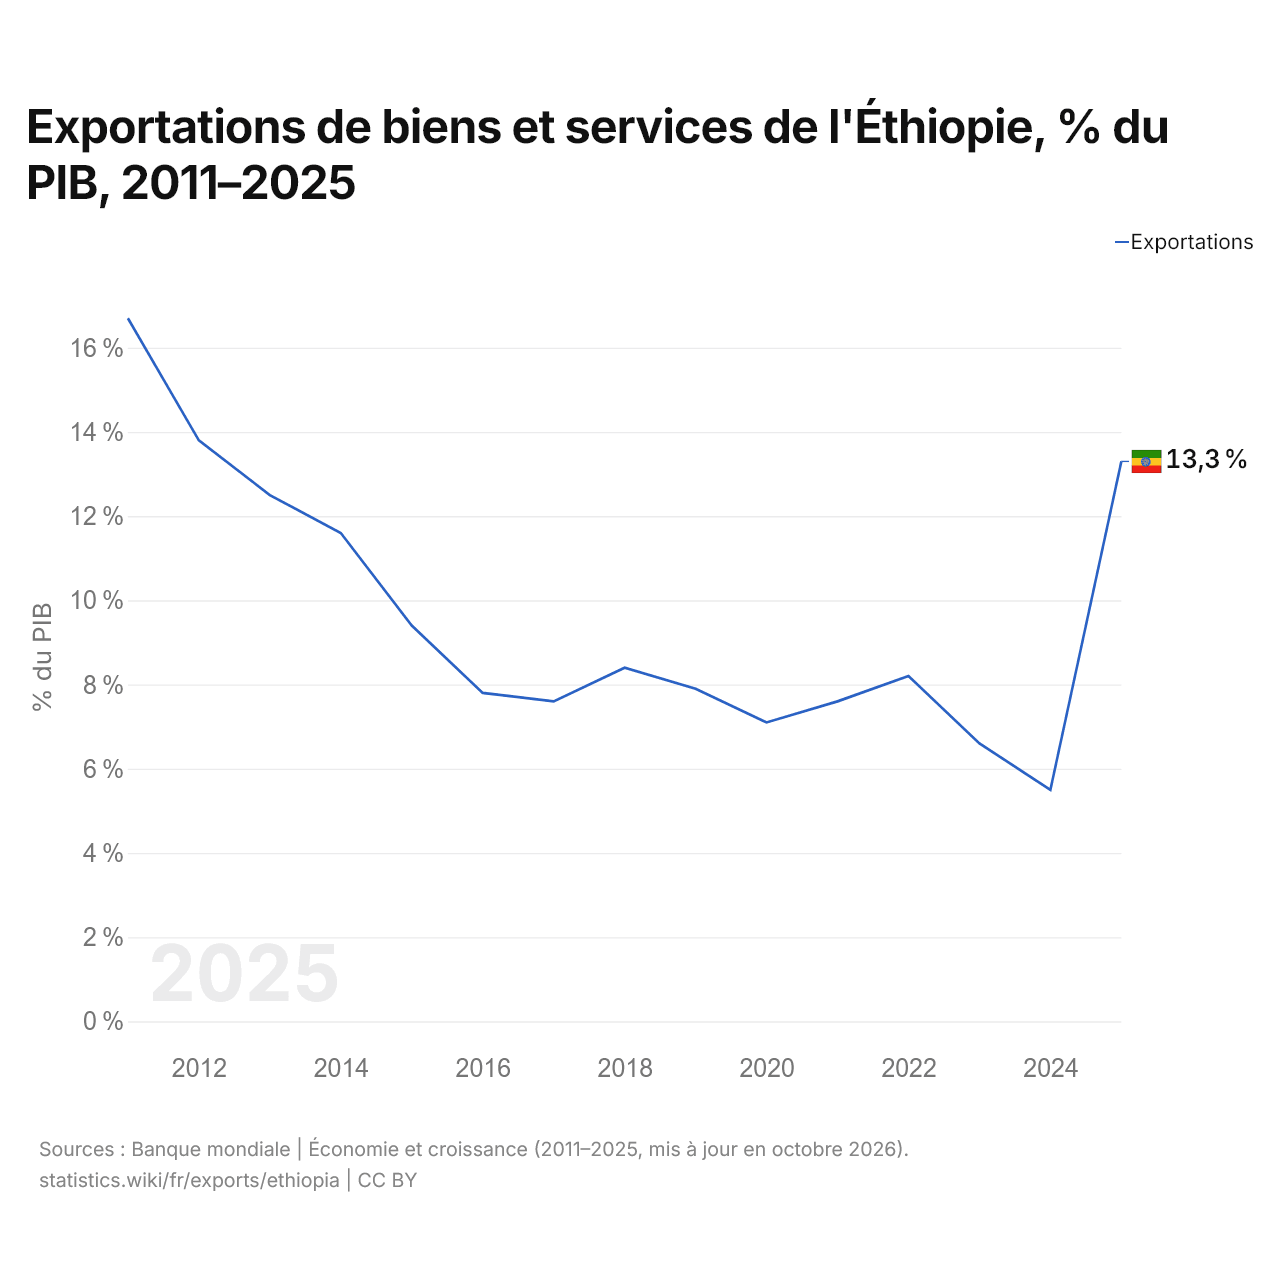
En 2025, les exportations de biens et services de l'Éthiopie équivalaient à 13,3 % de son PIB, contre 16,7 % en 2011. La part la plus faible a été de 5,5 %, en 2024.
Comparer les exportations de l'Éthiopie avec celles d'autres pays
Sources :
- TradeMap (2001–2023, mis à jour en octobre 2026)
- Banque mondiale | Économie et croissance (1977–2025, mis à jour en octobre 2026)
Creative Commons Attribution (CC BY) : vous pouvez copier, partager, adapter et réutiliser ce contenu, y compris à des fins commerciales, à condition de citer statistics.wiki et d’indiquer les modifications apportées. Les sources citées ci-dessus peuvent avoir leurs propres conditions de licence.