
Exportations de biens et services du Maroc par année ($ US), 1960–2025
| Année | $ US | Rang mondial |
|---|---|---|
| Exportations | Rang mondial | |
| 2025 | 76 541 039 368 $ US | #53 |
| 2024 | 67 454 245 753 $ US | #55 |
| 2023 | 61 945 010 973 $ US | #57 |
| 2022 | 58 681 916 332 $ US | #61 |
| 2021 | 47 060 549 921 $ US | #60 |
| 2020 | 37 369 771 251 $ US | #61 |
| 2019 | 43 952 860 516 $ US | #60 |
| 2018 | 43 077 520 359 $ US | #62 |
| 2017 | 38 651 885 813 $ US | #58 |
| 2016 | 34 291 493 550 $ US | #61 |
| 2015 | 33 119 569 274 $ US | #62 |
| 2014 | 35 897 680 524 $ US | #64 |
| 2013 | 35 014 914 037 $ US | #67 |
| 2012 | 34 323 797 625 $ US | #64 |
| 2011 | 35 175 698 018 $ US | #63 |
| 2010 | 30 046 721 233 $ US | #62 |
| 2009 | 26 014 198 657 $ US | #62 |
| 2008 | 33 064 161 825 $ US | #63 |
| 2007 | 27 325 793 519 $ US | #62 |
| 2006 | 22 483 592 810 $ US | #62 |
| 2005 | 19 275 921 048 $ US | #62 |
| 2004 | 16 759 410 599 $ US | #59 |
| 2003 | 14 319 608 062 $ US | #58 |
| 2002 | 12 213 885 546 $ US | #55 |
| 2001 | 11 131 243 438 $ US | #56 |
| 2000 | 10 408 859 646 $ US | #56 |
| 1999 | 10 472 253 114 $ US | #52 |
| 1998 | 9 784 229 421 $ US | #55 |
| 1997 | 9 365 776 467 $ US | #56 |
| 1996 | 9 424 749 951 $ US | #55 |
| 1995 | 8 849 422 506 $ US | #54 |
| 1994 | 7 454 972 835 $ US | #57 |
| 1993 | 6 983 435 380 $ US | #54 |
| 1992 | 7 474 470 438 $ US | #54 |
| 1991 | 7 205 742 183 $ US | #51 |
| 1990 | 7 411 991 822 $ US | #54 |
| 1989 | 5 935 176 840 $ US | #51 |
| 1988 | 6 425 436 406 $ US | #47 |
| 1987 | 4 893 088 773 $ US | #49 |
| 1986 | 4 258 765 117 $ US | #49 |
| 1985 | 3 824 760 012 $ US | #51 |
| 1984 | 3 800 181 964 $ US | #51 |
| 1983 | 3 697 958 875 $ US | #51 |
| 1982 | 3 822 370 232 $ US | #52 |
| 1981 | 4 032 797 040 $ US | #53 |
| 1980 | 4 201 411 557 $ US | #49 |
| 1979 | 2 706 652 298 $ US | #50 |
| 1978 | 2 167 005 746 $ US | #49 |
| 1977 | 1 866 967 362 $ US | #49 |
| 1976 | 1 717 031 972 $ US | #49 |
| 1975 | 2 019 155 151 $ US | #46 |
| 1974 | 2 115 101 331 $ US | #44 |
| 1973 | 1 300 658 084 $ US | #48 |
| 1972 | 942 466 528 $ US | #48 |
| 1971 | 738 600 056 $ US | #50 |
| 1970 | 697 778 278 $ US | #51 |
| 1969 | 671 081 259 $ US | - |
| 1968 | 604 684 527 $ US | - |
| 1967 | 545 401 730 $ US | - |
| 1966 | 545 401 730 $ US | - |
| 1965 | 535 521 264 $ US | - |
| 1964 | 545 401 671 $ US | - |
| 1963 | 476 238 487 $ US | - |
| 1962 | 428 812 249 $ US | - |
| 1961 | 440 668 809 $ US | - |
| 1960 | 480 190 673 $ US | - |
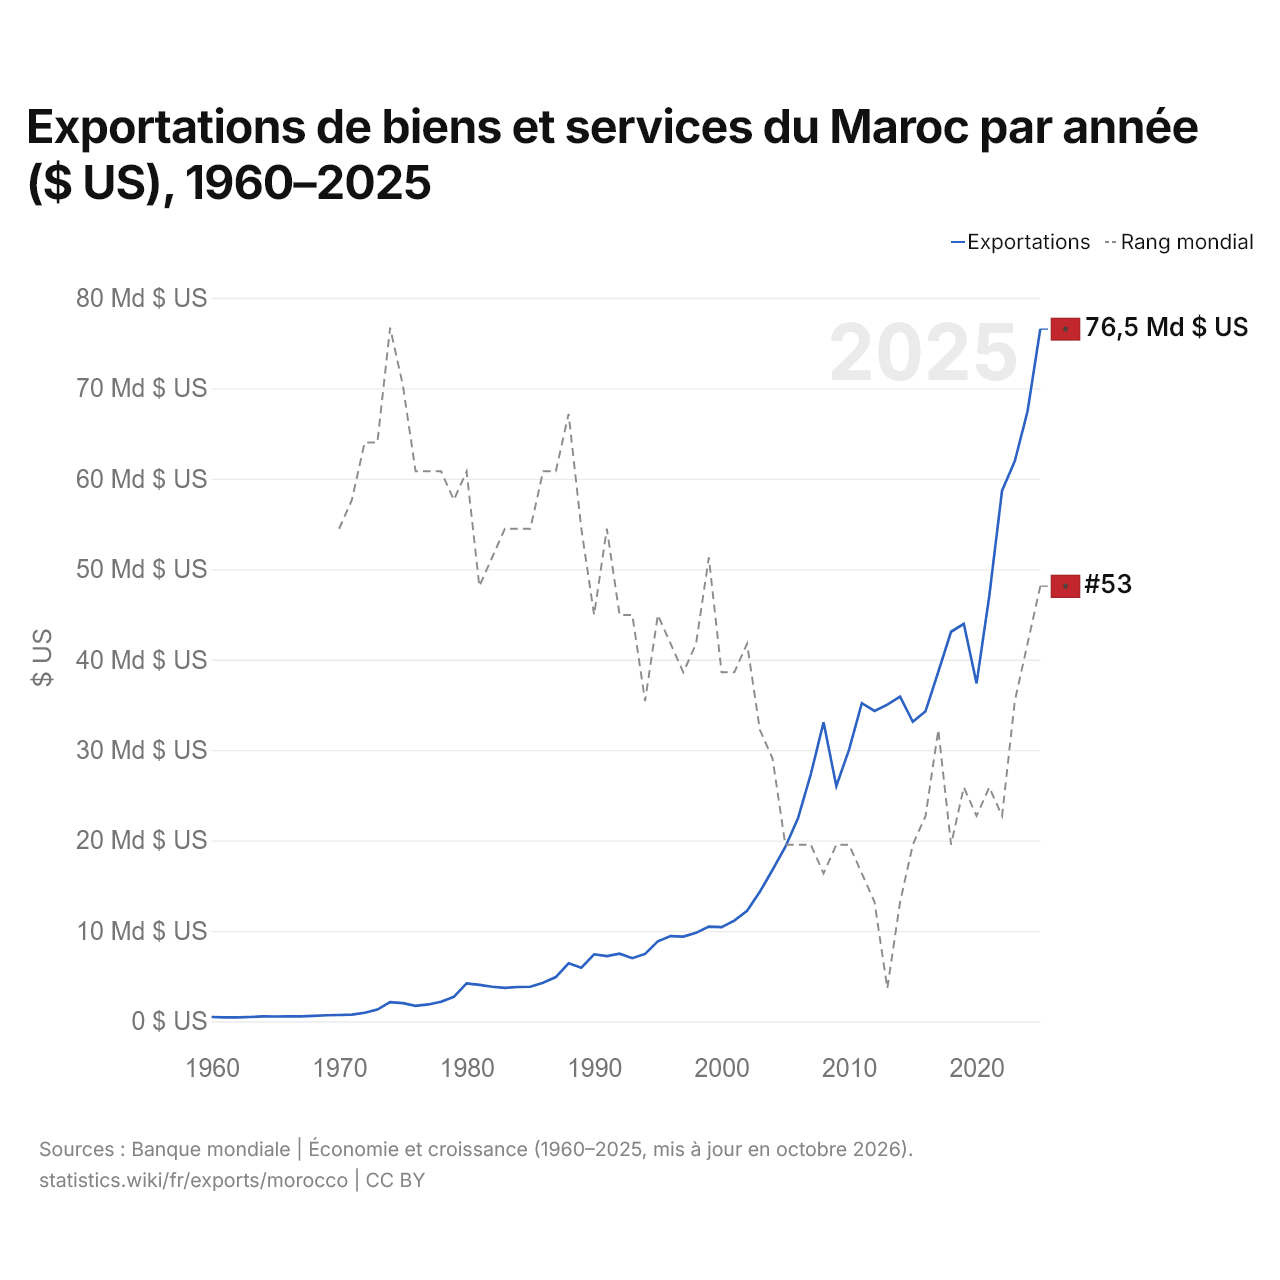
En 2025, les exportations de biens et services du Maroc s'élevaient à 76,5 milliards de dollars, contre 480 millions de dollars en 1960. Le minimum a été de 429 millions de dollars, en 1962. Elles se classaient au 53e rang mondial, en hausse par rapport au 55e rang en 2024. Leur meilleur rang a été le 44e, occupé pour la dernière fois en 1974.
En 2025, les exportations de biens et services du Maroc étaient les 2es plus élevées de 50 pays situés en Afrique, après celles de l'Afrique du Sud. Les importations de biens et services du Maroc s'élevaient à 93,3 milliards de dollars en 2025, au 51e rang mondial. En 2025, les importations du Maroc dépassaient ses exportations de 16,7 milliards de dollars, soit un déficit commercial.
Exportations de biens du Maroc par catégorie, 2025
Exportations de biens, 2025: 50,3 Md $US
En 2025, la première catégorie des exportations de biens du Maroc était « machines, électronique et véhicules », avec 39,8 %, suivie de « pétrole, gaz, minerais et autres matières premières », avec 24,5 %.
Destinations des exportations de biens du Maroc : les 10 premières, 2025
| Rang | Pays | Exportations de biens | Part | |
|---|---|---|---|---|
| 1 |
 Espagne |
10,8 Md $US | 21,5 % | vs Espagne |
| 2 |
 France |
9,57 Md $US | 19 % | vs France |
| 3 |
 Allemagne |
2,67 Md $US | 5,31 % | vs Allemagne |
| 4 |
 Inde |
2,58 Md $US | 5,12 % | vs Inde |
| 5 |
 Royaume-Uni |
2,12 Md $US | 4,22 % | vs R.-U. |
| 6 |
 Italie |
2,04 Md $US | 4,05 % | vs Italie |
| 7 |
 États-Unis |
1,62 Md $US | 3,22 % | vs USA |
| 8 |
 Brésil |
1,32 Md $US | 2,62 % | vs Brésil |
| 9 |
 Turquie |
1,18 Md $US | 2,34 % | vs Turquie |
| 10 |
 Pays-Bas |
1,08 Md $US | 2,14 % | vs Pays-Bas |
| Autres partenaires et non précisés | 15,3 Md $US | 30,4 % |
Exportations de biens du Maroc vers ses 5 principales destinations ($ US), 2001–2025
| Année | $ US | ||||
|---|---|---|---|---|---|
| Espagne | France | Allemagne | Inde | Royaume-Uni | |
| 2025 | 10 821 285 000 $ US | 9 571 673 000 $ US | 2 673 528 000 $ US | 2 578 262 000 $ US | 2 123 150 000 $ US |
| 2024 | 10 127 748 000 $ US | 8 858 288 000 $ US | 2 359 736 000 $ US | 1 469 306 000 $ US | 2 075 079 000 $ US |
| 2023 | 9 574 244 000 $ US | 8 721 245 000 $ US | 1 816 257 000 $ US | 1 217 919 000 $ US | 1 893 037 000 $ US |
| 2022 | 8 308 259 000 $ US | 8 088 206 000 $ US | 1 336 410 000 $ US | 2 694 862 000 $ US | 1 609 592 000 $ US |
| 2021 | 7 865 015 000 $ US | 7 516 064 000 $ US | 1 075 011 000 $ US | 1 806 734 000 $ US | 1 197 087 000 $ US |
| 2020 | 6 612 483 000 $ US | 6 056 044 000 $ US | 903 643 000 $ US | 1 191 209 000 $ US | 566 658 000 $ US |
| 2019 | 7 134 920 000 $ US | 6 468 842 000 $ US | 937 456 000 $ US | 855 400 000 $ US | 727 720 000 $ US |
| 2018 | 6 919 648 000 $ US | 6 381 202 000 $ US | 927 953 000 $ US | 1 101 799 000 $ US | 830 129 000 $ US |
| 2017 | 6 065 919 000 $ US | 5 867 173 000 $ US | 721 770 000 $ US | 662 531 000 $ US | 605 773 000 $ US |
| 2016 | 5 334 427 000 $ US | 4 826 156 000 $ US | 629 149 000 $ US | 758 187 000 $ US | 669 906 000 $ US |
| 2015 | 5 003 960 000 $ US | 4 490 253 000 $ US | 570 710 000 $ US | 877 824 000 $ US | 616 097 000 $ US |
| 2014 | 5 206 035 000 $ US | 4 951 106 000 $ US | 681 777 000 $ US | 866 844 000 $ US | 714 720 000 $ US |
| 2013 | 4 142 563 000 $ US | 4 719 273 000 $ US | 597 259 000 $ US | 814 633 000 $ US | 593 750 000 $ US |
| 2012 | 3 540 915 000 $ US | 4 619 485 000 $ US | 644 762 000 $ US | 1 160 555 000 $ US | 597 066 000 $ US |
| 2011 | 3 953 759 000 $ US | 4 564 209 000 $ US | 618 489 000 $ US | 1 504 929 000 $ US | 604 878 000 $ US |
| 2010 | 3 004 326 000 $ US | 3 991 780 000 $ US | 556 421 000 $ US | 1 075 558 000 $ US | 515 542 000 $ US |
| 2009 | 2 925 869 000 $ US | 3 498 487 000 $ US | 474 996 000 $ US | 726 311 000 $ US | 467 199 000 $ US |
| 2008 | 3 594 976 000 $ US | 4 060 899 000 $ US | 520 727 000 $ US | 1 357 346 000 $ US | 690 253 000 $ US |
| 2007 | 3 119 916 000 $ US | 4 286 378 000 $ US | 452 297 000 $ US | 592 405 000 $ US | 779 792 000 $ US |
| 2006 | 2 571 715 000 $ US | 3 704 366 000 $ US | 389 117 000 $ US | 506 673 000 $ US | 780 714 000 $ US |
| 2005 | 2 238 480 000 $ US | 3 371 622 000 $ US | 358 325 000 $ US | 444 300 000 $ US | 709 374 000 $ US |
| 2004 | 1 732 987 000 $ US | 3 334 742 000 $ US | 338 918 000 $ US | 338 620 000 $ US | 757 150 000 $ US |
| 2003 | 1 565 002 000 $ US | 3 002 670 000 $ US | 345 044 000 $ US | 273 108 000 $ US | 638 864 000 $ US |
| 2002 | 1 229 081 000 $ US | 2 646 962 000 $ US | 327 644 000 $ US | 259 174 000 $ US | 621 244 000 $ US |
| 2001 | 1 046 821 000 $ US | 2 321 617 000 $ US | 336 250 000 $ US | 244 678 000 $ US | 588 897 000 $ US |
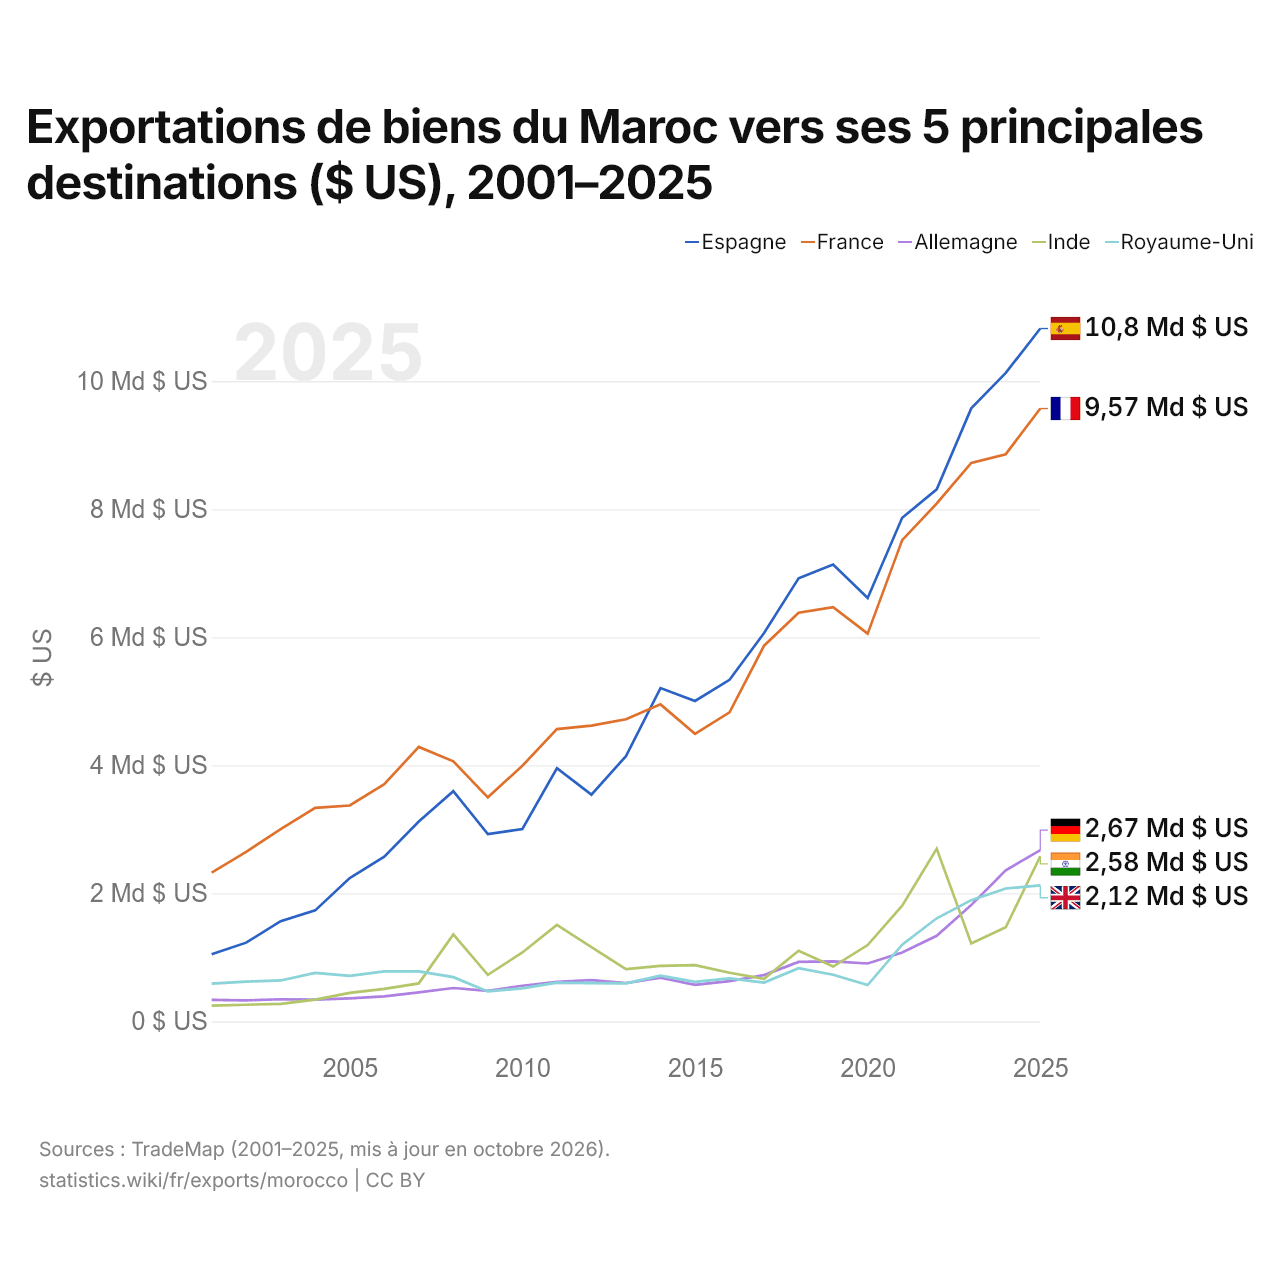
En 2025, les exportations de biens s'élevaient à 10,8 milliards de dollars vers l'Espagne, 9,57 milliards de dollars vers la France, 2,67 milliards de dollars vers l'Allemagne, 2,58 milliards de dollars vers l'Inde et 2,12 milliards de dollars vers le Royaume-Uni. Le premier rang des cinq destinations du Maroc est occupé par l'Espagne depuis 2014. Le changement le plus récent dans leur ordre remonte à 2025, quand les exportations du Maroc vers l'Inde ont dépassé celles vers le Royaume-Uni.
Exportations de biens et de services du Maroc ($ US), 1975–2025
| Année | $ US | |
|---|---|---|
| Biens | Services | |
| 2025 | 43 714 635 564 $ US | 33 644 684 565 $ US |
| 2024 | 39 292 379 663 $ US | 28 338 887 266 $ US |
| 2023 | 36 295 292 347 $ US | 25 655 255 268 $ US |
| 2022 | 36 574 850 669 $ US | 22 000 257 954 $ US |
| 2021 | 31 674 683 734 $ US | 15 415 551 381 $ US |
| 2020 | 23 678 514 763 $ US | 13 866 840 984 $ US |
| 2019 | 24 694 700 800 $ US | 19 353 280 376 $ US |
| 2018 | 24 619 714 761 $ US | 18 633 703 348 $ US |
| 2017 | 21 506 087 030 $ US | 17 330 125 310 $ US |
| 2016 | 19 054 117 273 $ US | 15 340 235 467 $ US |
| 2015 | 18 618 821 762 $ US | 14 673 499 897 $ US |
| 2014 | 19 977 019 526 $ US | 16 236 442 777 $ US |
| 2013 | 18 261 756 867 $ US | 14 352 647 009 $ US |
| 2012 | 16 991 999 569 $ US | 15 346 623 448 $ US |
| 2011 | 15 945 749 512 $ US | 15 899 061 611 $ US |
| 2010 | 12 309 391 165 $ US | 14 736 068 692 $ US |
| 2009 | 9 166 096 929 $ US | 14 832 715 838 $ US |
| 2008 | 15 252 247 954 $ US | 15 301 689 025 $ US |
| 2007 | 9 884 669 615 $ US | 14 064 836 643 $ US |
| 2006 | 8 038 370 872 $ US | 11 376 690 496 $ US |
| 2005 | 7 328 056 004 $ US | 9 264 050 515 $ US |
| 2004 | 6 483 546 705 $ US | 8 014 770 257 $ US |
| 2003 | 5 529 935 423 $ US | 6 803 909 646 $ US |
| 2002 | 5 098 232 852 $ US | 5 424 395 260 $ US |
| 2001 | 4 704 088 968 $ US | 4 843 574 369 $ US |
| 2000 | 4 860 330 167 $ US | 3 990 556 362 $ US |
| 1999 | 4 865 255 064 $ US | 3 952 299 401 $ US |
| 1998 | 4 667 019 919 $ US | 3 613 025 571 $ US |
| 1997 | 4 677 075 796 $ US | 3 185 962 020 $ US |
| 1996 | 4 745 707 808 $ US | 3 432 242 562 $ US |
| 1995 | 4 712 633 326 $ US | 2 853 434 083 $ US |
| 1994 | 3 974 044 616 $ US | 2 484 158 208 $ US |
| 1993 | 3 695 781 789 $ US | 2 371 511 960 $ US |
| 1992 | 3 977 570 531 $ US | 2 399 543 212 $ US |
| 1991 | 4 282 752 640 $ US | 1 834 595 793 $ US |
| 1990 | 4 229 137 957 $ US | 2 009 420 866 $ US |
| 1989 | 3 330 635 461 $ US | 1 649 904 121 $ US |
| 1988 | 3 624 004 921 $ US | 1 763 519 975 $ US |
| 1987 | 2 798 106 284 $ US | 1 379 075 213 $ US |
| 1986 | 2 428 045 652 $ US | 1 132 890 265 $ US |
| 1985 | 2 161 591 315 $ US | 983 222 102 $ US |
| 1984 | 2 169 902 077 $ US | 829 726 304 $ US |
| 1983 | 2 075 141 195 $ US | 845 271 649 $ US |
| 1982 | 2 070 389 078 $ US | 848 909 331 $ US |
| 1981 | 2 320 632 924 $ US | 726 949 912 $ US |
| 1980 | 2 450 055 304 $ US | 782 730 645 $ US |
| 1979 | 1 955 049 423 $ US | 717 253 254 $ US |
| 1978 | 1 502 638 498 $ US | 635 599 365 $ US |
| 1977 | 1 301 254 716 $ US | 538 784 589 $ US |
| 1976 | 1 262 413 554 $ US | 434 004 158 $ US |
| 1975 | 1 539 301 479 $ US | 459 141 865 $ US |
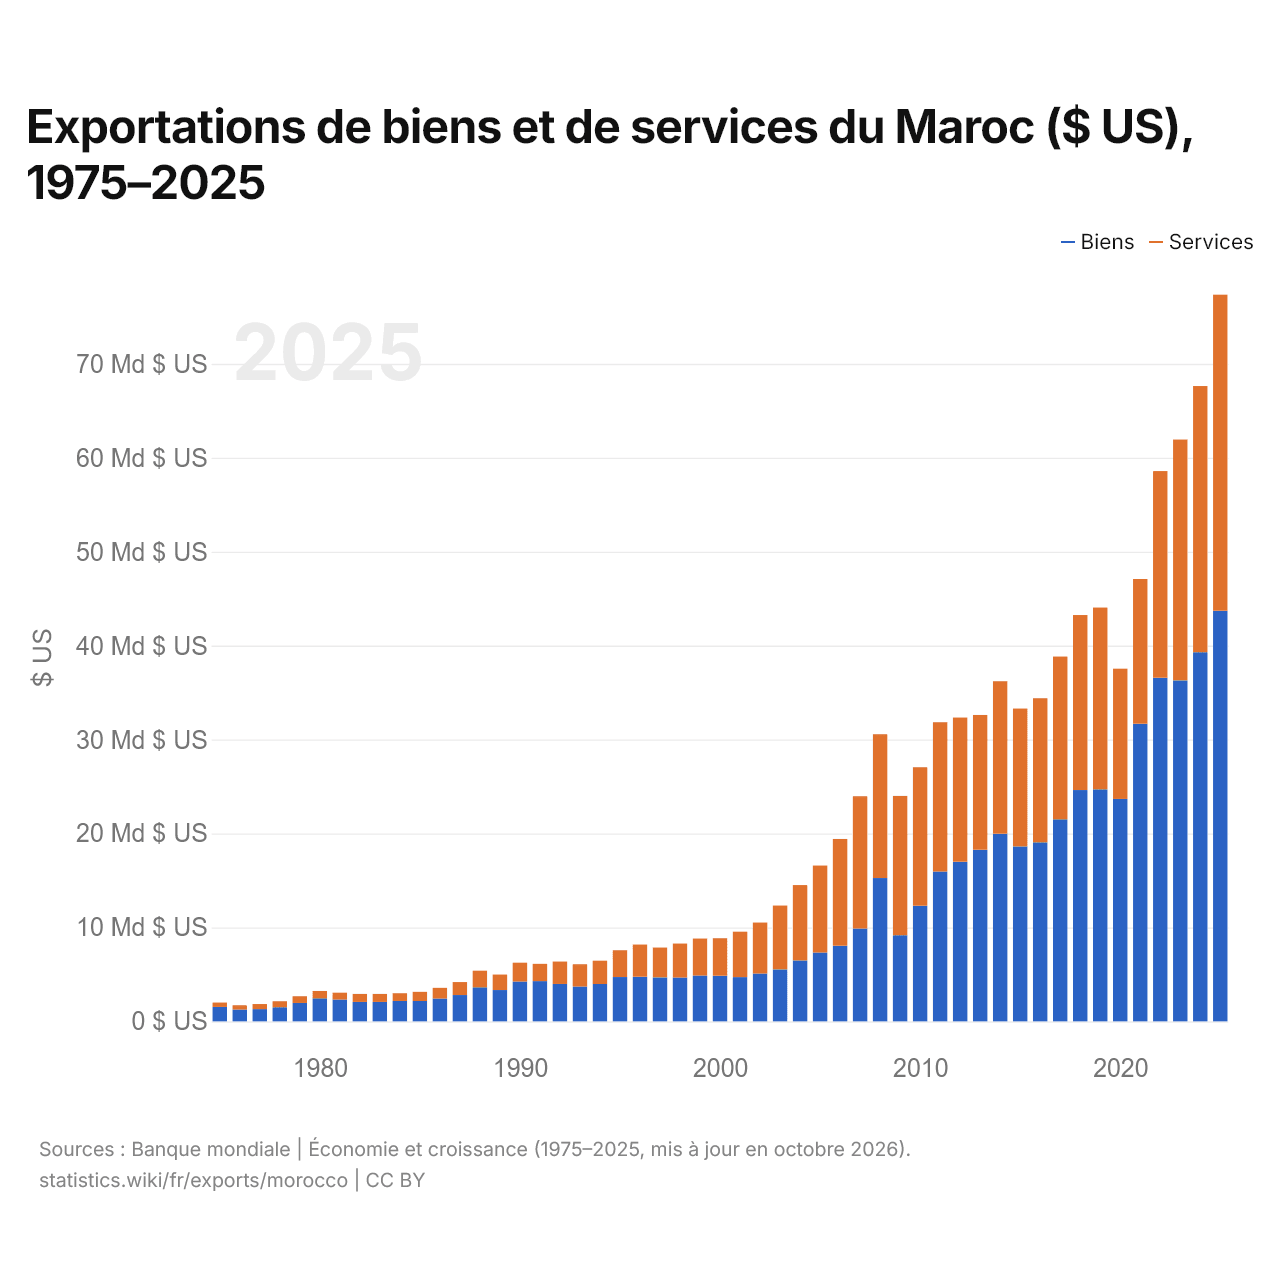
En 2025, les exportations de biens du Maroc s'élevaient à 43,7 milliards de dollars et celles de services à 33,6 milliards de dollars ; les services représentaient 43,5 % du total, contre 23,0 % en 1975.
Le Maroc dans le classement mondial des exportations, 2025
| Rang | Pays | Exportations | Part mondiale | |
|---|---|---|---|---|
| 50 |
 Iran |
93,4 Md $US | 0,27 % | vs Iran |
| 51 |
 Kazakhstan |
92,1 Md $US (2024) | 0,28 % | vs Kazakhstan |
| 52 |
 Koweït |
83,4 Md $US | 0,24 % | |
| 53 |
 Maroc |
76,5 Md $US | 0,22 % | |
| 54 |
 Égypte |
72,4 Md $US | 0,21 % | vs Égypte |
| 55 |
 Lituanie |
69,5 Md $US | 0,2 % | |
| 56 |
 Colombie |
68,5 Md $US | 0,2 % | vs Colombie |
Exportations de biens et services du Maroc, % du PIB, 1960–2025
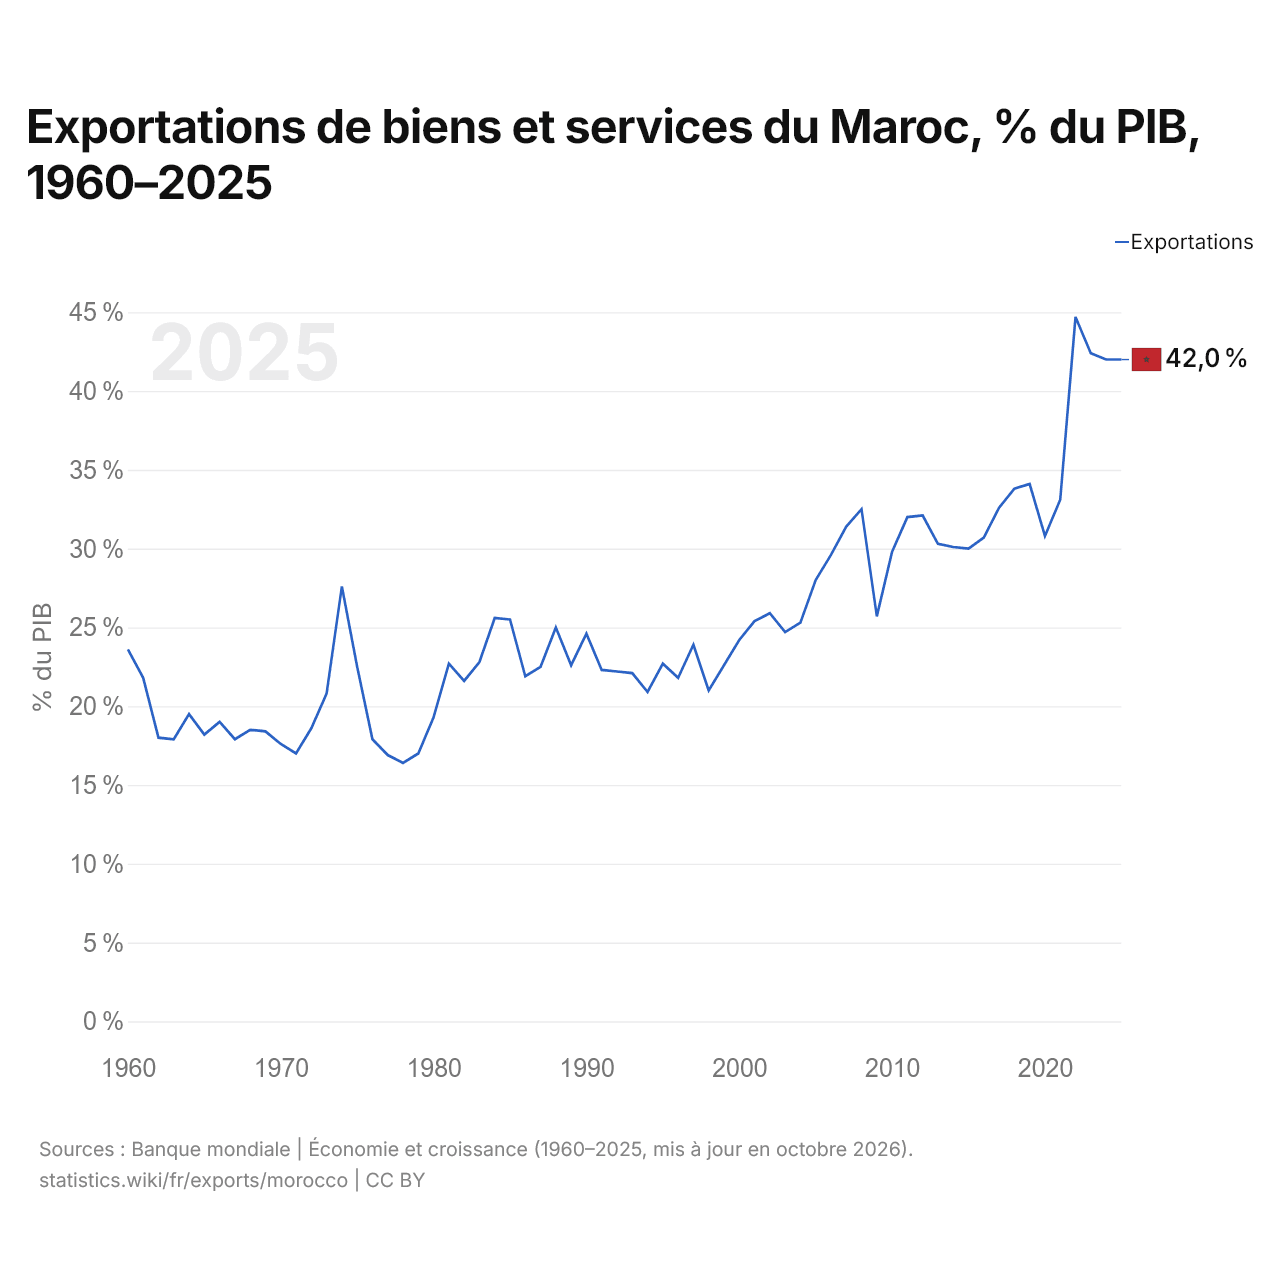
En 2025, les exportations de biens et services du Maroc équivalaient à 42,0 % de son PIB, contre 23,6 % en 1960. La part la plus élevée a été de 44,7 %, en 2022.
Comparer les exportations du Maroc avec celles d'autres pays
Sources :
- TradeMap (2001–2025, mis à jour en octobre 2026)
- Banque mondiale | Économie et croissance (1960–2025, mis à jour en octobre 2026)
Creative Commons Attribution (CC BY) : vous pouvez copier, partager, adapter et réutiliser ce contenu, y compris à des fins commerciales, à condition de citer statistics.wiki et d’indiquer les modifications apportées. Les sources citées ci-dessus peuvent avoir leurs propres conditions de licence.