
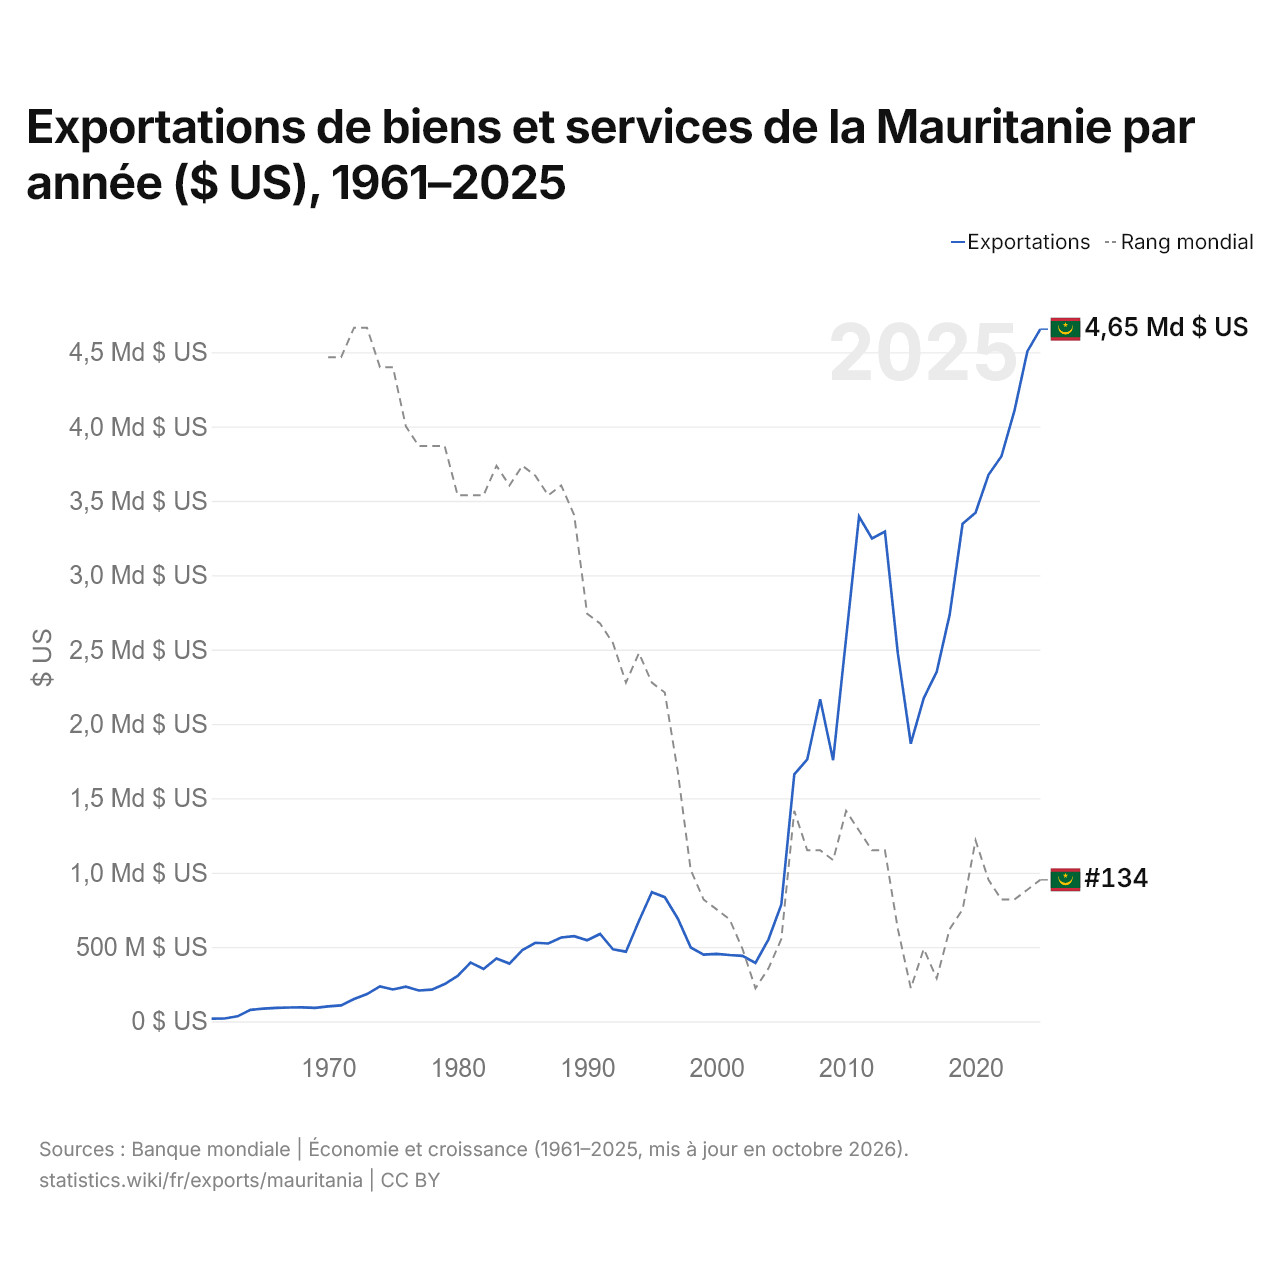
Exportations de biens et services de la Mauritanie par année ($ US), 1961–2025
| Année | $ US | Rang mondial |
|---|---|---|
| Exportations | Rang mondial | |
| 2025 | 4 654 787 700 $ US | #134 |
| 2024 | 4 505 172 132 $ US | #135 |
| 2023 | 4 104 773 824 $ US | #136 |
| 2022 | 3 799 926 864 $ US | #136 |
| 2021 | 3 675 141 708 $ US | #134 |
| 2020 | 3 420 379 134 $ US | #130 |
| 2019 | 3 347 184 840 $ US | #137 |
| 2018 | 2 734 994 652 $ US | #139 |
| 2017 | 2 350 689 953 $ US | #144 |
| 2016 | 2 173 889 319 $ US | #141 |
| 2015 | 1 866 755 544 $ US | #145 |
| 2014 | 2 473 476 423 $ US | #139 |
| 2013 | 3 293 457 996 $ US | #131 |
| 2012 | 3 247 124 766 $ US | #131 |
| 2011 | 3 394 680 269 $ US | #129 |
| 2010 | 2 574 612 468 $ US | #127 |
| 2009 | 1 755 986 391 $ US | #132 |
| 2008 | 2 166 026 281 $ US | #131 |
| 2007 | 1 761 222 665 $ US | #131 |
| 2006 | 1 660 493 771 $ US | #127 |
| 2005 | 785 480 557 $ US | #140 |
| 2004 | 549 736 448 $ US | #143 |
| 2003 | 392 277 307 $ US | #145 |
| 2002 | 440 241 262 $ US | #141 |
| 2001 | 445 892 165 $ US | #138 |
| 2000 | 454 082 404 $ US | #137 |
| 1999 | 448 206 606 $ US | #136 |
| 1998 | 497 095 341 $ US | #133 |
| 1997 | 691 882 213 $ US | #123 |
| 1996 | 834 998 051 $ US | #115 |
| 1995 | 867 783 179 $ US | #114 |
| 1994 | 674 865 005 $ US | #111 |
| 1993 | 468 506 040 $ US | #114 |
| 1992 | 484 196 055 $ US | #110 |
| 1991 | 587 632 452 $ US | #108 |
| 1990 | 545 201 152 $ US | #107 |
| 1989 | 573 030 754 $ US | #97 |
| 1988 | 563 821 409 $ US | #94 |
| 1987 | 523 245 223 $ US | #95 |
| 1986 | 528 194 860 $ US | #93 |
| 1985 | 479 510 831 $ US | #92 |
| 1984 | 388 242 382 $ US | #94 |
| 1983 | 422 438 627 $ US | #92 |
| 1982 | 352 134 016 $ US | #95 |
| 1981 | 394 924 879 $ US | #95 |
| 1980 | 305 883 194 $ US | #95 |
| 1979 | 250 406 342 $ US | #90 |
| 1978 | 212 820 785 $ US | #90 |
| 1977 | 207 623 939 $ US | #90 |
| 1976 | 233 122 598 $ US | #88 |
| 1975 | 214 328 859 $ US | #82 |
| 1974 | 234 683 631 $ US | #82 |
| 1973 | 183 111 490 $ US | #78 |
| 1972 | 149 725 282 $ US | #78 |
| 1971 | 106 987 201 $ US | #81 |
| 1970 | 100 097 730 $ US | #81 |
| 1969 | 90 845 289 $ US | - |
| 1968 | 93 804 932 $ US | - |
| 1967 | 93 211 739 $ US | - |
| 1966 | 90 846 088 $ US | - |
| 1965 | 85 405 336 $ US | - |
| 1964 | 77 479 912 $ US | - |
| 1963 | 33 594 342 $ US | - |
| 1962 | 18 926 390 $ US | - |
| 1961 | 18 098 362 $ US | - |
En 2025, les exportations de biens et services de la Mauritanie s'élevaient à 4,65 milliards de dollars, contre 18,1 millions de dollars en 1961. Elles se classaient au 134e rang mondial, en hausse par rapport au 135e rang en 2024. Leur meilleur rang a été le 78e, occupé pour la dernière fois en 1973.
En 2025, les exportations de biens et services de la Mauritanie étaient les 31es plus élevées de 50 pays situés en Afrique. Les importations de biens et services de la Mauritanie s'élevaient à 6,33 milliards de dollars en 2025, au 134e rang mondial. En 2025, les importations de la Mauritanie dépassaient ses exportations de 1,67 milliard de dollars, soit un déficit commercial.
Exportations de biens de la Mauritanie par catégorie, 2025
Exportations de biens, 2025: 4,50 Md $US
En 2025, la première catégorie des exportations de biens de la Mauritanie était « pétrole, gaz, minerais et autres matières premières », avec 37,3 %, suivie de « métaux précieux, pierres précieuses, bijoux, montres, instruments de musique et art », avec 36,5 %.
Destinations des exportations de biens de la Mauritanie : les 10 premières, 2025
| Rang | Pays | Exportations de biens | Part | |
|---|---|---|---|---|
| 1 |
 Chine |
971 M $US | 21,6 % | |
| 2 |
 Canada |
814 M $US | 18,1 % | |
| 3 |
 Suisse |
671 M $US | 14,9 % | |
| 4 |
 Espagne |
425 M $US | 9,45 % | |
| 5 |
 Algérie |
252 M $US | 5,61 % | |
| 6 |
 Royaume-Uni |
136 M $US | 3,02 % | |
| 7 |
 Italie |
123 M $US | 2,73 % | |
| 8 |
 EAU |
109 M $US | 2,43 % | |
| 9 |
 Japon |
91,0 M $US | 2,02 % | |
| 10 |
 Côte d’Ivoire |
85,6 M $US | 1,9 % | |
| Autres partenaires et non précisés | 822 M $US | 18,3 % |
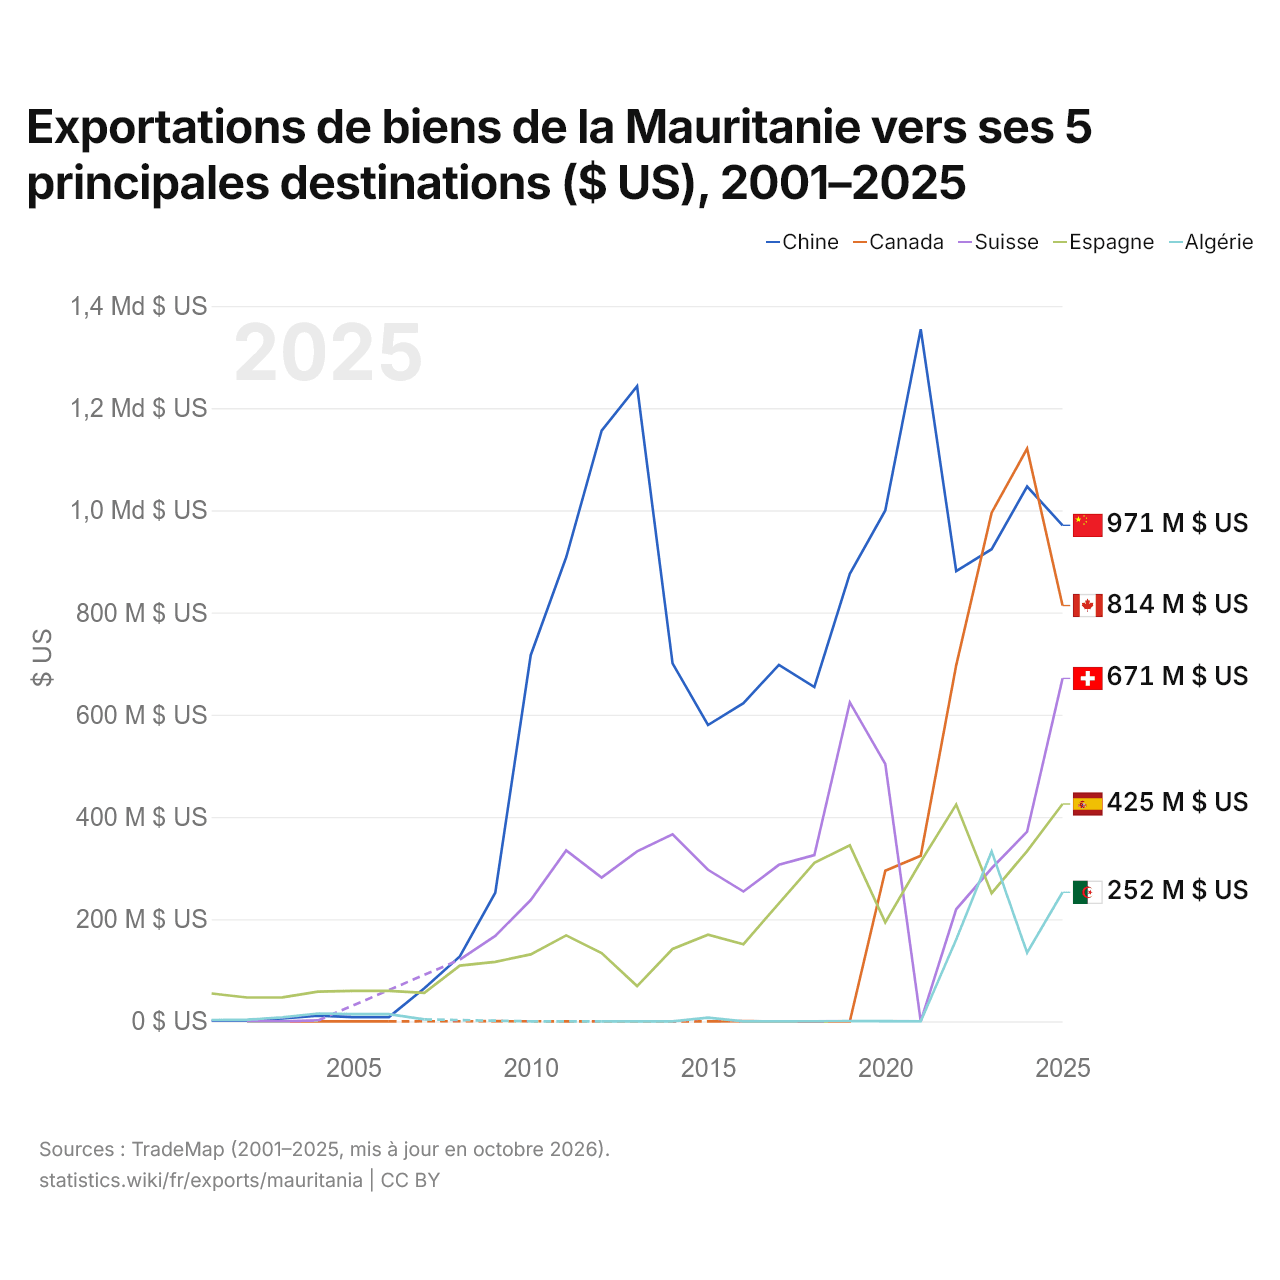
Exportations de biens de la Mauritanie vers ses 5 principales destinations ($ US), 2001–2025
| Année | $ US | ||||
|---|---|---|---|---|---|
| Chine | Canada | Suisse | Espagne | Algérie | |
| 2025 | 970 618 000 $ US | 813 640 000 $ US | 671 065 000 $ US | 425 320 000 $ US | 252 486 000 $ US |
| 2024 | 1 046 557 000 $ US | 1 120 575 000 $ US | 371 230 000 $ US | 333 252 000 $ US | 134 218 000 $ US |
| 2023 | 923 791 000 $ US | 995 383 000 $ US | 299 476 000 $ US | 250 831 000 $ US | 332 526 000 $ US |
| 2022 | 881 153 000 $ US | 696 585 000 $ US | 219 332 000 $ US | 424 155 000 $ US | 160 008 000 $ US |
| 2021 | 1 354 264 000 $ US | 324 021 000 $ US | 19 000 $ US | 312 283 000 $ US | 140 000 $ US |
| 2020 | 999 793 000 $ US | 294 775 000 $ US | 503 659 000 $ US | 193 500 000 $ US | 471 000 $ US |
| 2019 | 875 593 000 $ US | 3 000 $ US | 624 163 000 $ US | 344 289 000 $ US | 630 000 $ US |
| 2018 | 654 171 000 $ US | 2 000 $ US | 325 184 000 $ US | 310 002 000 $ US | 138 000 $ US |
| 2017 | 697 634 000 $ US | 119 000 $ US | 306 281 000 $ US | 230 903 000 $ US | 64 000 $ US |
| 2016 | 622 733 000 $ US | 286 000 $ US | 254 015 000 $ US | 150 846 000 $ US | 38 000 $ US |
| 2015 | 579 816 000 $ US | 1 000 $ US | 296 575 000 $ US | 169 412 000 $ US | 7 088 000 $ US |
| 2014 | 700 461 000 $ US | - | 365 848 000 $ US | 141 534 000 $ US | 62 000 $ US |
| 2013 | 1 242 742 000 $ US | - | 332 607 000 $ US | 68 925 000 $ US | 11 000 $ US |
| 2012 | 1 155 814 000 $ US | - | 281 387 000 $ US | 133 617 000 $ US | 17 000 $ US |
| 2011 | 908 028 000 $ US | 1 000 $ US | 334 443 000 $ US | 168 225 000 $ US | - |
| 2010 | 716 494 000 $ US | - | 237 421 000 $ US | 130 920 000 $ US | 34 000 $ US |
| 2009 | 251 542 000 $ US | 276 000 $ US | 167 162 000 $ US | 116 420 000 $ US | - |
| 2008 | 126 930 000 $ US | - | 120 801 000 $ US | 108 990 000 $ US | - |
| 2007 | 64 756 000 $ US | - | - | 55 794 000 $ US | 3 766 000 $ US |
| 2006 | 8 180 000 $ US | 14 000 $ US | - | 59 564 000 $ US | 13 963 000 $ US |
| 2005 | 8 180 000 $ US | 14 000 $ US | - | 59 564 000 $ US | 13 963 000 $ US |
| 2004 | 11 045 000 $ US | 8 000 $ US | 1 716 000 $ US | 58 034 000 $ US | 15 265 000 $ US |
| 2003 | 5 860 000 $ US | 27 000 $ US | 10 000 $ US | 46 956 000 $ US | 7 701 000 $ US |
| 2002 | 1 951 000 $ US | 37 000 $ US | 10 000 $ US | 46 563 000 $ US | 3 248 000 $ US |
| 2001 | 1 491 000 $ US | - | - | 54 562 000 $ US | 2 448 000 $ US |
En 2025, les exportations de biens s'élevaient à 971 millions de dollars vers la Chine, 814 millions de dollars vers le Canada, 671 millions de dollars vers la Suisse, 425 millions de dollars vers l'Espagne et 252 millions de dollars vers l'Algérie. Le changement le plus récent dans leur ordre remonte à 2025, quand les exportations de la Mauritanie vers la Chine ont dépassé celles vers le Canada.
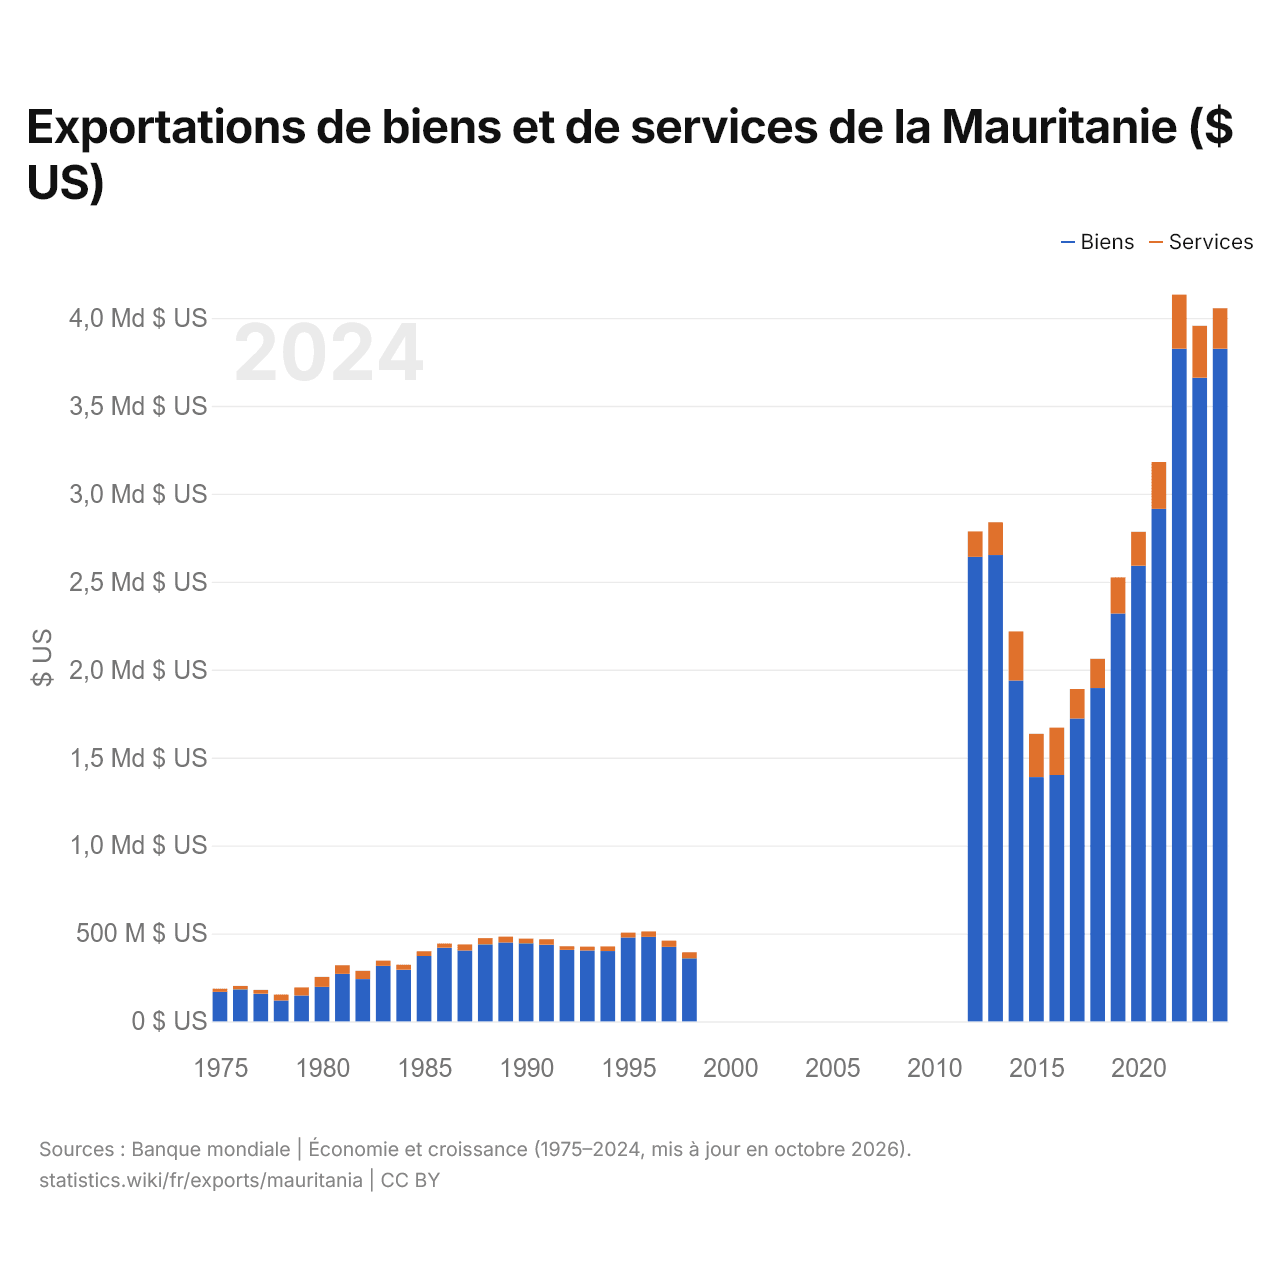
Exportations de biens et de services de la Mauritanie ($ US)
| Année | $ US | |
|---|---|---|
| Biens | Services | |
| 2024 | 3 825 080 246 $ US | 229 552 473 $ US |
| 2023 | 3 659 816 979 $ US | 295 489 467 $ US |
| 2022 | 3 824 934 095 $ US | 307 226 399 $ US |
| 2021 | 2 913 808 281 $ US | 266 687 318 $ US |
| 2020 | 2 590 779 667 $ US | 193 178 901 $ US |
| 2019 | 2 319 241 121 $ US | 205 489 335 $ US |
| 2018 | 1 895 040 485 $ US | 166 751 920 $ US |
| 2017 | 1 722 378 603 $ US | 167 206 852 $ US |
| 2016 | 1 400 680 263 $ US | 269 930 113 $ US |
| 2015 | 1 388 560 351 $ US | 246 176 571 $ US |
| 2014 | 1 938 072 314 $ US | 278 804 375 $ US |
| 2013 | 2 651 470 172 $ US | 186 244 014 $ US |
| 2012 | 2 640 958 168 $ US | 145 165 307 $ US |
| 2011 | - | - |
| 2010 | - | - |
| 2009 | - | - |
| 2008 | - | - |
| 2007 | - | - |
| 2006 | - | - |
| 2005 | - | - |
| 2004 | - | - |
| 2003 | - | - |
| 2002 | - | - |
| 2001 | - | - |
| 2000 | - | - |
| 1999 | - | - |
| 1998 | 358 640 144 $ US | 33 972 525 $ US |
| 1997 | 423 619 282 $ US | 34 908 684 $ US |
| 1996 | 480 040 810 $ US | 31 554 784 $ US |
| 1995 | 476 402 820 $ US | 27 880 454 $ US |
| 1994 | 399 652 033 $ US | 26 008 497 $ US |
| 1993 | 402 985 507 $ US | 21 381 418 $ US |
| 1992 | 406 771 481 $ US | 20 154 723 $ US |
| 1991 | 435 763 462 $ US | 31 203 539 $ US |
| 1990 | 443 895 843 $ US | 26 771 204 $ US |
| 1989 | 447 893 463 $ US | 33 605 857 $ US |
| 1988 | 437 611 418 $ US | 35 250 739 $ US |
| 1987 | 402 404 855 $ US | 34 543 281 $ US |
| 1986 | 418 756 303 $ US | 23 731 092 $ US |
| 1985 | 371 524 940 $ US | 27 086 982 $ US |
| 1984 | 293 793 428 $ US | 28 023 614 $ US |
| 1983 | 315 370 815 $ US | 30 249 035 $ US |
| 1982 | 240 027 043 $ US | 47 248 201 $ US |
| 1981 | 269 919 765 $ US | 48 906 911 $ US |
| 1980 | 196 301 425 $ US | 56 475 047 $ US |
| 1979 | 147 170 017 $ US | 45 454 050 $ US |
| 1978 | 118 581 099 $ US | 33 880 314 $ US |
| 1977 | 157 215 586 $ US | 21 541 189 $ US |
| 1976 | 181 865 633 $ US | 19 457 046 $ US |
| 1975 | 167 315 288 $ US | 18 049 264 $ US |
Les exportations de biens de la Mauritanie s'élèvent à 3,83 milliards de dollars (2024) et celles de services à 230 millions de dollars ; les services représentent 5,7 % du total, contre 9,7 % en 1975.
La Mauritanie dans le classement mondial des exportations, 2025
| Rang | Pays | Exportations | Part mondiale | |
|---|---|---|---|---|
| 131 |
 Guinée équatoriale |
5,97 Md $US | 0,02 % | |
| 132 |
 Djibouti |
5,11 Md $US | 0,01 % | |
| 133 |
 Îles Caïmans |
5,04 Md $US (2024) | 0,02 % | |
| 134 |
 Mauritanie |
4,65 Md $US | 0,01 % | |
| 135 |
 Bénin |
4,19 Md $US | 0,01 % | |
| 136 |
 Madagascar |
4,19 Md $US | 0,01 % | |
| 137 |
 Népal |
4,02 Md $US | 0,01 % |
Exportations de biens et services de la Mauritanie, % du PIB, 1961–2025
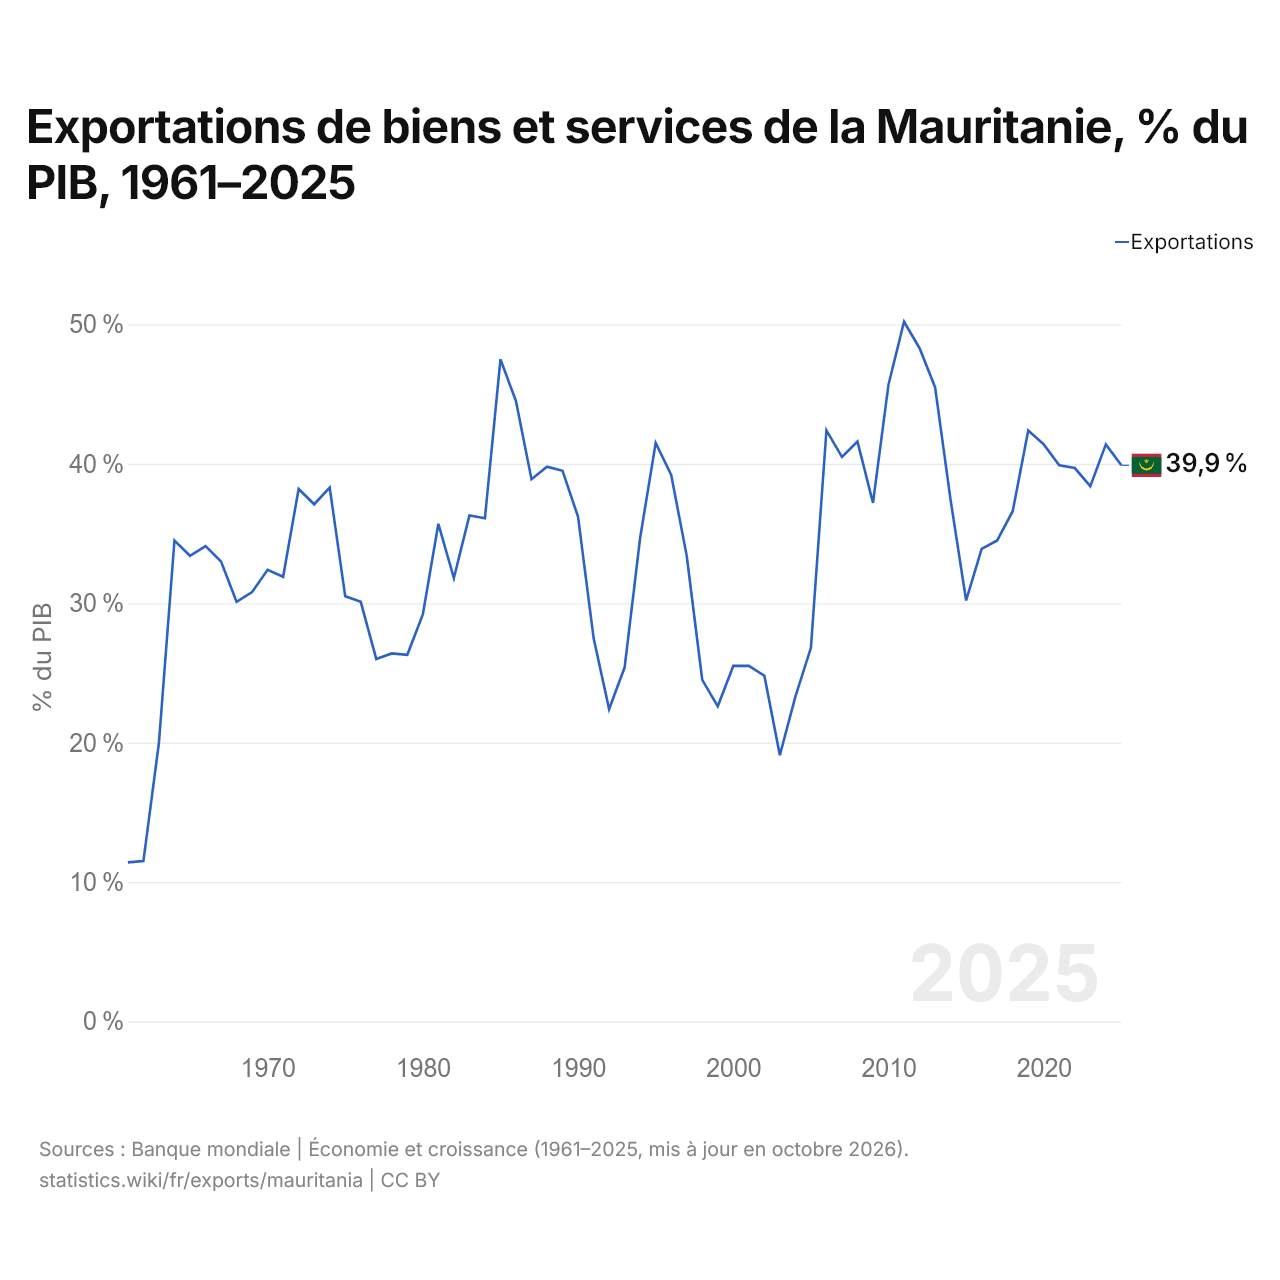
En 2025, les exportations de biens et services de la Mauritanie équivalaient à 39,9 % de son PIB, contre 11,4 % en 1961. La part la plus élevée a été de 50,2 %, en 2011.
Comparer les exportations de la Mauritanie avec celles d'autres pays
Sources :
- Banque mondiale | Économie et croissance (1961–2025, mis à jour en octobre 2026)
- TradeMap (2001–2025, mis à jour en octobre 2026)
Creative Commons Attribution (CC BY) : vous pouvez copier, partager, adapter et réutiliser ce contenu, y compris à des fins commerciales, à condition de citer statistics.wiki et d’indiquer les modifications apportées. Les sources citées ci-dessus peuvent avoir leurs propres conditions de licence.