
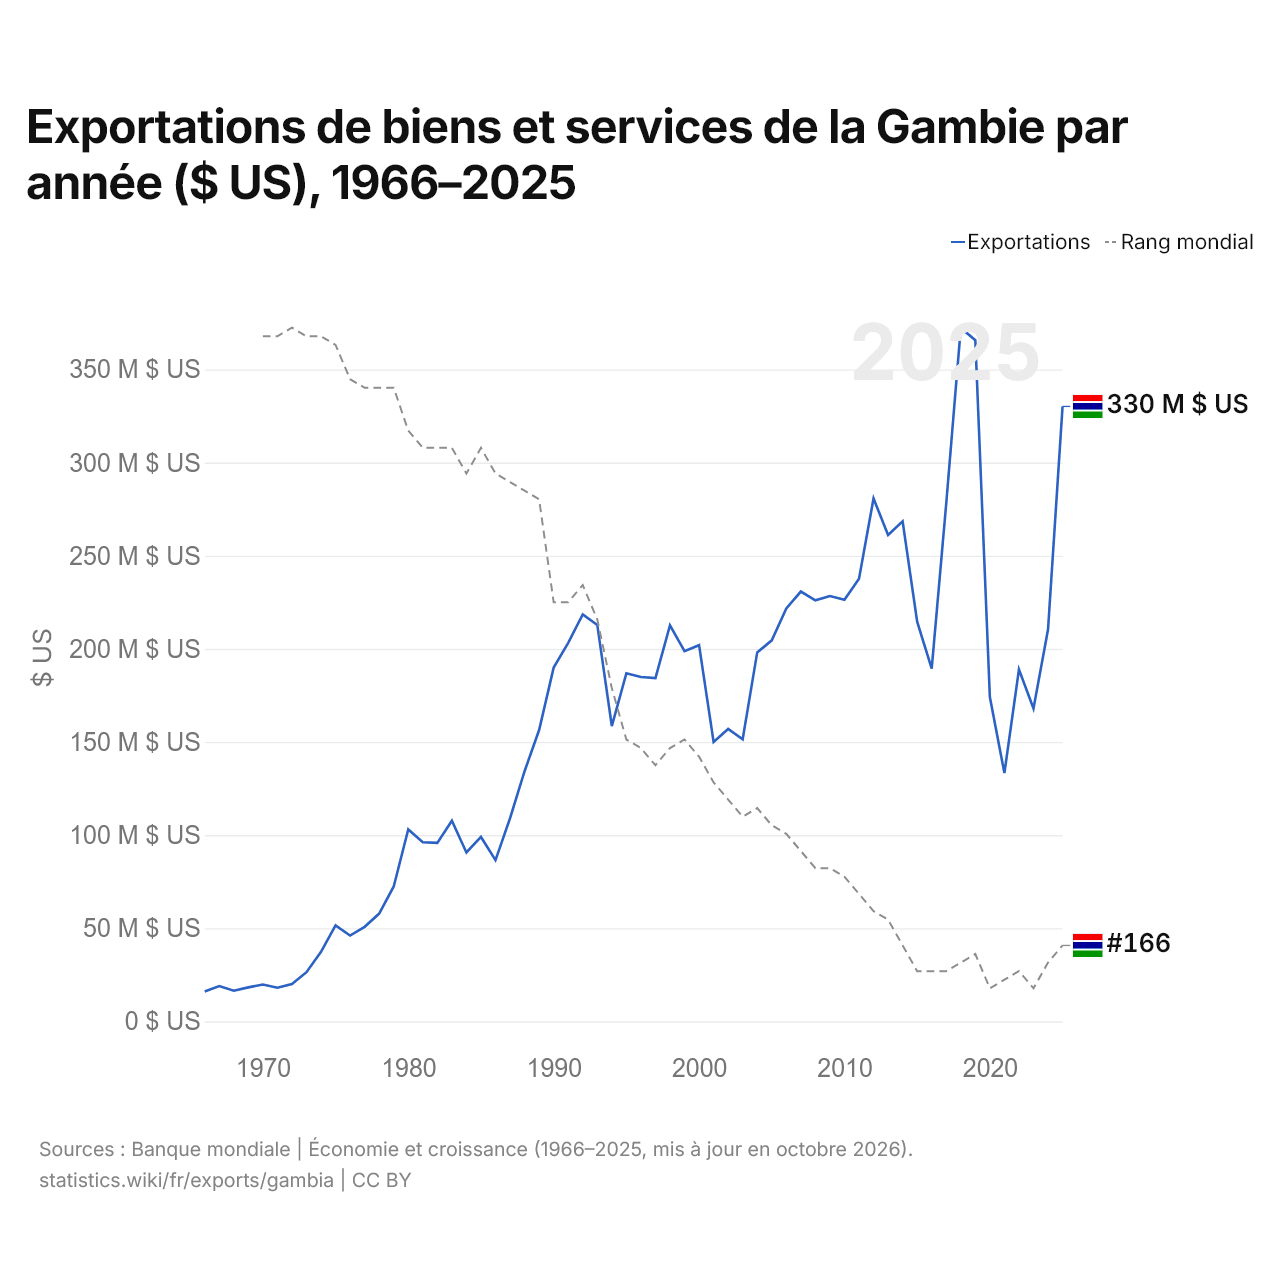
Exportations de biens et services de la Gambie par année ($ US), 1966–2025
| Année | $ US | Rang mondial |
|---|---|---|
| Exportations | Rang mondial | |
| 2025 | 330 185 893 $ US | #166 |
| 2024 | 210 399 923 $ US | #168 |
| 2023 | 168 026 282 $ US | #171 |
| 2022 | 188 942 456 $ US | #169 |
| 2021 | 133 283 633 $ US | #170 |
| 2020 | 174 106 926 $ US | #171 |
| 2019 | 365 730 558 $ US | #167 |
| 2018 | 372 362 229 $ US | #168 |
| 2017 | 278 118 327 $ US | #169 |
| 2016 | 189 367 461 $ US | #169 |
| 2015 | 214 593 793 $ US | #169 |
| 2014 | 268 476 271 $ US | #166 |
| 2013 | 261 079 179 $ US | #163 |
| 2012 | 280 760 744 $ US | #162 |
| 2011 | 237 665 945 $ US | #160 |
| 2010 | 226 367 643 $ US | #158 |
| 2009 | 228 340 999 $ US | #157 |
| 2008 | 226 068 893 $ US | #157 |
| 2007 | 230 768 306 $ US | #155 |
| 2006 | 221 729 530 $ US | #153 |
| 2005 | 204 546 332 $ US | #152 |
| 2004 | 198 101 351 $ US | #150 |
| 2003 | 151 438 769 $ US | #151 |
| 2002 | 157 033 587 $ US | #149 |
| 2001 | 149 998 489 $ US | #147 |
| 2000 | 201 981 400 $ US | #144 |
| 1999 | 198 771 164 $ US | #142 |
| 1998 | 212 639 015 $ US | #143 |
| 1997 | 184 290 826 $ US | #145 |
| 1996 | 184 904 931 $ US | #143 |
| 1995 | 186 876 569 $ US | #142 |
| 1994 | 158 552 464 $ US | #136 |
| 1993 | 212 861 270 $ US | #128 |
| 1992 | 218 509 709 $ US | #124 |
| 1991 | 203 220 124 $ US | #126 |
| 1990 | 189 941 810 $ US | #126 |
| 1989 | 156 436 608 $ US | #114 |
| 1988 | 134 311 372 $ US | #113 |
| 1987 | 109 029 388 $ US | #112 |
| 1986 | 86 556 334 $ US | #111 |
| 1985 | 99 014 529 $ US | #108 |
| 1984 | 90 665 413 $ US | #111 |
| 1983 | 107 766 541 $ US | #108 |
| 1982 | 95 784 688 $ US | #108 |
| 1981 | 96 172 689 $ US | #108 |
| 1980 | 103 029 780 $ US | #106 |
| 1979 | 72 405 656 $ US | #101 |
| 1978 | 57 875 483 $ US | #101 |
| 1977 | 50 729 192 $ US | #101 |
| 1976 | 46 062 023 $ US | #100 |
| 1975 | 51 495 207 $ US | #96 |
| 1974 | 37 334 615 $ US | #95 |
| 1973 | 26 392 897 $ US | #95 |
| 1972 | 19 980 333 $ US | #94 |
| 1971 | 18 037 835 $ US | #95 |
| 1970 | 19 763 504 $ US | #95 |
| 1969 | 18 244 685 $ US | - |
| 1968 | 16 460 090 $ US | - |
| 1967 | 18 921 503 $ US | - |
| 1966 | 15 991 781 $ US | - |
En 2025, les exportations de biens et services de la Gambie s'élevaient à 330 millions de dollars, contre 16 millions de dollars en 1966. Le maximum a été de 372 millions de dollars, en 2018. Elles se classaient au 166e rang mondial, en hausse par rapport au 168e rang en 2024. Leur meilleur rang a été le 94e, occupé pour la dernière fois en 1972.
En 2025, les exportations de biens et services de la Gambie étaient les 47es plus élevées de 50 pays situés en Afrique. Les importations de biens et services de la Gambie s'élevaient à 1,28 milliard de dollars en 2025, au 159e rang mondial. En 2025, les importations de la Gambie dépassaient ses exportations de 952 millions de dollars, soit un déficit commercial.
Exportations de biens de la Gambie par catégorie
Exportations de biens, 2024: 49,6 M $US
La première catégorie des exportations de biens de la Gambie est « cultures, plantes et fleurs (céréales, fruits, légumes, café, oléagineux) », avec 38,6 %, suivie de « pétrole, gaz, minerais et autres matières premières », avec 29,9 %.
Destinations des exportations de biens de la Gambie : les 10 premières
| Rang | Pays | Exportations de biens | Part | |
|---|---|---|---|---|
| 1 |
 Chine |
18,0 M $US | 36,3 % | |
| 2 |
 Mali |
12,5 M $US | 25,2 % | |
| 3 |
 Guinée-Bissau |
7,37 M $US | 14,8 % | vs Guinée-Bissau |
| 4 |
 Sénégal |
5,80 M $US | 11,7 % | vs Sénégal |
| 5 |
 Inde |
1,73 M $US | 3,49 % | |
| 6 |
 Royaume-Uni |
722 k $US | 1,45 % | |
| 7 |
 Pays-Bas |
665 k $US | 1,34 % | |
| 8 |
 Guinée |
454 k $US | 0,91 % | |
| 9 |
 Turquie |
429 k $US | 0,86 % | |
| 10 |
 Portugal |
285 k $US | 0,57 % | |
| Autres partenaires et non précisés | 1,65 M $US | 3,32 % |
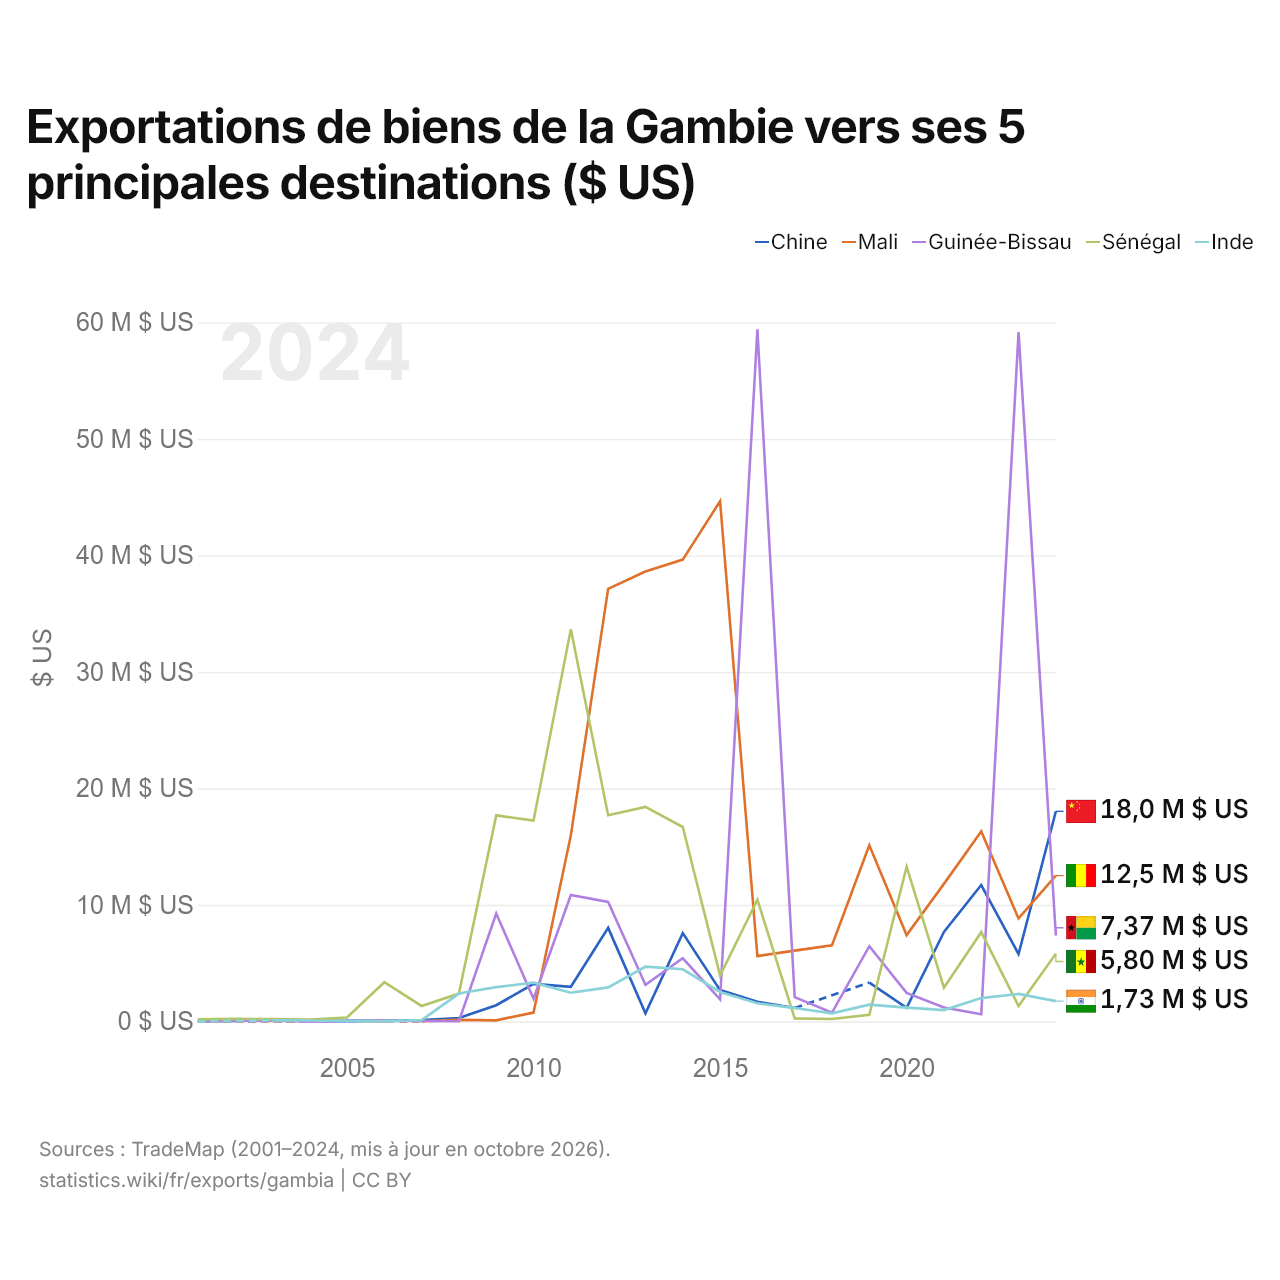
Exportations de biens de la Gambie vers ses 5 principales destinations ($ US)
| Année | $ US | ||||
|---|---|---|---|---|---|
| Chine | Mali | Guinée-Bissau | Sénégal | Inde | |
| 2024 | 18 028 000 $ US | 12 511 000 $ US | 7 367 000 $ US | 5 801 000 $ US | 1 732 000 $ US |
| 2023 | 5 779 000 $ US | 8 831 000 $ US | 59 162 000 $ US | 1 320 000 $ US | 2 352 000 $ US |
| 2022 | 11 706 000 $ US | 16 308 000 $ US | 610 000 $ US | 7 658 000 $ US | 1 997 000 $ US |
| 2021 | 7 674 000 $ US | 11 800 000 $ US | 1 181 000 $ US | 2 885 000 $ US | 965 000 $ US |
| 2020 | 1 163 000 $ US | 7 410 000 $ US | 2 442 000 $ US | 13 274 000 $ US | 1 170 000 $ US |
| 2019 | 3 332 000 $ US | 15 111 000 $ US | 6 450 000 $ US | 563 000 $ US | 1 430 000 $ US |
| 2018 | - | 6 535 000 $ US | 748 000 $ US | 198 000 $ US | 688 000 $ US |
| 2017 | 1 146 000 $ US | 6 076 000 $ US | 2 073 000 $ US | 248 000 $ US | 1 143 000 $ US |
| 2016 | 1 678 000 $ US | 5 596 000 $ US | 59 412 000 $ US | 10 442 000 $ US | 1 556 000 $ US |
| 2015 | 2 677 000 $ US | 44 650 000 $ US | 1 885 000 $ US | 3 926 000 $ US | 2 521 000 $ US |
| 2014 | 7 573 000 $ US | 39 636 000 $ US | 5 418 000 $ US | 16 687 000 $ US | 4 471 000 $ US |
| 2013 | 685 000 $ US | 38 624 000 $ US | 3 142 000 $ US | 18 409 000 $ US | 4 690 000 $ US |
| 2012 | 8 025 000 $ US | 37 127 000 $ US | 10 252 000 $ US | 17 689 000 $ US | 2 916 000 $ US |
| 2011 | 2 969 000 $ US | 15 972 000 $ US | 10 845 000 $ US | 33 664 000 $ US | 2 457 000 $ US |
| 2010 | 3 212 000 $ US | 753 000 $ US | 1 943 000 $ US | 17 233 000 $ US | 3 325 000 $ US |
| 2009 | 1 378 000 $ US | 89 000 $ US | 9 255 000 $ US | 17 683 000 $ US | 2 934 000 $ US |
| 2008 | 289 000 $ US | 121 000 $ US | 6 000 $ US | 2 380 000 $ US | 2 385 000 $ US |
| 2007 | 104 000 $ US | 6 000 $ US | 29 000 $ US | 1 321 000 $ US | 101 000 $ US |
| 2006 | 38 000 $ US | - | 39 000 $ US | 3 363 000 $ US | 14 000 $ US |
| 2005 | 33 000 $ US | - | 1 000 $ US | 326 000 $ US | 4 000 $ US |
| 2004 | 9 000 $ US | 3 000 $ US | 2 000 $ US | 148 000 $ US | 72 000 $ US |
| 2003 | - | - | 47 000 $ US | 189 000 $ US | 79 000 $ US |
| 2002 | 26 000 $ US | - | 75 000 $ US | 212 000 $ US | - |
| 2001 | 4 000 $ US | 11 000 $ US | 5 000 $ US | 166 000 $ US | 2 000 $ US |
Les exportations de biens s'élèvent à 18 millions de dollars vers la Chine (2024), 12,5 millions de dollars vers le Mali (2024), 7,37 millions de dollars vers la Guinée-Bissau (2024), 5,8 millions de dollars vers le Sénégal (2024) et 1,73 million de dollars vers l'Inde (2024). Le changement le plus récent dans leur ordre remonte à 2024, quand les exportations de la Gambie vers la Chine ont dépassé celles vers le Mali.
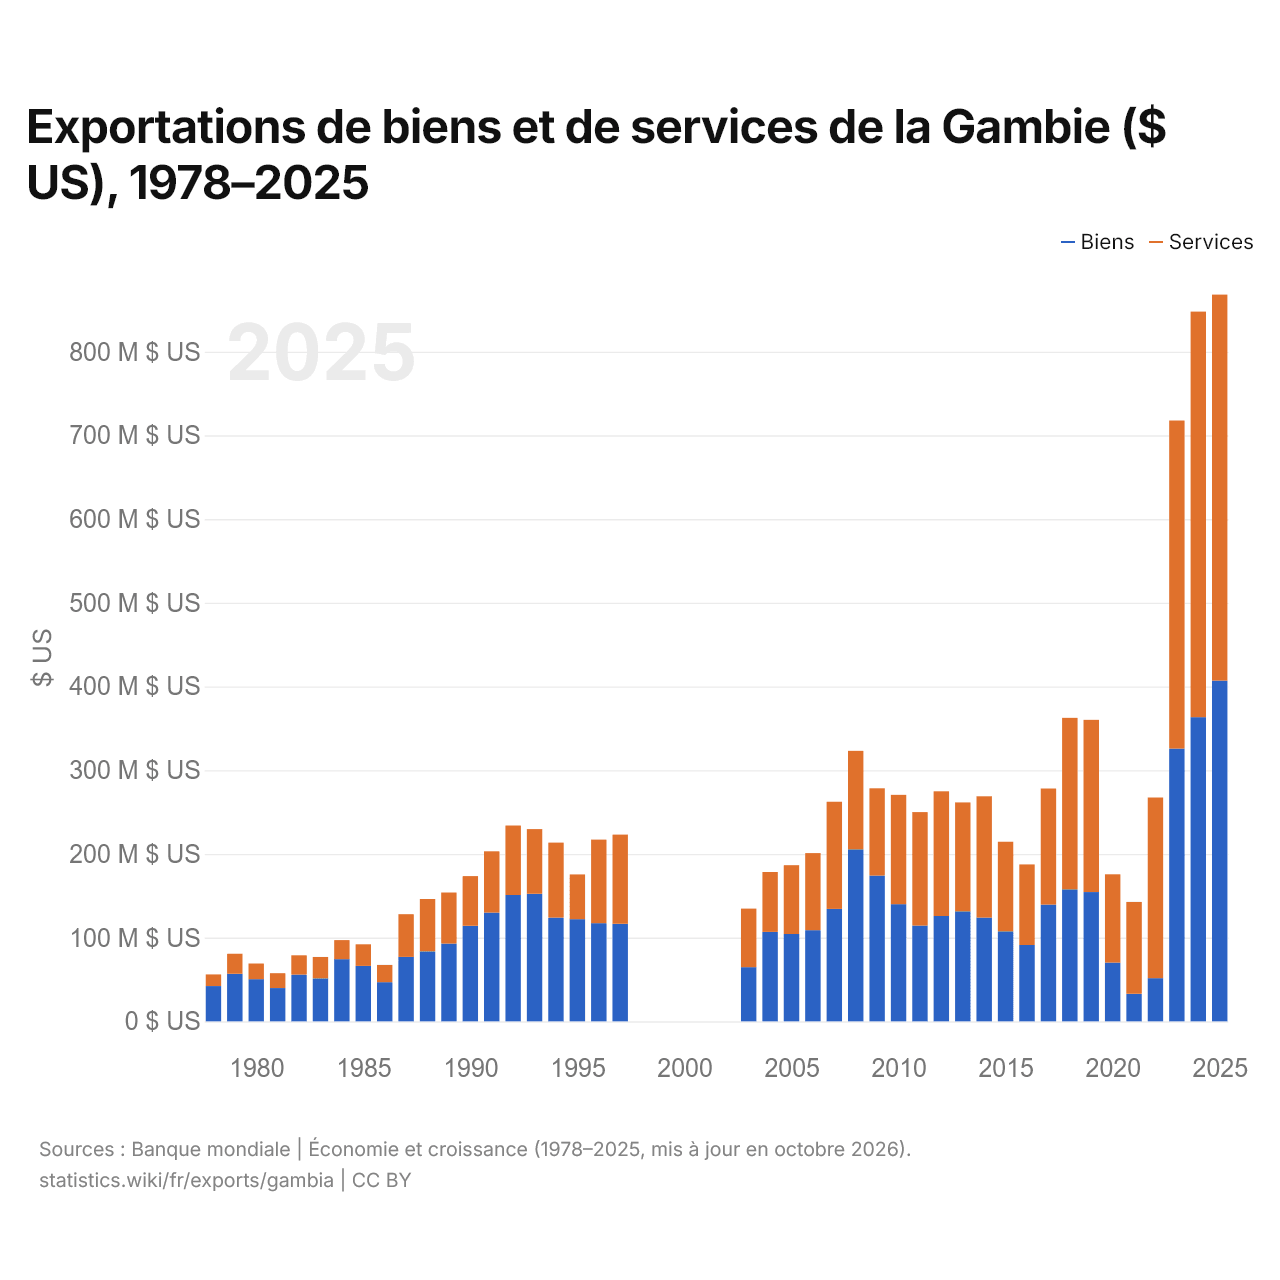
Exportations de biens et de services de la Gambie ($ US), 1978–2025
| Année | $ US | |
|---|---|---|
| Biens | Services | |
| 2025 | 407 062 473 $ US | 461 001 123 $ US |
| 2024 | 363 318 172 $ US | 484 534 594 $ US |
| 2023 | 325 898 548 $ US | 391 875 033 $ US |
| 2022 | 51 617 172 $ US | 215 760 195 $ US |
| 2021 | 32 853 476 $ US | 109 798 641 $ US |
| 2020 | 70 055 727 $ US | 105 626 034 $ US |
| 2019 | 154 459 514 $ US | 205 748 483 $ US |
| 2018 | 157 697 874 $ US | 204 815 333 $ US |
| 2017 | 139 399 657 $ US | 138 730 019 $ US |
| 2016 | 91 204 884 $ US | 96 227 622 $ US |
| 2015 | 107 519 932 $ US | 107 074 013 $ US |
| 2014 | 123 864 451 $ US | 144 994 367 $ US |
| 2013 | 131 408 761 $ US | 130 098 273 $ US |
| 2012 | 125 849 802 $ US | 148 895 738 $ US |
| 2011 | 114 484 164 $ US | 135 423 294 $ US |
| 2010 | 139 924 085 $ US | 130 644 790 $ US |
| 2009 | 174 206 723 $ US | 104 194 781 $ US |
| 2008 | 205 501 524 $ US | 117 578 078 $ US |
| 2007 | 134 326 683 $ US | 127 945 913 $ US |
| 2006 | 108 864 033 $ US | 92 079 930 $ US |
| 2005 | 104 324 892 $ US | 82 210 477 $ US |
| 2004 | 106 803 700 $ US | 71 558 576 $ US |
| 2003 | 64 763 795 $ US | 69 941 621 $ US |
| 2002 | - | - |
| 2001 | - | - |
| 2000 | - | - |
| 1999 | - | - |
| 1998 | - | - |
| 1997 | 116 517 704 $ US | 106 519 828 $ US |
| 1996 | 117 206 254 $ US | 99 894 118 $ US |
| 1995 | 122 116 268 $ US | 53 343 030 $ US |
| 1994 | 123 818 447 $ US | 89 632 700 $ US |
| 1993 | 152 428 798 $ US | 77 234 760 $ US |
| 1992 | 150 915 358 $ US | 83 039 981 $ US |
| 1991 | 129 907 443 $ US | 73 226 805 $ US |
| 1990 | 114 164 347 $ US | 59 321 039 $ US |
| 1989 | 92 932 326 $ US | 60 960 631 $ US |
| 1988 | 83 563 601 $ US | 62 585 497 $ US |
| 1987 | 76 943 627 $ US | 50 983 828 $ US |
| 1986 | 46 723 661 $ US | 20 662 902 $ US |
| 1985 | 66 232 244 $ US | 25 760 979 $ US |
| 1984 | 74 295 672 $ US | 22 706 106 $ US |
| 1983 | 51 315 585 $ US | 25 578 204 $ US |
| 1982 | 55 736 813 $ US | 23 144 688 $ US |
| 1981 | 39 765 443 $ US | 17 762 300 $ US |
| 1980 | 50 314 273 $ US | 18 710 239 $ US |
| 1979 | 56 888 954 $ US | 23 824 202 $ US |
| 1978 | 42 114 442 $ US | 13 942 258 $ US |
En 2025, les exportations de biens de la Gambie s'élevaient à 407 millions de dollars et celles de services à 461 millions de dollars ; les services représentaient 53,1 % du total, contre 24,9 % en 1978.
La Gambie dans le classement mondial des exportations, 2025
| Rang | Pays | Exportations | Part mondiale | |
|---|---|---|---|---|
| 163 |
 Haïti |
500 M $US | 0,001 % | |
| 164 |
 Samoa |
356 M $US | 0,001 % | |
| 165 |
Guinée-Bissau
|
351 M $US | 0,001 % | vs Guinée-Bissau |
| 166 |
 Gambie |
330 M $US | <0,001 % | |
| 167 |
 Vanuatu |
329 M $US (2024) | 0,001 % | |
| 168 |
 Timor oriental |
197 M $US (2024) | <0,001 % | |
| 169 |
 Burundi |
181 M $US (2023) | <0,001 % |
Exportations de biens et services de la Gambie, % du PIB, 1966–2025
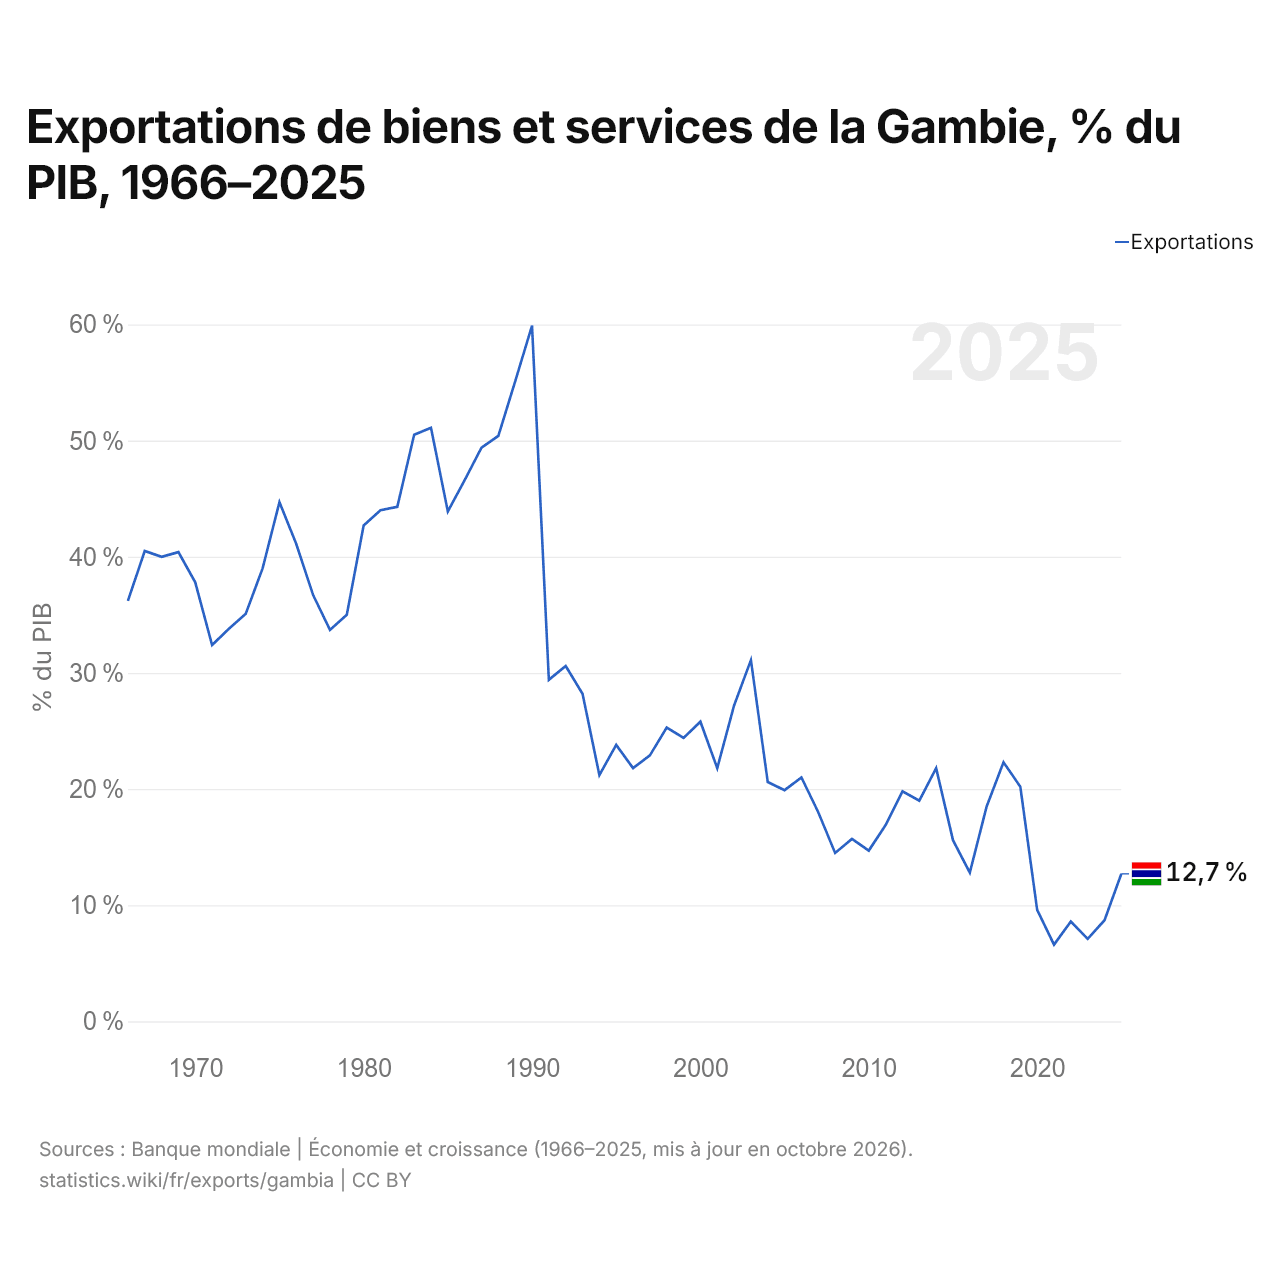
En 2025, les exportations de biens et services de la Gambie équivalaient à 12,7 % de son PIB, contre 36,2 % en 1966. La part la plus élevée a été de 59,9 %, en 1990.
Comparer les exportations de la Gambie avec celles d'autres pays
Sources :
- Banque mondiale | Économie et croissance (1966–2025, mis à jour en octobre 2026)
- TradeMap (2001–2024, mis à jour en octobre 2026)
Creative Commons Attribution (CC BY) : vous pouvez copier, partager, adapter et réutiliser ce contenu, y compris à des fins commerciales, à condition de citer statistics.wiki et d’indiquer les modifications apportées. Les sources citées ci-dessus peuvent avoir leurs propres conditions de licence.