
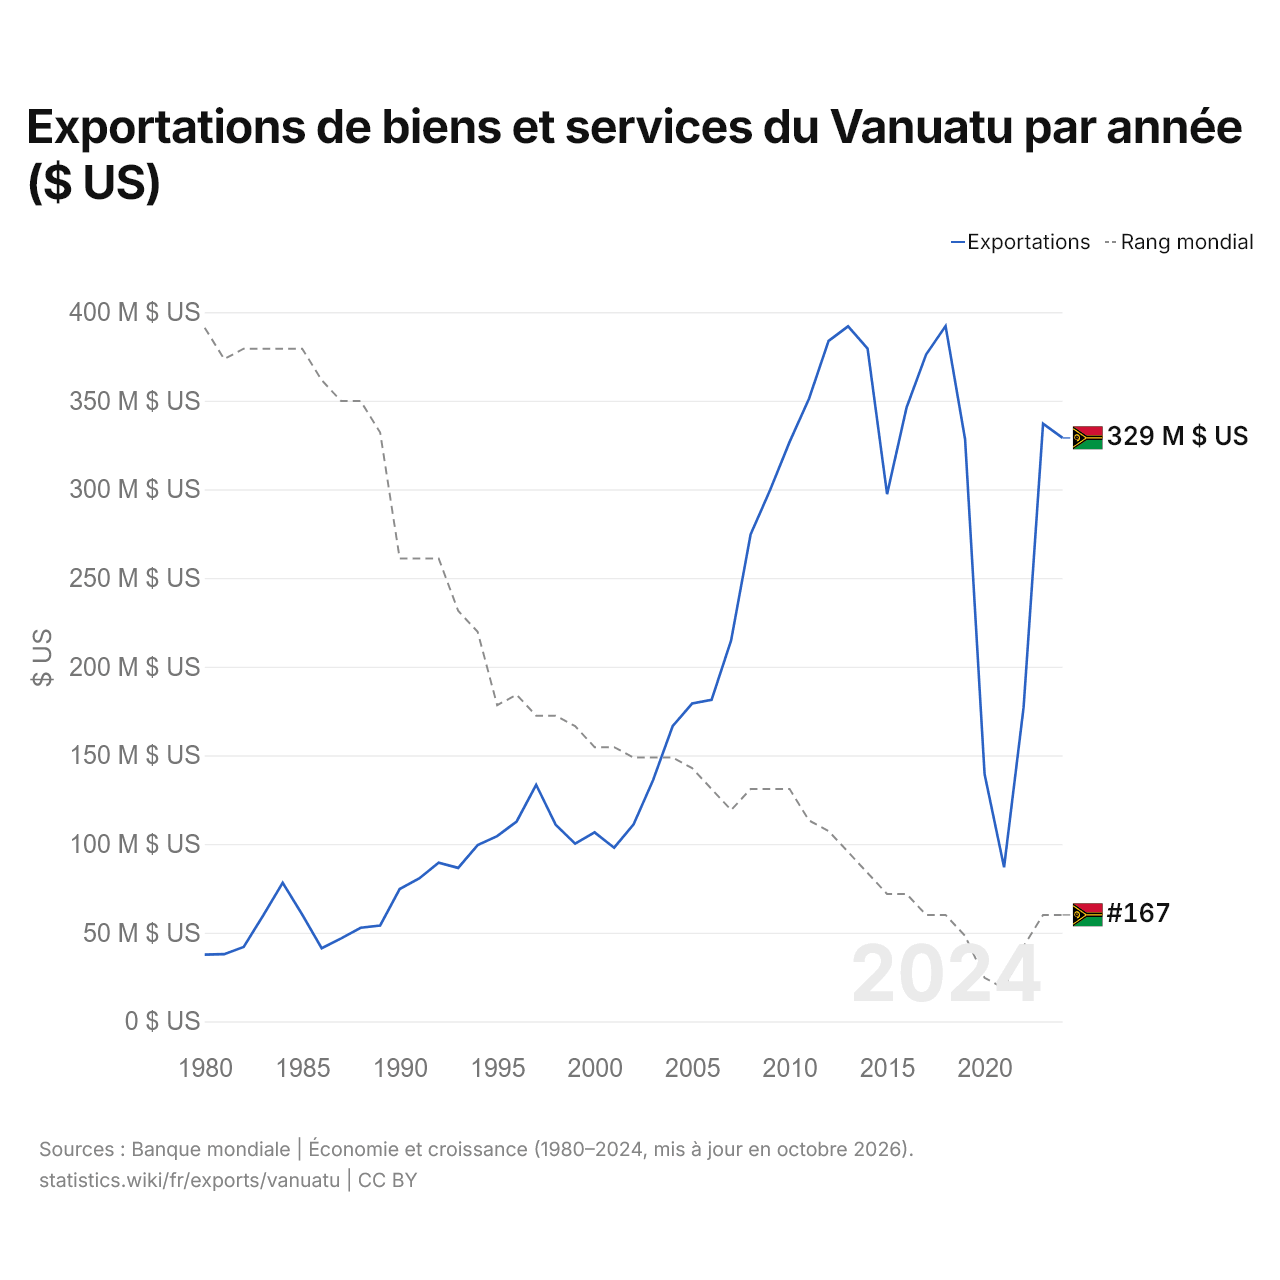
Exportations de biens et services du Vanuatu par année ($ US)
| Année | $ US | Rang mondial |
|---|---|---|
| Exportations | Rang mondial | |
| 2024 | 329 014 392 $ US | #167 |
| 2023 | 337 076 293 $ US | #167 |
| 2022 | 176 864 389 $ US | #170 |
| 2021 | 86 905 279 $ US | #174 |
| 2020 | 139 400 243 $ US | #173 |
| 2019 | 328 285 359 $ US | #169 |
| 2018 | 392 075 523 $ US | #167 |
| 2017 | 376 040 500 $ US | #167 |
| 2016 | 346 199 585 $ US | #165 |
| 2015 | 297 341 478 $ US | #165 |
| 2014 | 379 400 098 $ US | #163 |
| 2013 | 391 908 401 $ US | #161 |
| 2012 | 383 721 495 $ US | #159 |
| 2011 | 351 238 321 $ US | #158 |
| 2010 | 326 760 516 $ US | #155 |
| 2009 | 299 604 182 $ US | #155 |
| 2008 | 274 566 820 $ US | #155 |
| 2007 | 214 755 339 $ US | #157 |
| 2006 | 181 334 499 $ US | #155 |
| 2005 | 179 247 111 $ US | #153 |
| 2004 | 166 437 070 $ US | #152 |
| 2003 | 136 092 261 $ US | #152 |
| 2002 | 111 107 652 $ US | #152 |
| 2001 | 97 899 355 $ US | #151 |
| 2000 | 106 572 543 $ US | #151 |
| 1999 | 100 174 317 $ US | #149 |
| 1998 | 110 925 951 $ US | #148 |
| 1997 | 133 416 760 $ US | #148 |
| 1996 | 112 684 503 $ US | #146 |
| 1995 | 104 432 215 $ US | #147 |
| 1994 | 99 359 993 $ US | #140 |
| 1993 | 86 518 453 $ US | #138 |
| 1992 | 89 459 574 $ US | #133 |
| 1991 | 80 560 530 $ US | #133 |
| 1990 | 74 577 140 $ US | #133 |
| 1989 | 54 032 161 $ US | #121 |
| 1988 | 52 755 061 $ US | #118 |
| 1987 | 46 809 712 $ US | #118 |
| 1986 | 41 260 413 $ US | #116 |
| 1985 | 60 283 688 $ US | #113 |
| 1984 | 78 182 001 $ US | #113 |
| 1983 | 59 716 193 $ US | #113 |
| 1982 | 41 971 563 $ US | #113 |
| 1981 | 37 893 107 $ US | #114 |
| 1980 | 37 603 233 $ US | #111 |
Les exportations de biens et services du Vanuatu s'élèvent à 329 millions de dollars (2024), contre 37,6 millions de dollars en 1980. Le maximum a été de 392 millions de dollars, en 2018. Elles se classent au 167e rang mondial, un rang qu'elles occupent depuis 2023. Leur meilleur rang a été le 111e, occupé pour la dernière fois en 1980.
Les exportations de biens et services du Vanuatu sont les 7es plus élevées de 12 pays situés en Océanie. Les importations de biens et services du Vanuatu s'élèvent à 623 millions de dollars (2024), au 166e rang mondial. Les importations du Vanuatu dépassent ses exportations de 294 millions de dollars, soit un déficit commercial (2024).
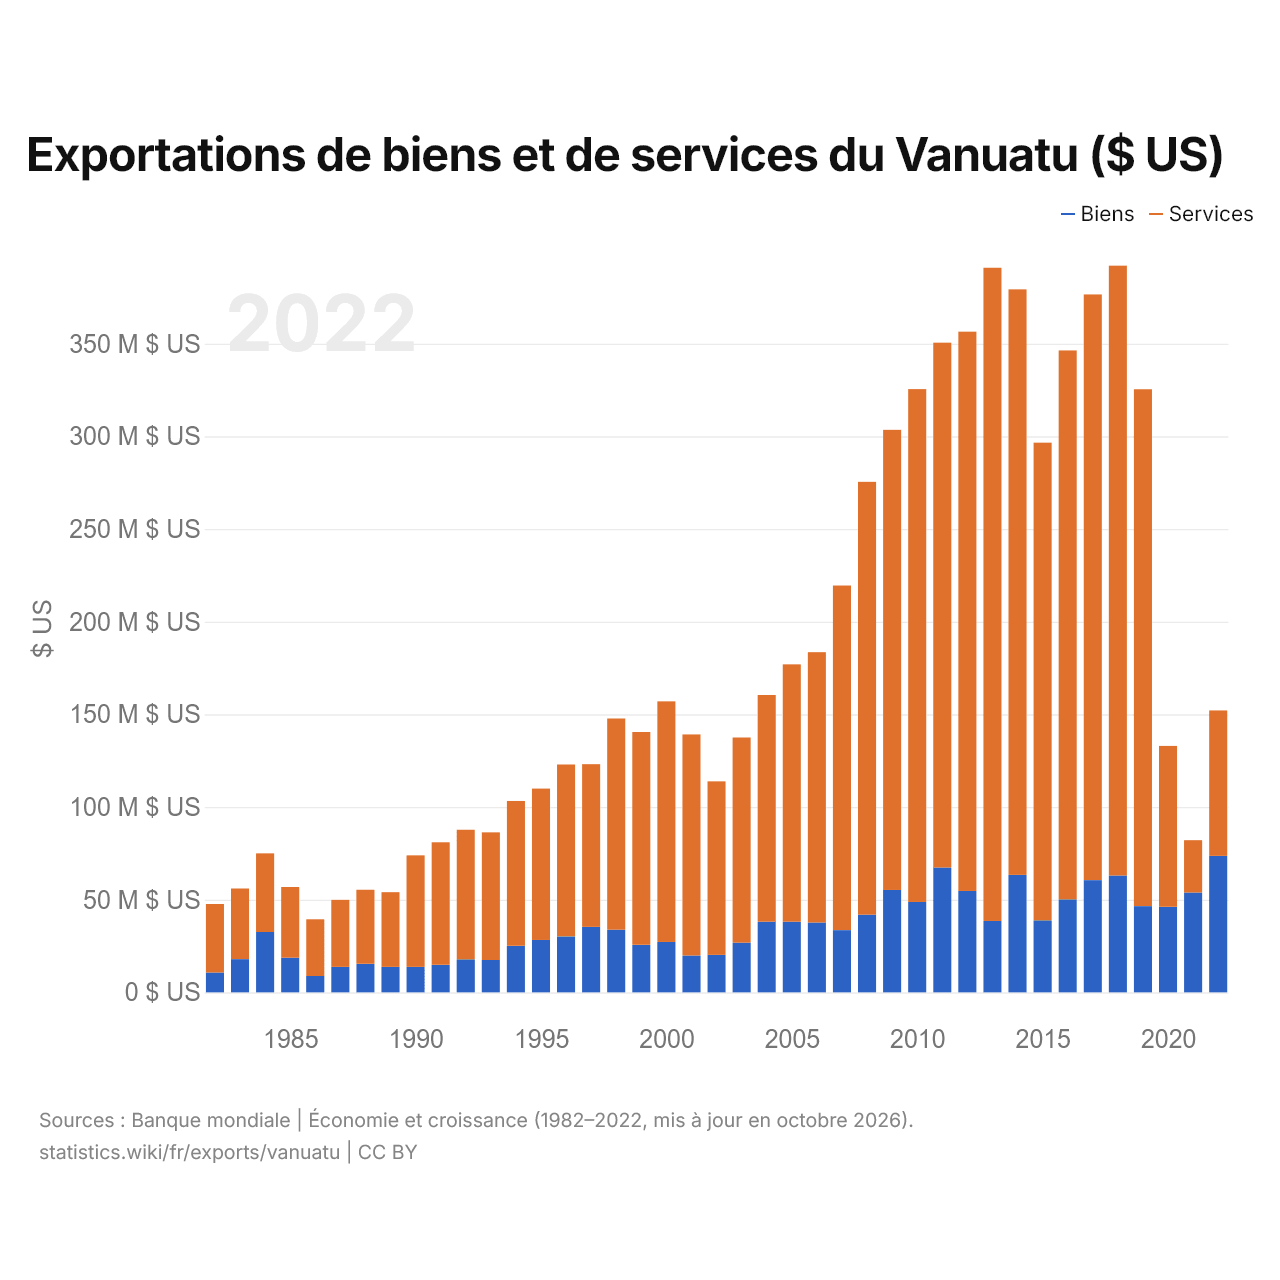
Exportations de biens et de services du Vanuatu ($ US)
| Année | $ US | |
|---|---|---|
| Biens | Services | |
| 2022 | 73 612 032 $ US | 78 474 765 $ US |
| 2021 | 53 885 596 $ US | 28 194 274 $ US |
| 2020 | 46 161 285 $ US | 86 781 765 $ US |
| 2019 | 46 519 425 $ US | 278 868 881 $ US |
| 2018 | 63 025 479 $ US | 329 043 967 $ US |
| 2017 | 60 531 904 $ US | 316 008 635 $ US |
| 2016 | 50 175 752 $ US | 296 161 327 $ US |
| 2015 | 38 847 652 $ US | 257 723 730 $ US |
| 2014 | 63 376 968 $ US | 315 916 503 $ US |
| 2013 | 38 530 334 $ US | 352 408 797 $ US |
| 2012 | 54 716 277 $ US | 301 763 161 $ US |
| 2011 | 67 318 471 $ US | 283 198 474 $ US |
| 2010 | 48 764 329 $ US | 276 699 115 $ US |
| 2009 | 55 235 401 $ US | 248 254 016 $ US |
| 2008 | 41 879 497 $ US | 233 559 374 $ US |
| 2007 | 33 547 266 $ US | 185 935 335 $ US |
| 2006 | 37 694 912 $ US | 145 818 570 $ US |
| 2005 | 38 113 245 $ US | 138 846 660 $ US |
| 2004 | 38 142 840 $ US | 122 279 568 $ US |
| 2003 | 26 836 552 $ US | 110 662 613 $ US |
| 2002 | 20 199 877 $ US | 93 612 335 $ US |
| 2001 | 19 888 958 $ US | 119 260 335 $ US |
| 2000 | 27 191 148 $ US | 129 805 584 $ US |
| 1999 | 25 658 442 $ US | 114 798 993 $ US |
| 1998 | 33 784 739 $ US | 113 954 066 $ US |
| 1997 | 35 320 104 $ US | 87 790 665 $ US |
| 1996 | 30 197 049 $ US | 92 745 875 $ US |
| 1995 | 28 279 003 $ US | 81 648 564 $ US |
| 1994 | 25 105 977 $ US | 78 137 370 $ US |
| 1993 | 17 429 652 $ US | 68 883 935 $ US |
| 1992 | 17 795 588 $ US | 69 931 409 $ US |
| 1991 | 14 856 833 $ US | 66 092 633 $ US |
| 1990 | 13 731 603 $ US | 60 168 751 $ US |
| 1989 | 13 739 051 $ US | 40 287 786 $ US |
| 1988 | 15 387 338 $ US | 39 968 033 $ US |
| 1987 | 13 733 166 $ US | 36 148 194 $ US |
| 1986 | 8 814 449 $ US | 30 581 895 $ US |
| 1985 | 18 667 530 $ US | 38 162 634 $ US |
| 1984 | 32 541 428 $ US | 42 425 517 $ US |
| 1983 | 17 923 336 $ US | 38 110 990 $ US |
| 1982 | 10 674 843 $ US | 36 992 958 $ US |
Les exportations de biens du Vanuatu s'élèvent à 73,6 millions de dollars (2022) et celles de services à 78,5 millions de dollars ; les services représentent 51,6 % du total, contre 77,6 % en 1982.
Le Vanuatu dans le classement mondial des exportations
| Rang | Pays | Exportations | Part mondiale | |
|---|---|---|---|---|
| 164 |
 Samoa |
356 M $US (2025) | 0,001 % | |
| 165 |
 Guinée-Bissau |
351 M $US (2025) | 0,001 % | |
| 166 |
 Gambie |
330 M $US (2025) | <0,001 % | |
| 167 |
 Vanuatu |
329 M $US | 0,001 % | |
| 168 |
 Timor oriental |
197 M $US | <0,001 % | |
| 169 |
 Burundi |
181 M $US (2023) | <0,001 % | |
| 170 |
 Comores |
169 M $US (2025) | <0,001 % |
Exportations de biens et services du Vanuatu, % du PIB
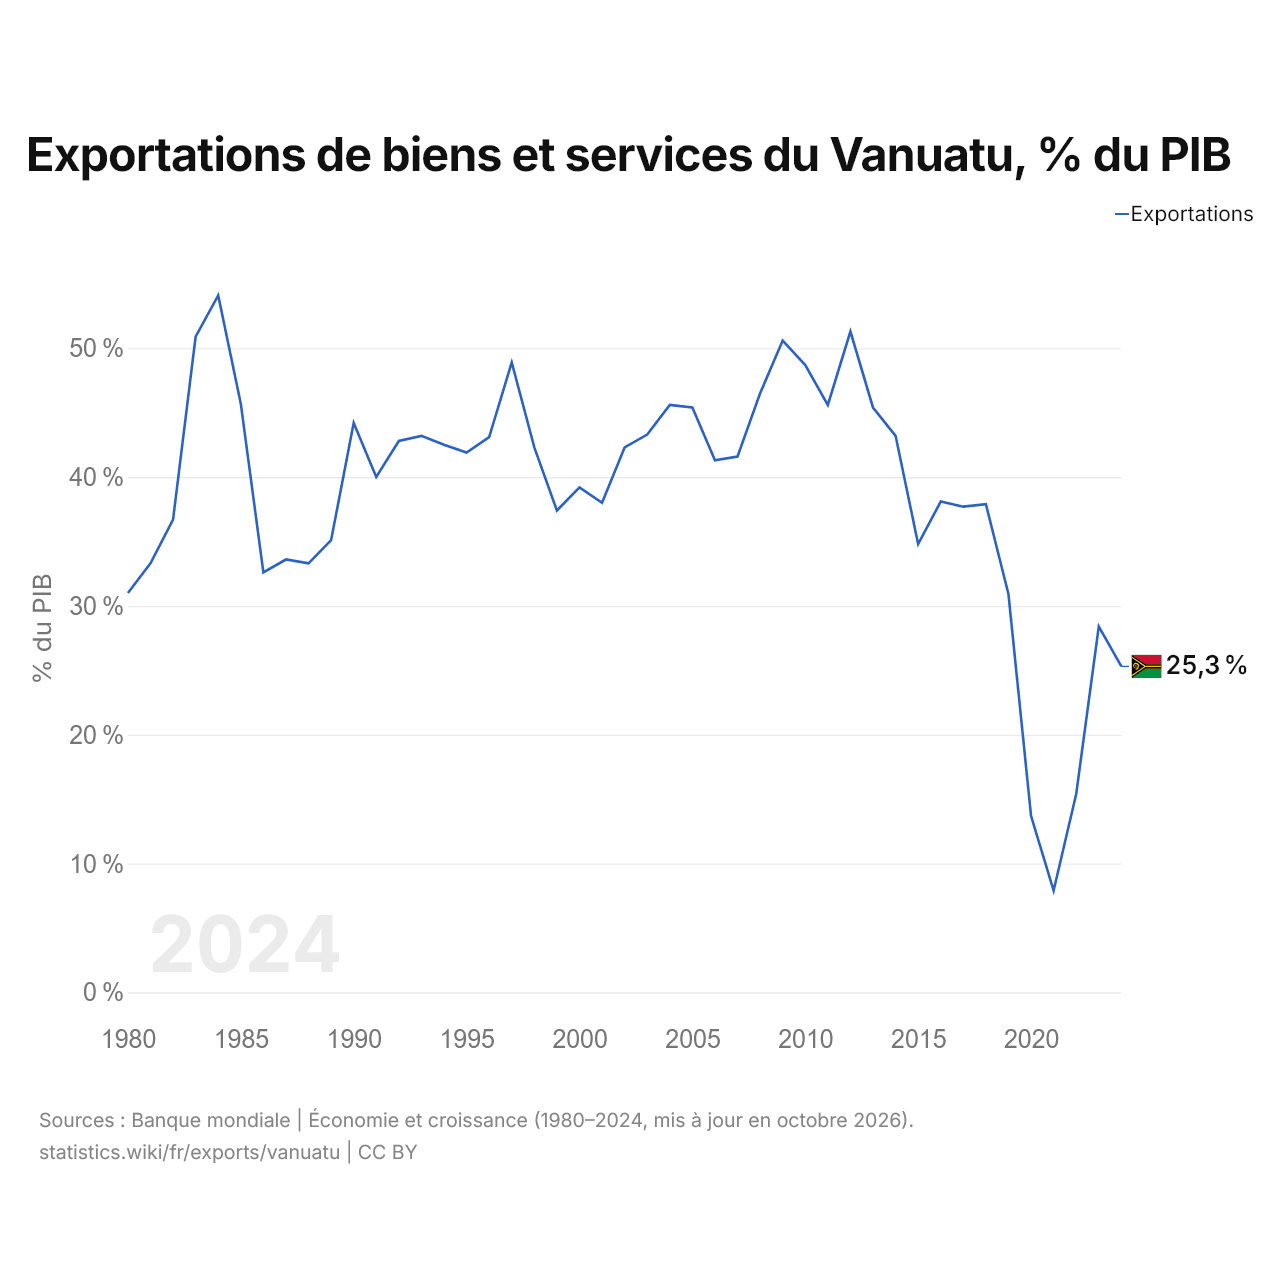
Les exportations de biens et services du Vanuatu équivalent à 25,3 % de son PIB (2024), contre 31,0 % en 1980. La part la plus élevée a été de 54,1 %, en 1984.
Comparer les exportations du Vanuatu avec celles d'autres pays
Sources :
- Banque mondiale | Économie et croissance (1980–2025, mis à jour en octobre 2026)
- TradeMap (2011, mis à jour en octobre 2026)
Creative Commons Attribution (CC BY) : vous pouvez copier, partager, adapter et réutiliser ce contenu, y compris à des fins commerciales, à condition de citer statistics.wiki et d’indiquer les modifications apportées. Les sources citées ci-dessus peuvent avoir leurs propres conditions de licence.