
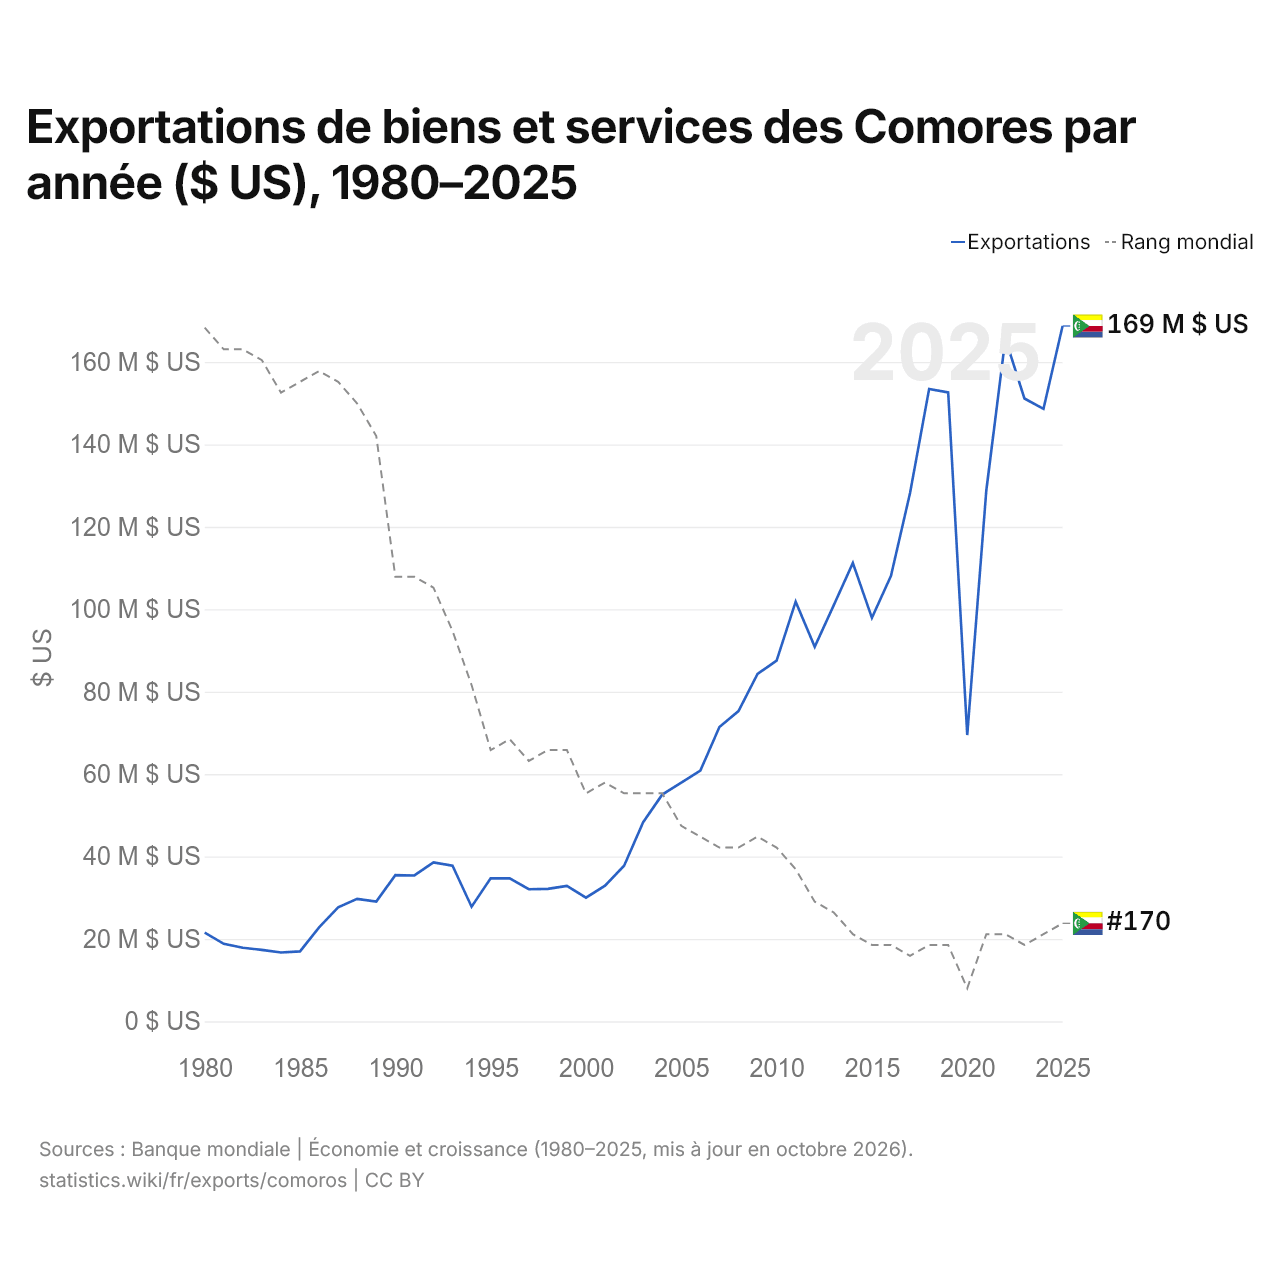
Exportations de biens et services des Comores par année ($ US), 1980–2025
| Année | $ US | Rang mondial |
|---|---|---|
| Exportations | Rang mondial | |
| 2025 | 168 747 748 $ US | #170 |
| 2024 | 148 632 461 $ US | #171 |
| 2023 | 151 154 559 $ US | #172 |
| 2022 | 165 662 687 $ US | #171 |
| 2021 | 128 826 173 $ US | #171 |
| 2020 | 69 481 186 $ US | #176 |
| 2019 | 152 645 349 $ US | #172 |
| 2018 | 153 462 136 $ US | #172 |
| 2017 | 128 229 515 $ US | #173 |
| 2016 | 108 098 875 $ US | #172 |
| 2015 | 97 918 676 $ US | #172 |
| 2014 | 111 239 530 $ US | #171 |
| 2013 | 101 000 279 $ US | #169 |
| 2012 | 90 876 030 $ US | #168 |
| 2011 | 101 862 720 $ US | #165 |
| 2010 | 87 519 204 $ US | #163 |
| 2009 | 84 304 815 $ US | #162 |
| 2008 | 75 279 515 $ US | #163 |
| 2007 | 71 414 386 $ US | #163 |
| 2006 | 60 836 975 $ US | #162 |
| 2005 | 57 910 786 $ US | #161 |
| 2004 | 55 020 144 $ US | #158 |
| 2003 | 48 318 613 $ US | #158 |
| 2002 | 37 762 291 $ US | #158 |
| 2001 | 32 936 852 $ US | #157 |
| 2000 | 29 999 667 $ US | #158 |
| 1999 | 32 862 828 $ US | #154 |
| 1998 | 32 158 005 $ US | #154 |
| 1997 | 32 059 601 $ US | #155 |
| 1996 | 34 682 056 $ US | #153 |
| 1995 | 34 707 164 $ US | #154 |
| 1994 | 27 814 977 $ US | #148 |
| 1993 | 37 795 697 $ US | #143 |
| 1992 | 38 576 009 $ US | #139 |
| 1991 | 35 397 521 $ US | #138 |
| 1990 | 35 483 754 $ US | #138 |
| 1989 | 29 042 899 $ US | #125 |
| 1988 | 29 725 529 $ US | #122 |
| 1987 | 27 682 319 $ US | #120 |
| 1986 | 22 808 892 $ US | #119 |
| 1985 | 16 961 673 $ US | #120 |
| 1984 | 16 709 105 $ US | #121 |
| 1983 | 17 335 520 $ US | #118 |
| 1982 | 17 862 941 $ US | #117 |
| 1981 | 18 815 568 $ US | #117 |
| 1980 | 21 507 084 $ US | #115 |
En 2025, les exportations de biens et services des Comores s'élevaient à 169 millions de dollars, contre 21,5 millions de dollars en 1980. Le minimum a été de 16,7 millions de dollars, en 1984. Elles se classaient au 170e rang mondial, en hausse par rapport au 171e rang en 2024. Leur meilleur rang a été le 115e, occupé pour la dernière fois en 1980.
En 2025, les exportations de biens et services des Comores étaient les 49es plus élevées de 50 pays situés en Afrique. Les importations de biens et services des Comores s'élevaient à 573 millions de dollars en 2025, au 167e rang mondial. En 2025, les importations des Comores dépassaient leurs exportations de 405 millions de dollars, soit un déficit commercial.
Exportations de biens des Comores par catégorie, 2025
Exportations de biens, 2025: 31,4 M $US
En 2025, la première catégorie des exportations de biens des Comores était « cultures, plantes et fleurs (céréales, fruits, légumes, café, oléagineux) », avec 80,4 %, suivie de « produits chimiques, pharmaceutiques et plastiques », avec 14,4 %.
Destinations des exportations de biens des Comores : les 10 premières, 2025
| Rang | Pays | Exportations de biens | Part | |
|---|---|---|---|---|
| 1 |
 Inde |
17,5 M $US | 55,5 % | |
| 2 |
 France |
4,62 M $US | 14,7 % | |
| 3 |
 EAU |
3,39 M $US | 10,8 % | |
| 4 |
 Pays-Bas |
1,65 M $US | 5,24 % | |
| 5 |
 Allemagne |
858 k $US | 2,73 % | |
| 6 |
 Pakistan |
585 k $US | 1,86 % | |
| 7 |
 Égypte |
404 k $US | 1,29 % | |
| 8 |
 Royaume-Uni |
303 k $US | 0,96 % | |
| 9 |
 Afrique du Sud |
251 k $US | 0,8 % | |
| 10 |
 États-Unis |
218 k $US | 0,69 % | |
| Autres partenaires et non précisés | 1,70 M $US | 5,4 % |
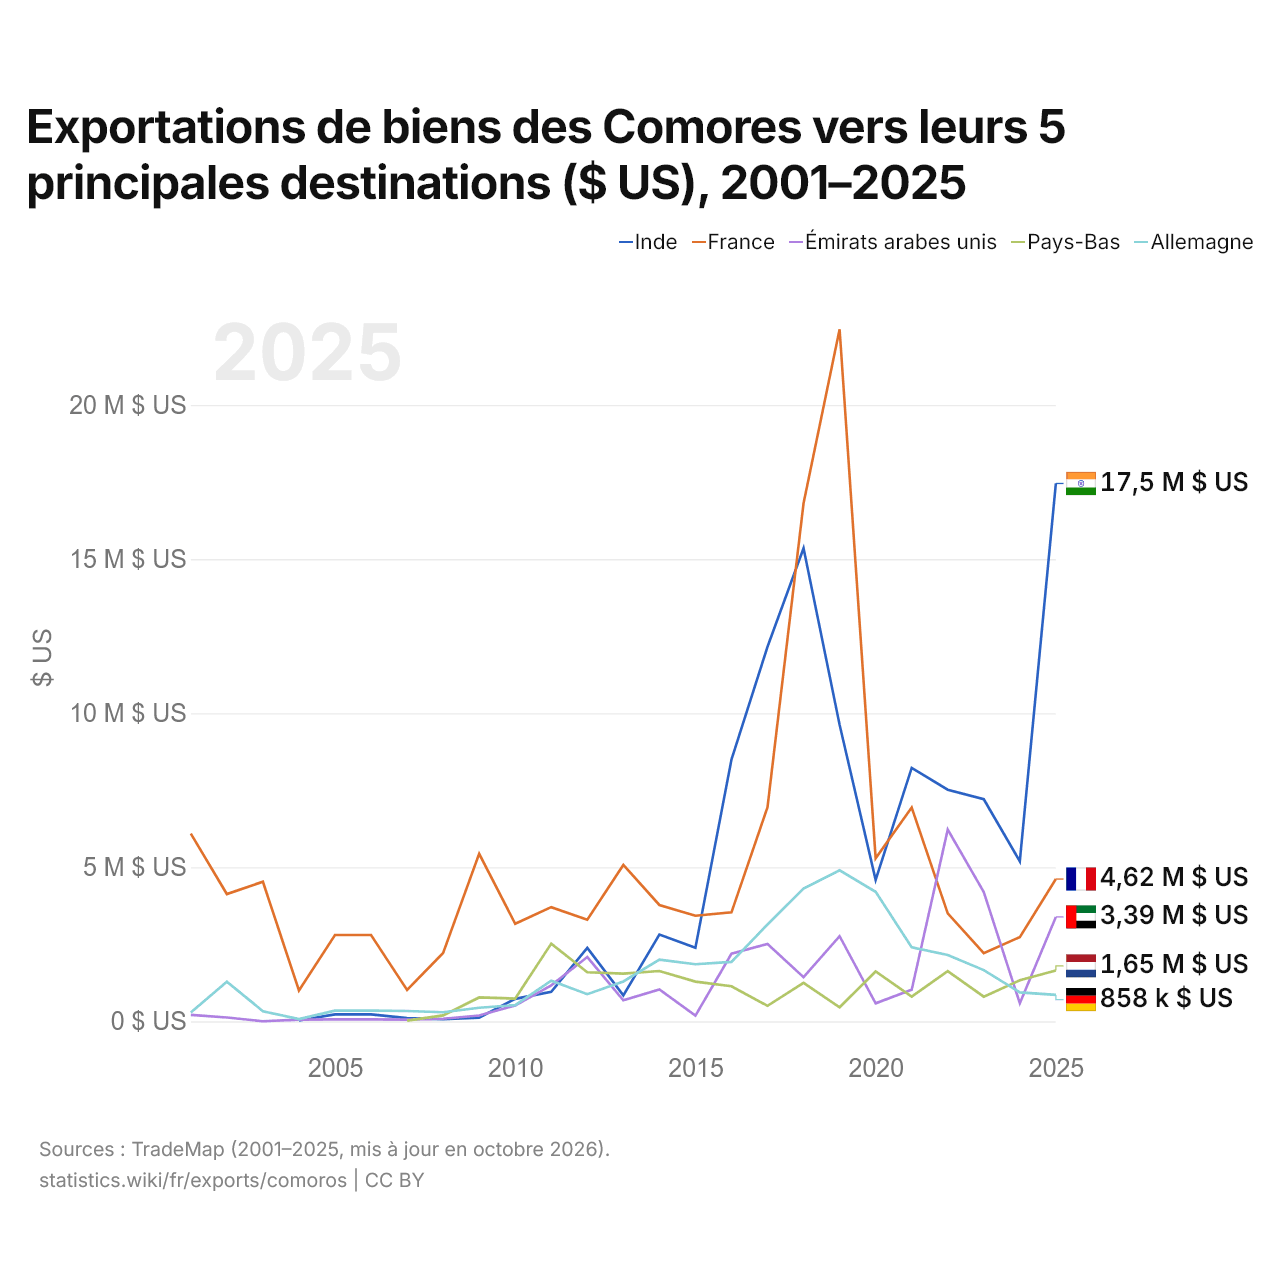
Exportations de biens des Comores vers leurs 5 principales destinations ($ US), 2001–2025
| Année | $ US | ||||
|---|---|---|---|---|---|
| Inde | France | Émirats arabes unis | Pays-Bas | Allemagne | |
| 2025 | 17 452 000 $ US | 4 618 000 $ US | 3 388 000 $ US | 1 647 000 $ US | 858 000 $ US |
| 2024 | 5 193 000 $ US | 2 733 000 $ US | 589 000 $ US | 1 331 000 $ US | 938 000 $ US |
| 2023 | 7 208 000 $ US | 2 209 000 $ US | 4 194 000 $ US | 802 000 $ US | 1 663 000 $ US |
| 2022 | 7 515 000 $ US | 3 504 000 $ US | 6 222 000 $ US | 1 631 000 $ US | 2 151 000 $ US |
| 2021 | 8 224 000 $ US | 6 940 000 $ US | 1 022 000 $ US | 801 000 $ US | 2 403 000 $ US |
| 2020 | 4 589 000 $ US | 5 293 000 $ US | 583 000 $ US | 1 619 000 $ US | 4 205 000 $ US |
| 2019 | 9 623 000 $ US | 22 456 000 $ US | 2 762 000 $ US | 456 000 $ US | 4 902 000 $ US |
| 2018 | 15 352 000 $ US | 16 809 000 $ US | 1 431 000 $ US | 1 246 000 $ US | 4 310 000 $ US |
| 2017 | 12 155 000 $ US | 6 949 000 $ US | 2 512 000 $ US | 503 000 $ US | 3 144 000 $ US |
| 2016 | 8 494 000 $ US | 3 537 000 $ US | 2 194 000 $ US | 1 139 000 $ US | 1 927 000 $ US |
| 2015 | 2 386 000 $ US | 3 427 000 $ US | 186 000 $ US | 1 290 000 $ US | 1 853 000 $ US |
| 2014 | 2 814 000 $ US | 3 774 000 $ US | 1 037 000 $ US | 1 634 000 $ US | 2 001 000 $ US |
| 2013 | 840 000 $ US | 5 075 000 $ US | 684 000 $ US | 1 549 000 $ US | 1 293 000 $ US |
| 2012 | 2 381 000 $ US | 3 299 000 $ US | 2 086 000 $ US | 1 594 000 $ US | 881 000 $ US |
| 2011 | 957 000 $ US | 3 705 000 $ US | 1 169 000 $ US | 2 522 000 $ US | 1 321 000 $ US |
| 2010 | 730 000 $ US | 3 165 000 $ US | 516 000 $ US | 740 000 $ US | 527 000 $ US |
| 2009 | 119 000 $ US | 5 435 000 $ US | 189 000 $ US | 775 000 $ US | 442 000 $ US |
| 2008 | 68 000 $ US | 2 219 000 $ US | 84 000 $ US | 194 000 $ US | 296 000 $ US |
| 2007 | 104 000 $ US | 1 017 000 $ US | 54 000 $ US | 24 000 $ US | 334 000 $ US |
| 2006 | 227 000 $ US | 2 802 000 $ US | 64 000 $ US | - | 349 000 $ US |
| 2005 | 227 000 $ US | 2 802 000 $ US | 64 000 $ US | - | 349 000 $ US |
| 2004 | 26 000 $ US | 1 002 000 $ US | 56 000 $ US | - | 75 000 $ US |
| 2003 | - | 4 531 000 $ US | 4 000 $ US | - | 329 000 $ US |
| 2002 | - | 4 130 000 $ US | 123 000 $ US | - | 1 283 000 $ US |
| 2001 | - | 6 092 000 $ US | 211 000 $ US | - | 285 000 $ US |
En 2025, les exportations de biens s'élevaient à 17,5 millions de dollars vers l'Inde, 4,62 millions de dollars vers la France, 3,39 millions de dollars vers les Émirats arabes unis, 1,65 million de dollars vers les Pays-Bas et 858 mille dollars vers l'Allemagne. Le premier rang des cinq destinations des Comores est occupé par l'Inde depuis 2021. Le changement le plus récent dans leur ordre remonte à 2025, quand les exportations des Comores vers les Émirats arabes unis ont dépassé celles vers les Pays-Bas.
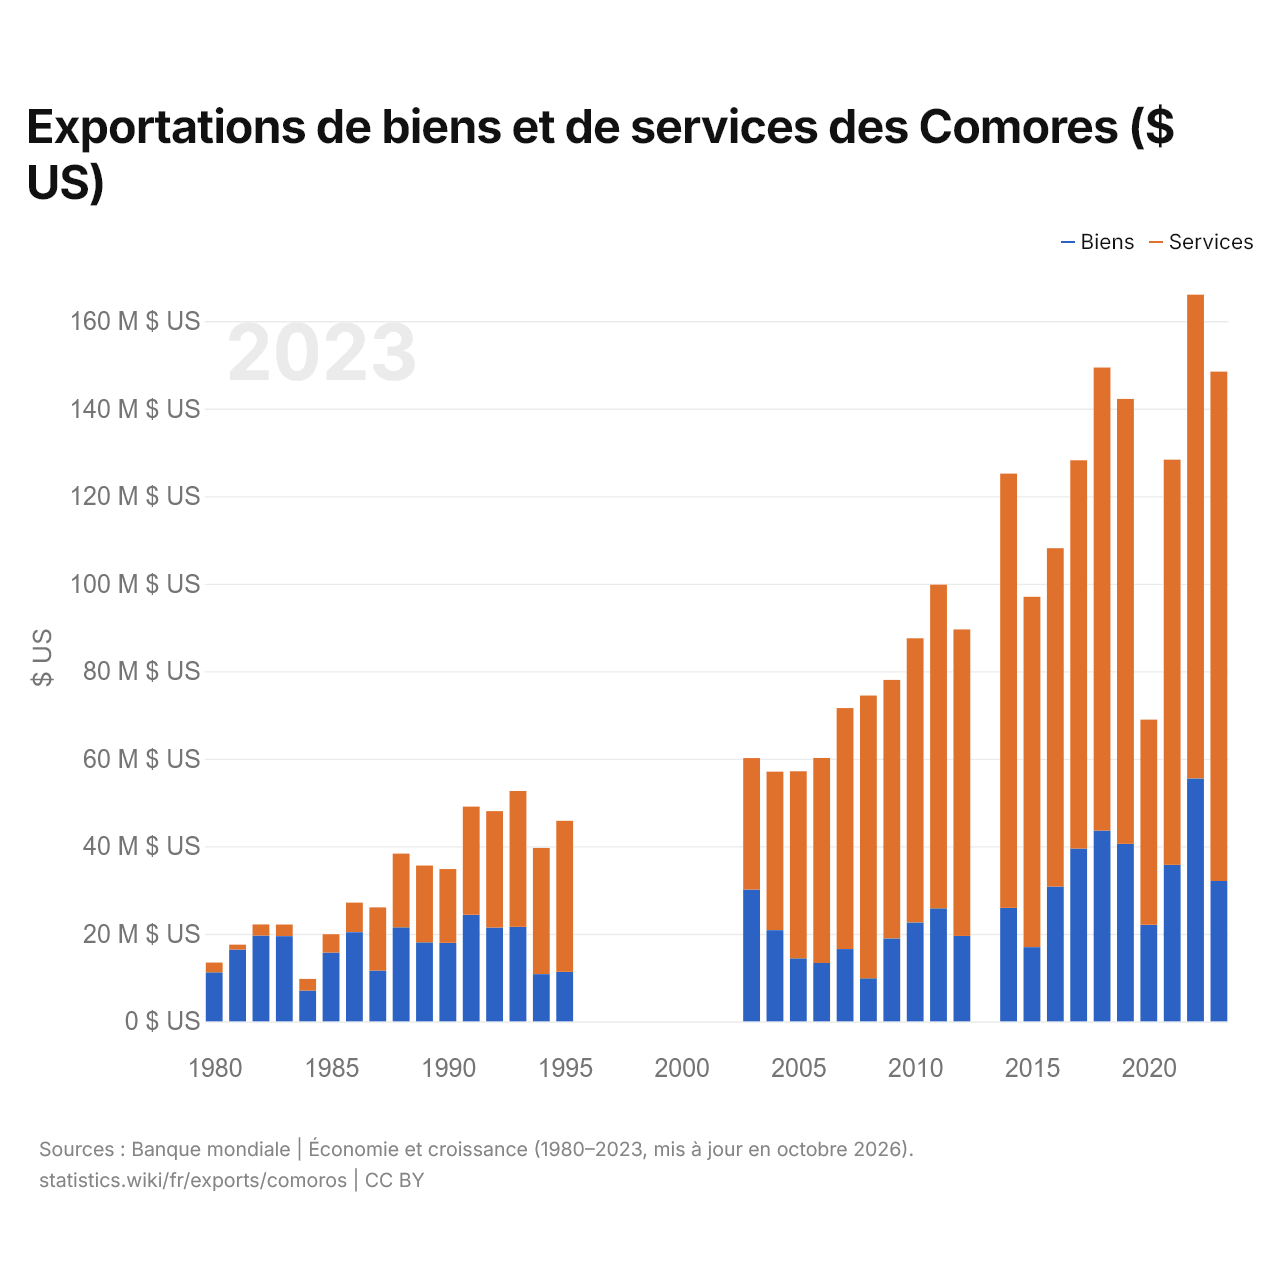
Exportations de biens et de services des Comores ($ US)
| Année | $ US | |
|---|---|---|
| Biens | Services | |
| 2023 | 32 067 622 $ US | 116 386 921 $ US |
| 2022 | 55 503 346 $ US | 110 528 509 $ US |
| 2021 | 35 752 053 $ US | 92 579 192 $ US |
| 2020 | 22 062 069 $ US | 46 875 201 $ US |
| 2019 | 40 559 137 $ US | 101 650 489 $ US |
| 2018 | 43 601 538 $ US | 105 787 458 $ US |
| 2017 | 39 468 627 $ US | 88 727 771 $ US |
| 2016 | 30 782 878 $ US | 77 317 432 $ US |
| 2015 | 16 956 645 $ US | 80 042 465 $ US |
| 2014 | 25 930 917 $ US | 99 219 876 $ US |
| 2013 | - | - |
| 2012 | 19 506 081 $ US | 70 035 455 $ US |
| 2011 | 25 827 376 $ US | 73 946 083 $ US |
| 2010 | 22 597 938 $ US | 64 920 289 $ US |
| 2009 | 18 950 565 $ US | 59 063 389 $ US |
| 2008 | 9 853 671 $ US | 64 576 022 $ US |
| 2007 | 16 516 179 $ US | 55 063 957 $ US |
| 2006 | 13 325 023 $ US | 46 853 113 $ US |
| 2005 | 14 391 427 $ US | 42 734 268 $ US |
| 2004 | 20 841 786 $ US | 36 209 538 $ US |
| 2003 | 30 078 883 $ US | 30 071 985 $ US |
| 2002 | - | - |
| 2001 | - | - |
| 2000 | - | - |
| 1999 | - | - |
| 1998 | - | - |
| 1997 | - | - |
| 1996 | - | - |
| 1995 | 11 315 399 $ US | 34 509 831 $ US |
| 1994 | 10 785 333 $ US | 28 837 738 $ US |
| 1993 | 21 581 424 $ US | 31 056 627 $ US |
| 1992 | 21 428 877 $ US | 26 593 418 $ US |
| 1991 | 24 356 221 $ US | 24 703 610 $ US |
| 1990 | 17 934 899 $ US | 16 862 404 $ US |
| 1989 | 18 049 840 $ US | 17 545 147 $ US |
| 1988 | 21 480 922 $ US | 16 847 650 $ US |
| 1987 | 11 599 353 $ US | 14 440 961 $ US |
| 1986 | 20 366 559 $ US | 6 757 089 $ US |
| 1985 | 15 688 050 $ US | 4 218 055 $ US |
| 1984 | 7 046 525 $ US | 2 647 882 $ US |
| 1983 | 19 469 231 $ US | 2 642 609 $ US |
| 1982 | 19 582 873 $ US | 2 556 272 $ US |
| 1981 | 16 417 083 $ US | 1 104 041 $ US |
| 1980 | 11 189 062 $ US | 2 238 759 $ US |
Les exportations de biens des Comores s'élèvent à 32,1 millions de dollars (2023) et celles de services à 116 millions de dollars ; les services représentent 78,4 % du total, contre 16,7 % en 1980.
Les Comores dans le classement mondial des exportations, 2025
| Rang | Pays | Exportations | Part mondiale | |
|---|---|---|---|---|
| 167 |
 Vanuatu |
329 M $US (2024) | 0,001 % | |
| 168 |
 Timor oriental |
197 M $US (2024) | <0,001 % | |
| 169 |
 Burundi |
181 M $US (2023) | <0,001 % | |
| 170 |
 Comores |
169 M $US | <0,001 % | |
| 171 |
 Sao Tomé |
130 M $US | <0,001 % | |
| 172 |
 Îles Marshall |
111 M $US | <0,001 % | |
| 173 |
 Tonga |
109 M $US (2024) | <0,001 % |
Exportations de biens et services des Comores, % du PIB, 1980–2025
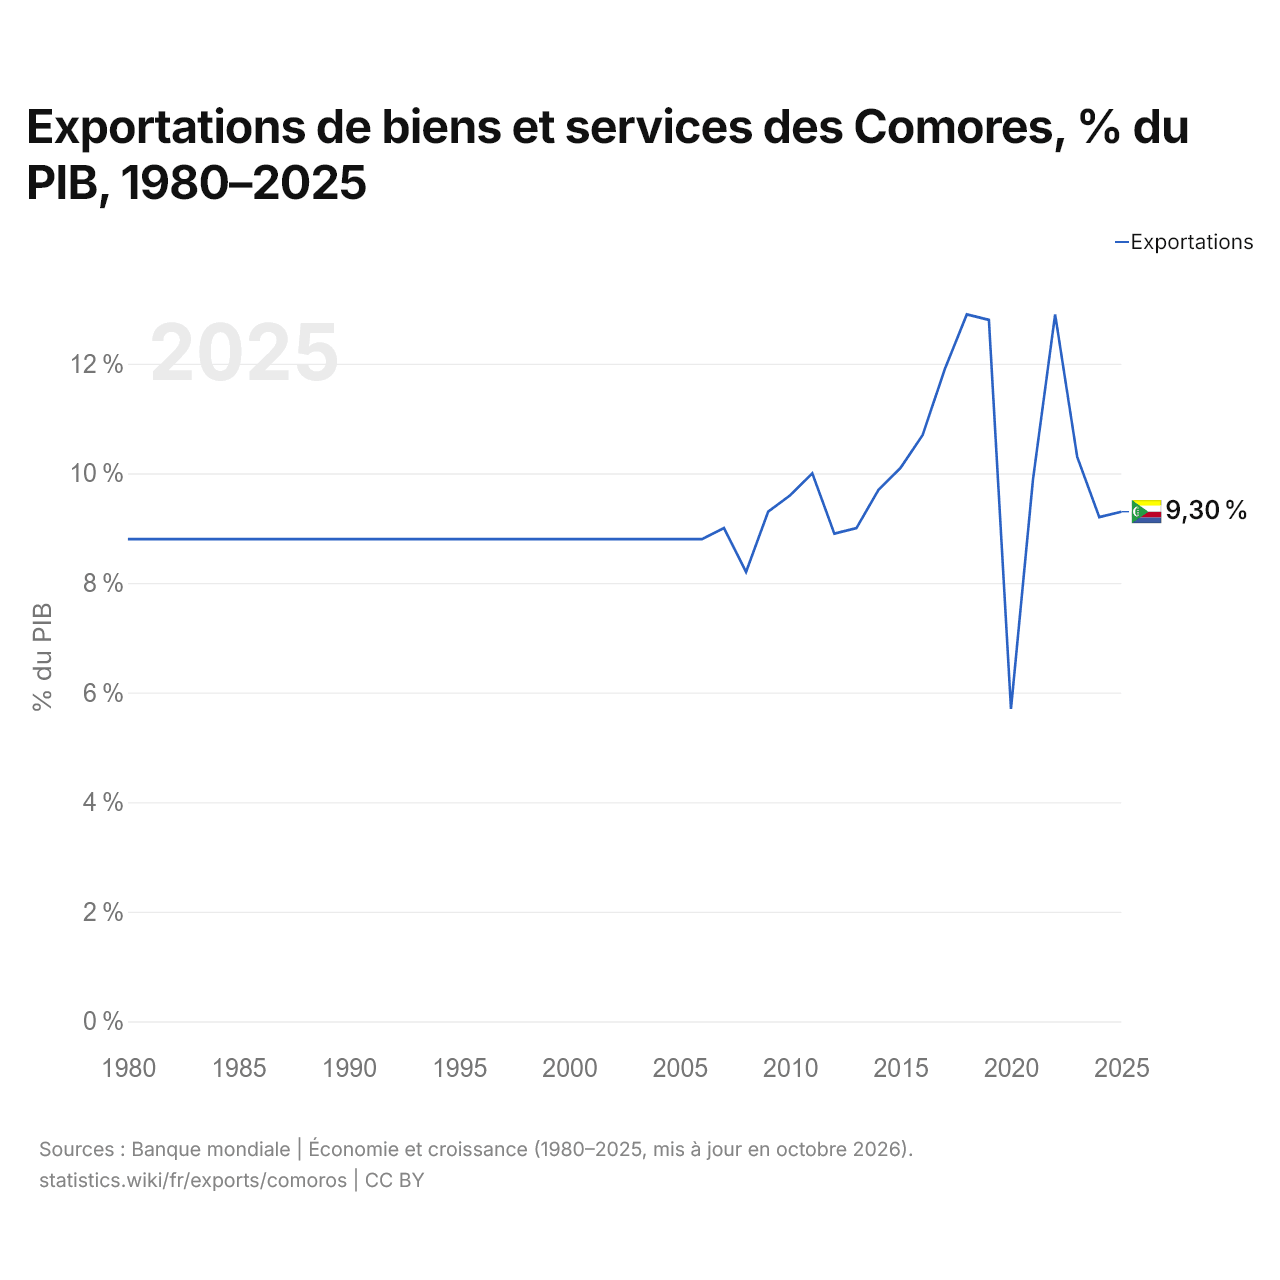
En 2025, les exportations de biens et services des Comores équivalaient à 9,3 % de leur PIB, contre 8,8 % en 1980. La part la plus élevée a été de 12,9 %, en 2022.
Comparer les exportations des Comores avec celles d'autres pays
Sources :
- Banque mondiale | Économie et croissance (1980–2025, mis à jour en octobre 2026)
- TradeMap (2001–2025, mis à jour en octobre 2026)
Creative Commons Attribution (CC BY) : vous pouvez copier, partager, adapter et réutiliser ce contenu, y compris à des fins commerciales, à condition de citer statistics.wiki et d’indiquer les modifications apportées. Les sources citées ci-dessus peuvent avoir leurs propres conditions de licence.