
Exportations de biens et services de Madagascar par année ($ US), 1960–2025
| Année | $ US | Rang mondial |
|---|---|---|
| Exportations | Rang mondial | |
| 2025 | 4 185 661 511 $ US | #136 |
| 2024 | 4 223 672 838 $ US | #137 |
| 2023 | 4 285 471 210 $ US | #135 |
| 2022 | 4 680 944 199 $ US | #134 |
| 2021 | 3 314 741 894 $ US | #138 |
| 2020 | 2 628 831 061 $ US | #136 |
| 2019 | 4 009 166 482 $ US | #133 |
| 2018 | 4 339 367 351 $ US | #130 |
| 2017 | 4 071 827 553 $ US | #128 |
| 2016 | 3 447 066 214 $ US | #126 |
| 2015 | 3 214 678 738 $ US | #129 |
| 2014 | 3 541 731 788 $ US | #131 |
| 2013 | 2 891 230 458 $ US | #136 |
| 2012 | 2 521 980 907 $ US | #139 |
| 2011 | 2 624 531 678 $ US | #135 |
| 2010 | 2 183 656 264 $ US | #133 |
| 2009 | 1 959 518 984 $ US | #129 |
| 2008 | 2 971 635 295 $ US | #125 |
| 2007 | 2 369 521 281 $ US | #124 |
| 2006 | 1 757 983 978 $ US | #126 |
| 2005 | 1 424 938 434 $ US | #127 |
| 2004 | 985 460 548 $ US | #132 |
| 2003 | 872 660 374 $ US | #129 |
| 2002 | 1 167 504 458 $ US | #117 |
| 2001 | 1 091 486 917 $ US | #115 |
| 2000 | 885 096 717 $ US | #117 |
| 1999 | 784 850 753 $ US | #120 |
| 1998 | 722 467 461 $ US | #122 |
| 1997 | 688 168 058 $ US | #124 |
| 1996 | 839 642 514 $ US | #114 |
| 1995 | 805 498 307 $ US | #116 |
| 1994 | 705 142 896 $ US | #110 |
| 1993 | 561 129 088 $ US | #110 |
| 1992 | 538 527 291 $ US | #107 |
| 1991 | 519 857 359 $ US | #110 |
| 1990 | 505 973 444 $ US | #111 |
| 1989 | 487 655 924 $ US | #99 |
| 1988 | 433 265 600 $ US | #98 |
| 1987 | 454 292 492 $ US | #98 |
| 1986 | 428 072 464 $ US | #96 |
| 1985 | 376 255 635 $ US | #95 |
| 1984 | 419 879 580 $ US | #93 |
| 1983 | 381 908 959 $ US | #93 |
| 1982 | 404 922 691 $ US | #92 |
| 1981 | 423 096 593 $ US | #94 |
| 1980 | 554 791 923 $ US | #90 |
| 1979 | 504 827 947 $ US | #84 |
| 1978 | 457 890 723 $ US | #80 |
| 1977 | 387 925 899 $ US | #81 |
| 1976 | 330 849 219 $ US | #80 |
| 1975 | 362 080 610 $ US | #78 |
| 1974 | 297 715 414 $ US | #79 |
| 1973 | 235 525 937 $ US | #76 |
| 1972 | 191 350 737 $ US | #76 |
| 1971 | 173 264 899 $ US | #75 |
| 1970 | 213 036 048 $ US | #71 |
| 1969 | 191 304 705 $ US | - |
| 1968 | 183 124 856 $ US | - |
| 1967 | 167 512 783 $ US | - |
| 1966 | 155 698 197 $ US | - |
| 1965 | 110 127 943 $ US | - |
| 1964 | 106 752 579 $ US | - |
| 1963 | 97 047 804 $ US | - |
| 1962 | 101 689 131 $ US | - |
| 1961 | 102 110 849 $ US | - |
| 1960 | 67 511 337 $ US | - |
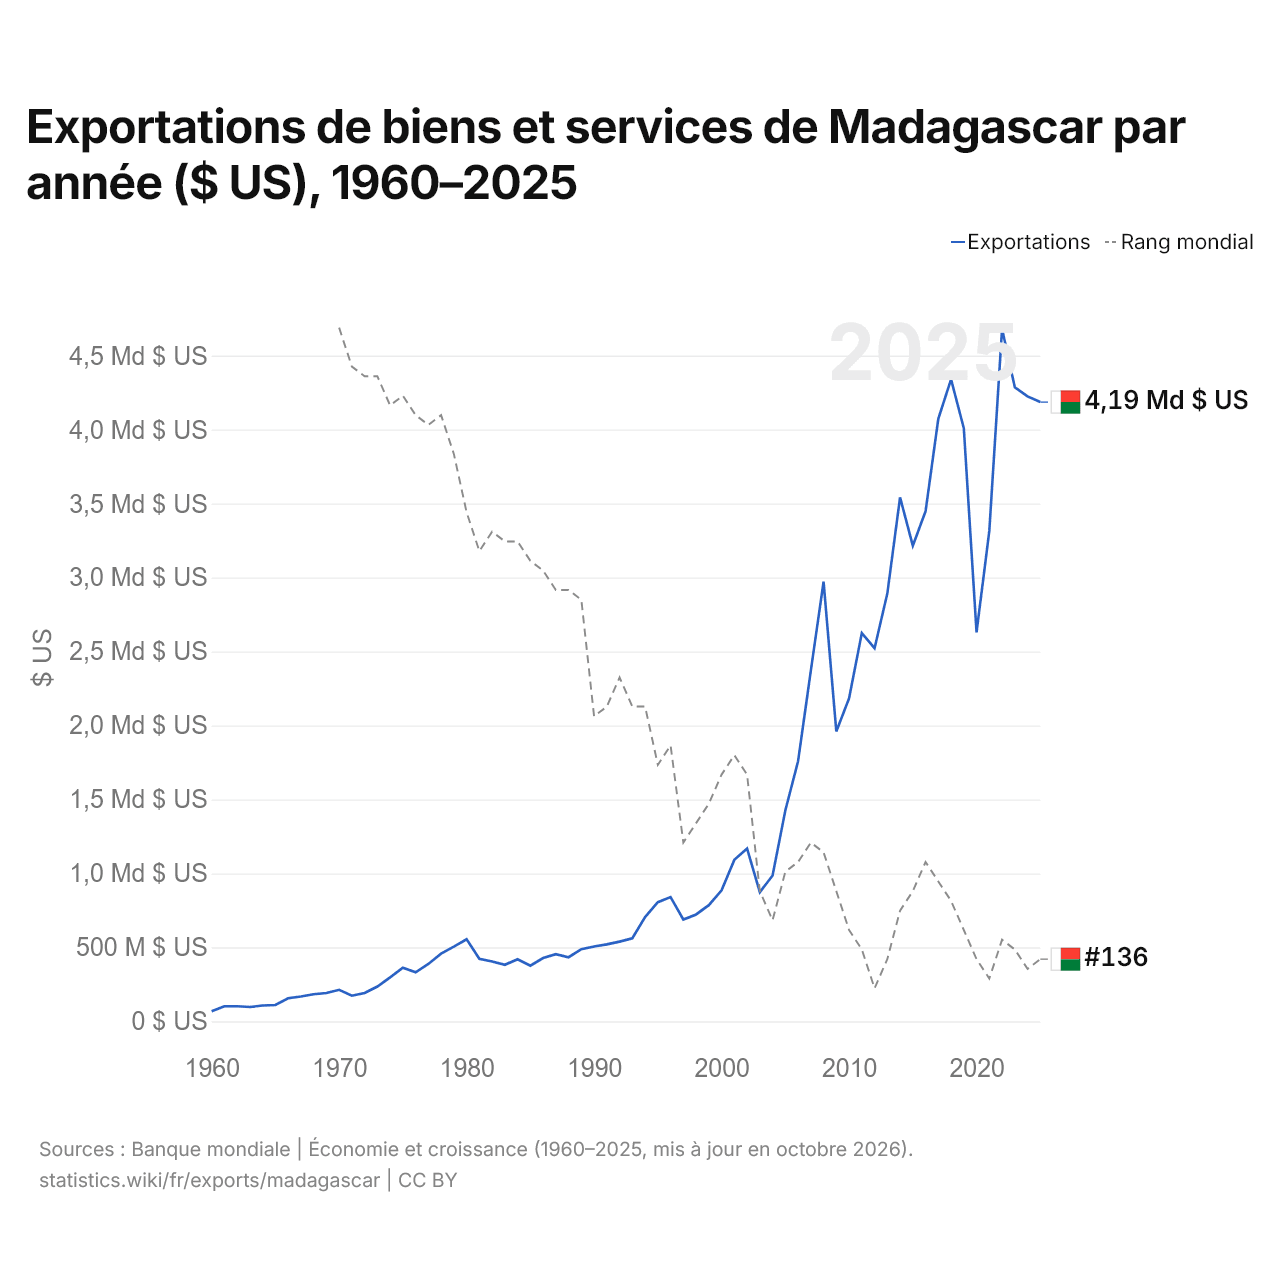
En 2025, les exportations de biens et services de Madagascar s'élevaient à 4,19 milliards de dollars, contre 67,5 millions de dollars en 1960. Le maximum a été de 4,68 milliards de dollars, en 2022. Elles se classaient au 136e rang mondial, en hausse par rapport au 137e rang en 2024. Leur meilleur rang a été le 71e, occupé pour la dernière fois en 1970.
En 2025, les exportations de biens et services de Madagascar étaient les 32es plus élevées de 50 pays situés en Afrique (à égalité avec le Bénin). Les importations de biens et services de Madagascar s'élevaient à 6,46 milliards de dollars en 2025, au 133e rang mondial. En 2025, les importations de Madagascar dépassaient ses exportations de 2,27 milliards de dollars, soit un déficit commercial.
Exportations de biens de Madagascar par catégorie, 2025
Exportations de biens, 2025: 2,48 Md $US
En 2025, la première catégorie des exportations de biens de Madagascar était « textiles, vêtements, chaussures, meubles et jouets », avec 24,1 %, suivie de « métaux communs (fer, acier, cuivre, aluminium) », avec 21,9 %.
Destinations des exportations de biens de Madagascar : les 10 premières, 2025
| Rang | Pays | Exportations de biens | Part | |
|---|---|---|---|---|
| 1 |
 France |
446 M $US | 18 % | vs France |
| 2 |
 États-Unis |
395 M $US | 15,9 % | |
| 3 |
 Chine |
203 M $US | 8,16 % | |
| 4 |
 Japon |
171 M $US | 6,88 % | |
| 5 |
 Pays-Bas |
153 M $US | 6,15 % | |
| 6 |
 Inde |
138 M $US | 5,55 % | |
| 7 |
 Corée du Sud |
129 M $US | 5,22 % | |
| 8 |
 Afrique du Sud |
94,9 M $US | 3,82 % | |
| 9 |
 Allemagne |
84,6 M $US | 3,41 % | |
| 10 |
 Indonésie |
76,0 M $US | 3,06 % | |
| Autres partenaires et non précisés | 591 M $US | 23,8 % |
Exportations de biens de Madagascar vers ses 5 principales destinations ($ US), 2001–2025
| Année | $ US | ||||
|---|---|---|---|---|---|
| France | États-Unis | Chine | Japon | Pays-Bas | |
| 2025 | 446 489 000 $ US | 395 286 000 $ US | 202 527 000 $ US | 170 598 000 $ US | 152 509 000 $ US |
| 2024 | 453 698 000 $ US | 395 049 000 $ US | 268 329 000 $ US | 176 549 000 $ US | 137 312 000 $ US |
| 2023 | 485 001 000 $ US | 417 296 000 $ US | 270 115 000 $ US | 271 609 000 $ US | 210 754 000 $ US |
| 2022 | 550 321 000 $ US | 578 578 000 $ US | 497 837 000 $ US | 421 697 000 $ US | 157 718 000 $ US |
| 2021 | 536 757 000 $ US | 506 939 000 $ US | 368 505 000 $ US | 239 799 000 $ US | 143 812 000 $ US |
| 2020 | 452 618 000 $ US | 440 544 000 $ US | 117 548 000 $ US | 61 715 000 $ US | 85 429 000 $ US |
| 2019 | 525 724 000 $ US | 513 514 000 $ US | 167 226 000 $ US | 165 973 000 $ US | 115 269 000 $ US |
| 2018 | 614 030 000 $ US | 624 259 000 $ US | 150 340 000 $ US | 212 345 000 $ US | 151 926 000 $ US |
| 2017 | 633 584 000 $ US | 527 454 000 $ US | 176 220 000 $ US | 106 493 000 $ US | 140 511 000 $ US |
| 2016 | 522 194 000 $ US | 283 072 000 $ US | 143 909 000 $ US | 115 239 000 $ US | 99 008 000 $ US |
| 2015 | 403 887 000 $ US | 218 137 000 $ US | 134 534 000 $ US | 107 767 000 $ US | 136 793 000 $ US |
| 2014 | 523 382 000 $ US | 185 693 000 $ US | 99 787 000 $ US | 143 090 000 $ US | 145 554 000 $ US |
| 2013 | 414 007 000 $ US | 126 914 000 $ US | 114 904 000 $ US | 74 242 000 $ US | 97 495 000 $ US |
| 2012 | 347 994 000 $ US | 52 685 000 $ US | 101 750 000 $ US | 6 113 000 $ US | 27 056 000 $ US |
| 2011 | 532 844 000 $ US | 48 196 000 $ US | 92 116 000 $ US | 10 482 000 $ US | 23 553 000 $ US |
| 2010 | 355 028 000 $ US | 44 203 000 $ US | 55 432 000 $ US | 5 150 000 $ US | 17 425 000 $ US |
| 2009 | 357 684 000 $ US | 196 023 000 $ US | 52 759 000 $ US | 7 405 000 $ US | 17 076 000 $ US |
| 2008 | 753 254 000 $ US | 365 313 000 $ US | 52 443 000 $ US | 7 081 000 $ US | 26 942 000 $ US |
| 2007 | 553 693 000 $ US | 232 895 000 $ US | 26 918 000 $ US | 8 708 000 $ US | 25 942 000 $ US |
| 2006 | 392 078 000 $ US | 148 287 000 $ US | 21 998 000 $ US | 13 522 000 $ US | 16 096 000 $ US |
| 2005 | 292 073 000 $ US | 188 154 000 $ US | 34 781 000 $ US | 17 876 000 $ US | 14 218 000 $ US |
| 2004 | 322 515 000 $ US | 339 631 000 $ US | 10 472 000 $ US | 15 239 000 $ US | 11 311 000 $ US |
| 2003 | 416 543 000 $ US | 251 465 000 $ US | 7 286 000 $ US | 14 491 000 $ US | 11 283 000 $ US |
| 2002 | 270 156 000 $ US | 128 275 000 $ US | 6 526 000 $ US | 24 432 000 $ US | 8 583 000 $ US |
| 2001 | 356 438 000 $ US | 201 371 000 $ US | 6 445 000 $ US | 21 219 000 $ US | 22 945 000 $ US |
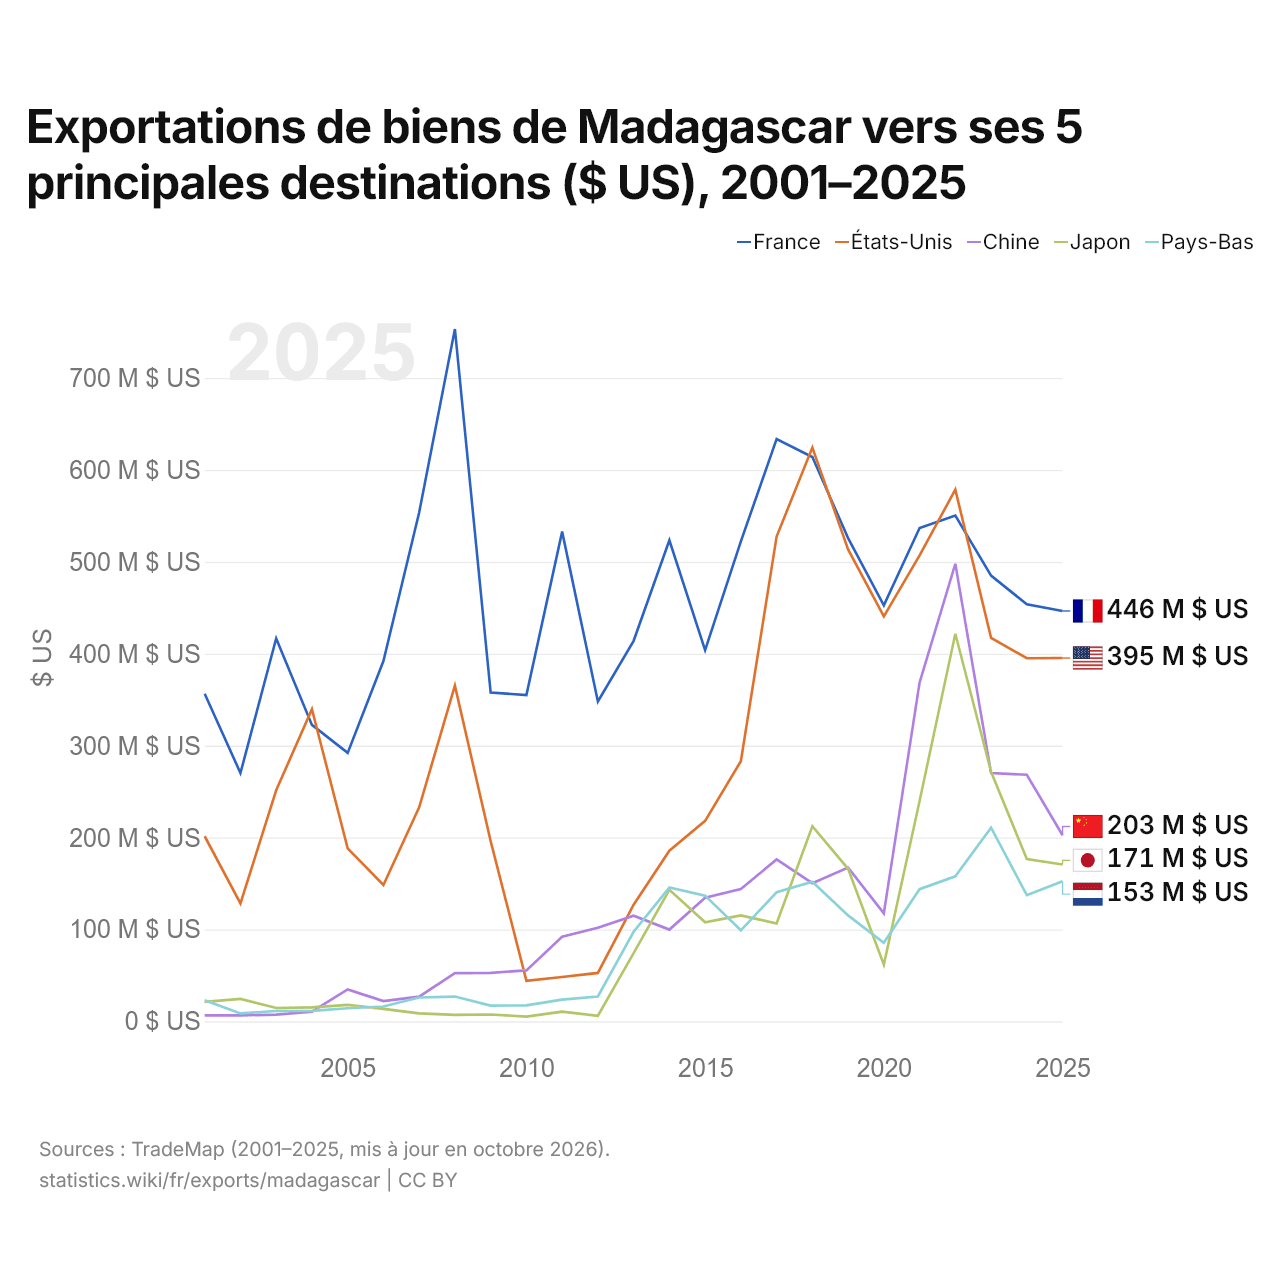
En 2025, les exportations de biens s'élevaient à 446 millions de dollars vers la France, 395 millions de dollars vers les États-Unis, 203 millions de dollars vers la Chine, 171 millions de dollars vers le Japon et 153 millions de dollars vers les Pays-Bas. Le premier rang des cinq destinations de Madagascar est occupé par la France depuis 2023. Le changement le plus récent dans leur ordre remonte à 2024, quand les exportations de Madagascar vers la Chine ont dépassé celles vers le Japon.
Exportations de biens et de services de Madagascar ($ US), 1974–2025
| Année | $ US | |
|---|---|---|
| Biens | Services | |
| 2025 | 2 484 033 468 $ US | 1 661 436 626 $ US |
| 2024 | 2 574 973 608 $ US | 1 534 146 768 $ US |
| 2023 | 3 093 864 891 $ US | 1 253 519 621 $ US |
| 2022 | 3 547 068 018 $ US | 1 141 938 241 $ US |
| 2021 | 2 707 724 600 $ US | 654 219 361 $ US |
| 2020 | 1 948 329 538 $ US | 640 899 304 $ US |
| 2019 | 2 612 087 659 $ US | 1 469 489 431 $ US |
| 2018 | 3 035 724 609 $ US | 1 371 771 523 $ US |
| 2017 | 2 804 375 509 $ US | 1 342 695 242 $ US |
| 2016 | 2 160 447 684 $ US | 1 229 965 913 $ US |
| 2015 | 2 046 513 285 $ US | 1 107 108 609 $ US |
| 2014 | 2 192 525 294 $ US | 1 367 451 853 $ US |
| 2013 | 1 821 876 610 $ US | 1 323 745 894 $ US |
| 2012 | 1 516 163 420 $ US | 1 334 451 165 $ US |
| 2011 | 1 473 088 462 $ US | 1 197 496 011 $ US |
| 2010 | 1 149 778 180 $ US | 1 005 468 857 $ US |
| 2009 | 1 053 628 511 $ US | 912 803 781 $ US |
| 2008 | 1 314 383 137 $ US | 1 346 091 893 $ US |
| 2007 | 1 239 005 248 $ US | 1 013 943 943 $ US |
| 2006 | 968 904 284 $ US | 665 861 210 $ US |
| 2005 | 830 775 688 $ US | 494 287 687 $ US |
| 2004 | 449 294 957 $ US | 467 093 884 $ US |
| 2003 | 449 484 054 $ US | 362 010 866 $ US |
| 2002 | 500 912 682 $ US | 584 760 468 $ US |
| 2001 | 533 276 456 $ US | 481 707 282 $ US |
| 2000 | 416 345 472 $ US | 406 714 118 $ US |
| 1999 | 393 578 701 $ US | 336 261 244 $ US |
| 1998 | 336 751 674 $ US | 335 077 472 $ US |
| 1997 | 325 780 238 $ US | 314 153 578 $ US |
| 1996 | 487 519 652 $ US | 293 271 656 $ US |
| 1995 | 504 921 702 $ US | 244 118 593 $ US |
| 1994 | 449 699 699 $ US | 206 019 176 $ US |
| 1993 | 334 557 349 $ US | 187 241 758 $ US |
| 1992 | 326 250 469 $ US | 174 531 018 $ US |
| 1991 | 335 100 471 $ US | 148 319 676 $ US |
| 1990 | 317 612 729 $ US | 152 896 637 $ US |
| 1989 | 321 334 633 $ US | 132 141 103 $ US |
| 1988 | 284 498 688 $ US | 118 398 984 $ US |
| 1987 | 326 501 727 $ US | 95 949 047 $ US |
| 1986 | 322 988 040 $ US | 75 080 488 $ US |
| 1985 | 291 285 364 $ US | 58 598 217 $ US |
| 1984 | 337 141 296 $ US | 53 308 592 $ US |
| 1983 | 309 932 067 $ US | 45 208 590 $ US |
| 1982 | 327 218 401 $ US | 49 322 941 $ US |
| 1981 | 331 909 843 $ US | 61 531 573 $ US |
| 1980 | 436 437 645 $ US | 79 468 475 $ US |
| 1979 | 413 781 756 $ US | 73 899 673 $ US |
| 1978 | 404 998 781 $ US | 34 876 249 $ US |
| 1977 | 350 661 179 $ US | 34 760 841 $ US |
| 1976 | 289 014 942 $ US | 40 929 136 $ US |
| 1975 | 319 534 013 $ US | 62 012 369 $ US |
| 1974 | 240 170 749 $ US | 40 173 865 $ US |
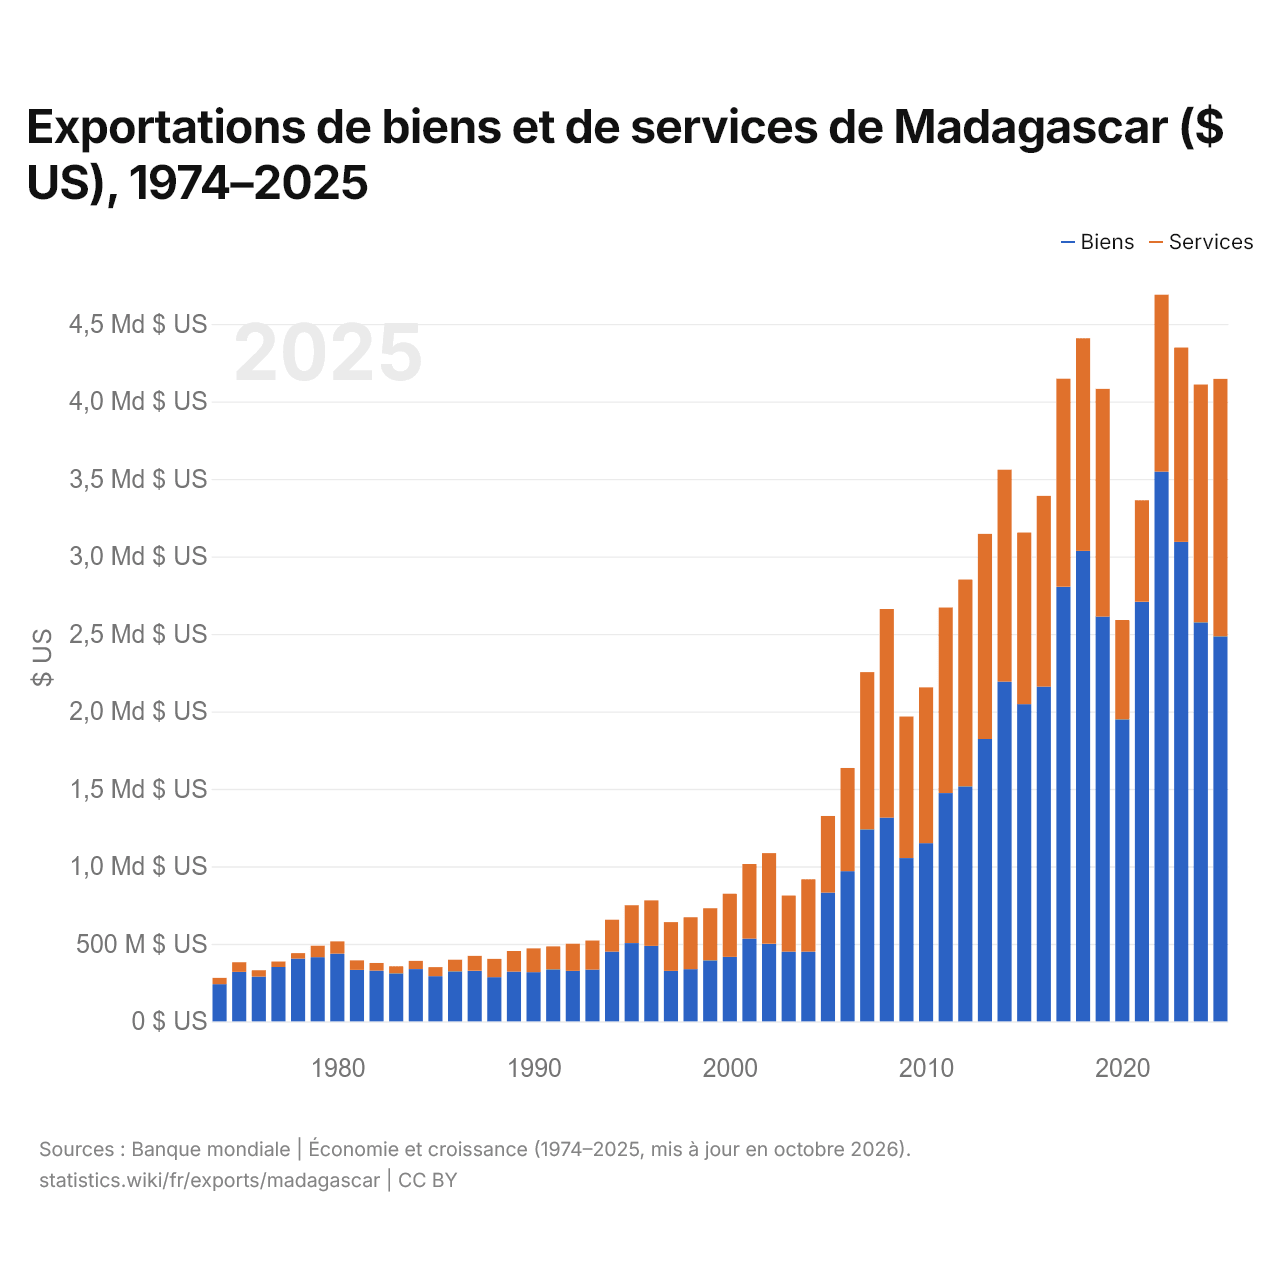
En 2025, les exportations de biens de Madagascar s'élevaient à 2,48 milliards de dollars et celles de services à 1,66 milliard de dollars ; les services représentaient 40,1 % du total, contre 14,3 % en 1974.
Madagascar dans le classement mondial des exportations, 2025
| Rang | Pays | Exportations | Part mondiale | |
|---|---|---|---|---|
| 133 |
 Îles Caïmans |
5,04 Md $US (2024) | 0,02 % | |
| 134 |
 Mauritanie |
4,65 Md $US | 0,01 % | |
| 135 |
 Bénin |
4,19 Md $US | 0,01 % | |
| 136 |
 Madagascar |
4,19 Md $US | 0,01 % | |
| 137 |
 Népal |
4,02 Md $US | 0,01 % | |
| 138 |
 Somalie |
3,80 Md $US | 0,01 % | |
| 139 |
 Saint-Marin |
3,76 Md $US (2024) | 0,01 % |
Exportations de biens et services de Madagascar, % du PIB, 1960–2025
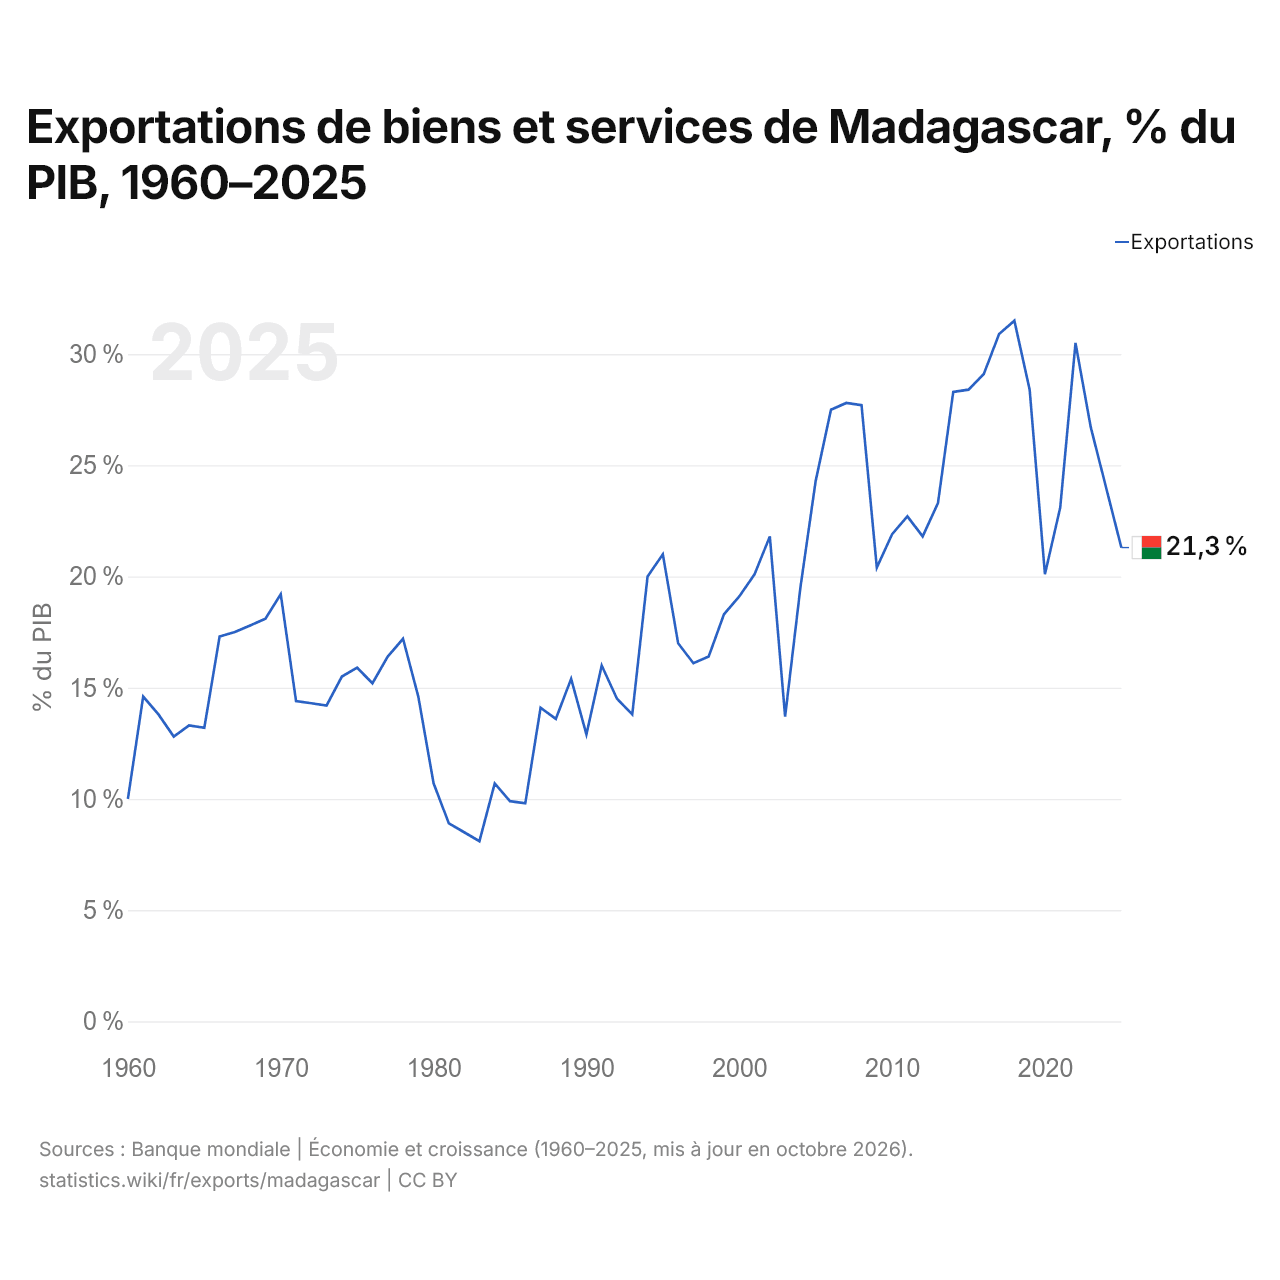
En 2025, les exportations de biens et services de Madagascar équivalaient à 21,3 % de son PIB, contre 10,0 % en 1960. La part la plus élevée a été de 31,5 %, en 2018.
Comparer les exportations de Madagascar avec celles d'autres pays
Sources :
- Banque mondiale | Économie et croissance (1960–2025, mis à jour en octobre 2026)
- TradeMap (2001–2025, mis à jour en octobre 2026)
Creative Commons Attribution (CC BY) : vous pouvez copier, partager, adapter et réutiliser ce contenu, y compris à des fins commerciales, à condition de citer statistics.wiki et d’indiquer les modifications apportées. Les sources citées ci-dessus peuvent avoir leurs propres conditions de licence.