
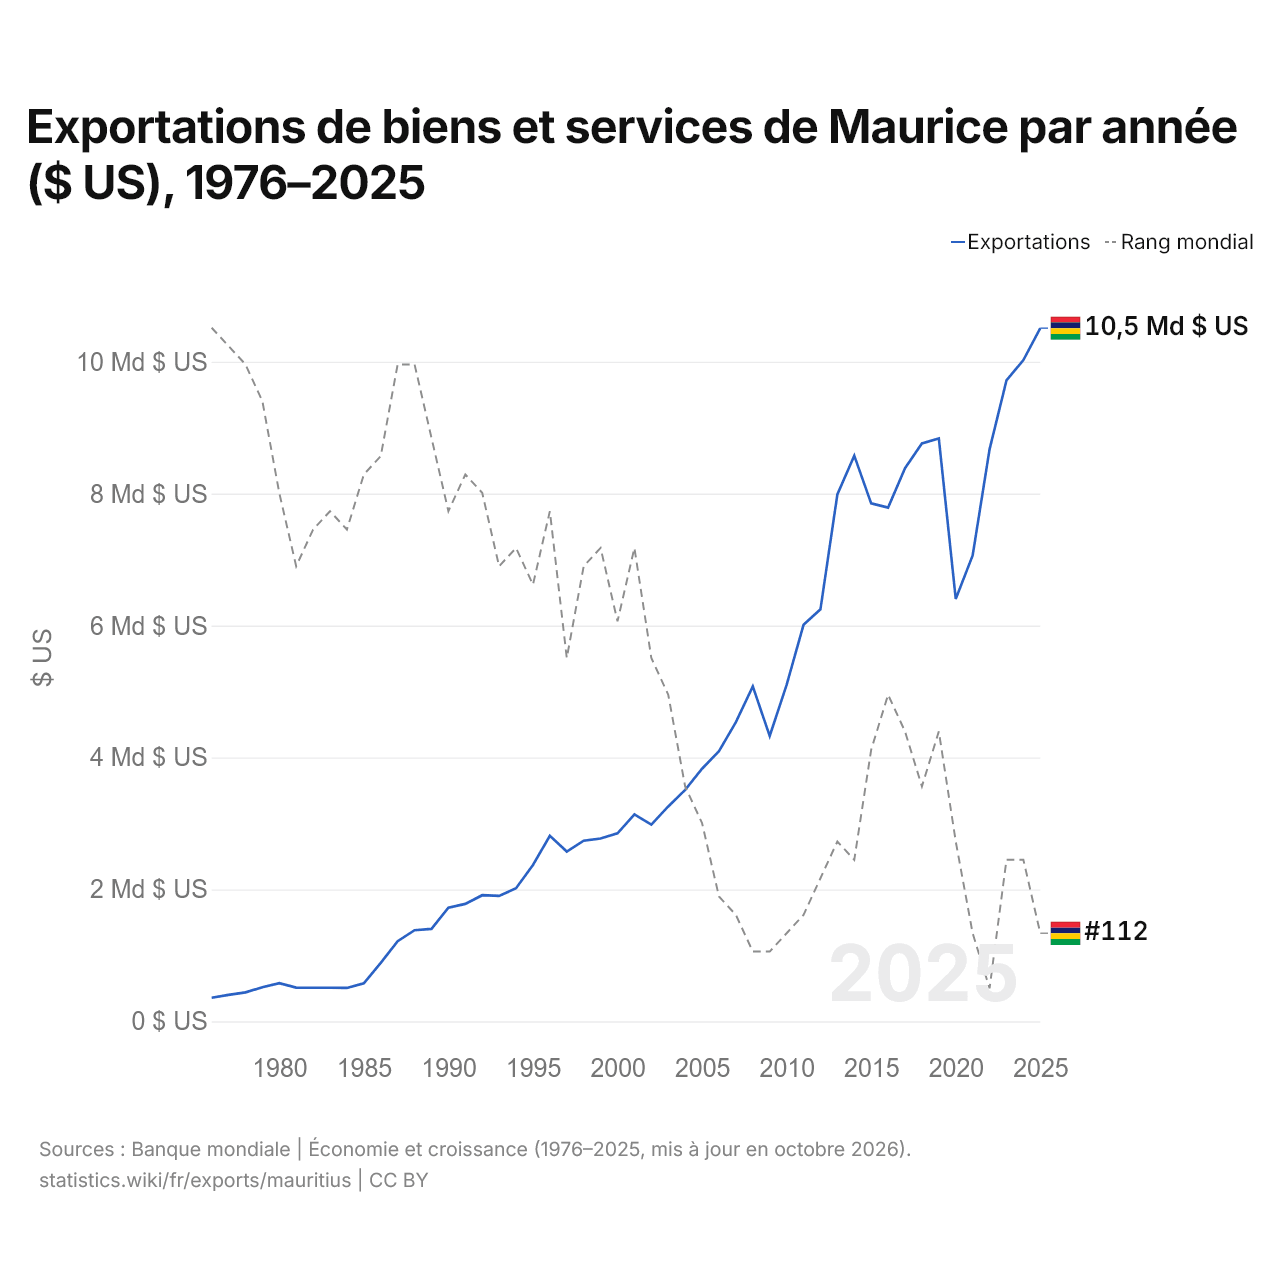
Exportations de biens et services de Maurice par année ($ US), 1976–2025
| Année | $ US | Rang mondial |
|---|---|---|
| Exportations | Rang mondial | |
| 2025 | 10 508 453 742 $ US | #112 |
| 2024 | 10 025 062 117 $ US | #108 |
| 2023 | 9 715 616 542 $ US | #108 |
| 2022 | 8 671 207 275 $ US | #115 |
| 2021 | 7 062 411 511 $ US | #112 |
| 2020 | 6 403 116 604 $ US | #107 |
| 2019 | 8 837 804 270 $ US | #101 |
| 2018 | 8 760 255 080 $ US | #104 |
| 2017 | 8 385 997 463 $ US | #101 |
| 2016 | 7 788 248 023 $ US | #99 |
| 2015 | 7 852 564 560 $ US | #102 |
| 2014 | 8 575 510 562 $ US | #108 |
| 2013 | 7 987 464 268 $ US | #107 |
| 2012 | 6 245 529 946 $ US | #109 |
| 2011 | 6 011 123 130 $ US | #111 |
| 2010 | 5 100 895 259 $ US | #112 |
| 2009 | 4 325 246 090 $ US | #113 |
| 2008 | 5 077 630 569 $ US | #113 |
| 2007 | 4 534 954 334 $ US | #111 |
| 2006 | 4 094 163 167 $ US | #110 |
| 2005 | 3 829 946 692 $ US | #106 |
| 2004 | 3 508 043 725 $ US | #104 |
| 2003 | 3 257 695 158 $ US | #99 |
| 2002 | 2 982 651 358 $ US | #97 |
| 2001 | 3 136 674 473 $ US | #91 |
| 2000 | 2 849 019 401 $ US | #95 |
| 1999 | 2 771 402 053 $ US | #91 |
| 1998 | 2 738 797 090 $ US | #92 |
| 1997 | 2 573 649 428 $ US | #97 |
| 1996 | 2 811 723 402 $ US | #89 |
| 1995 | 2 369 967 141 $ US | #93 |
| 1994 | 2 018 277 243 $ US | #91 |
| 1993 | 1 900 665 939 $ US | #92 |
| 1992 | 1 912 137 909 $ US | #88 |
| 1991 | 1 779 993 085 $ US | #87 |
| 1990 | 1 723 622 086 $ US | #89 |
| 1989 | 1 400 873 863 $ US | #85 |
| 1988 | 1 381 558 262 $ US | #81 |
| 1987 | 1 214 376 183 $ US | #81 |
| 1986 | 885 094 544 $ US | #86 |
| 1985 | 576 008 405 $ US | #87 |
| 1984 | 506 437 055 $ US | #90 |
| 1983 | 508 533 939 $ US | #89 |
| 1982 | 508 528 358 $ US | #90 |
| 1981 | 510 935 885 $ US | #92 |
| 1980 | 579 103 449 $ US | #88 |
| 1979 | 516 795 210 $ US | #83 |
| 1978 | 438 890 038 $ US | #81 |
| 1977 | 401 979 142 $ US | #80 |
| 1976 | 357 403 437 $ US | #79 |
En 2025, les exportations de biens et services de Maurice s'élevaient à 10,5 milliards de dollars, contre 357 millions de dollars en 1976. Elles se classaient au 112e rang mondial, en baisse par rapport au 108e rang en 2024. Leur meilleur rang a été le 79e, occupé pour la dernière fois en 1976.
En 2025, les exportations de biens et services de Maurice étaient les 18es plus élevées de 50 pays situés en Afrique. Les importations de biens et services de Maurice s'élevaient à 12,1 milliards de dollars en 2025, au 114e rang mondial. En 2025, les importations de Maurice dépassaient ses exportations de 1,59 milliard de dollars, soit un déficit commercial.
Exportations de biens de Maurice par catégorie, 2025
Exportations de biens, 2025: 1,65 Md $US
En 2025, la première catégorie des exportations de biens de Maurice était « aliments transformés, huiles, aliments pour animaux, boissons et tabac », avec 32,0 %, suivie de « textiles, vêtements, chaussures, meubles et jouets », avec 28,8 %.
Destinations des exportations de biens de Maurice : les 10 premières, 2025
| Rang | Pays | Exportations de biens | Part | |
|---|---|---|---|---|
| 1 |
 France |
219 M $US | 13,3 % | vs France |
| 2 |
 Afrique du Sud |
207 M $US | 12,6 % | |
| 3 |
 États-Unis |
173 M $US | 10,5 % | |
| 4 |
 Royaume-Uni |
160 M $US | 9,7 % | |
| 5 |
 Madagascar |
155 M $US | 9,43 % | vs Madagascar |
| 6 |
 Espagne |
117 M $US | 7,08 % | |
| 7 |
 Pays-Bas |
63,8 M $US | 3,87 % | |
| 8 |
 Kenya |
57,1 M $US | 3,47 % | |
| 9 |
 Inde |
41,7 M $US | 2,53 % | |
| 10 |
 Italie |
40,0 M $US | 2,43 % | |
| Autres partenaires et non précisés | 414 M $US | 25,1 % |
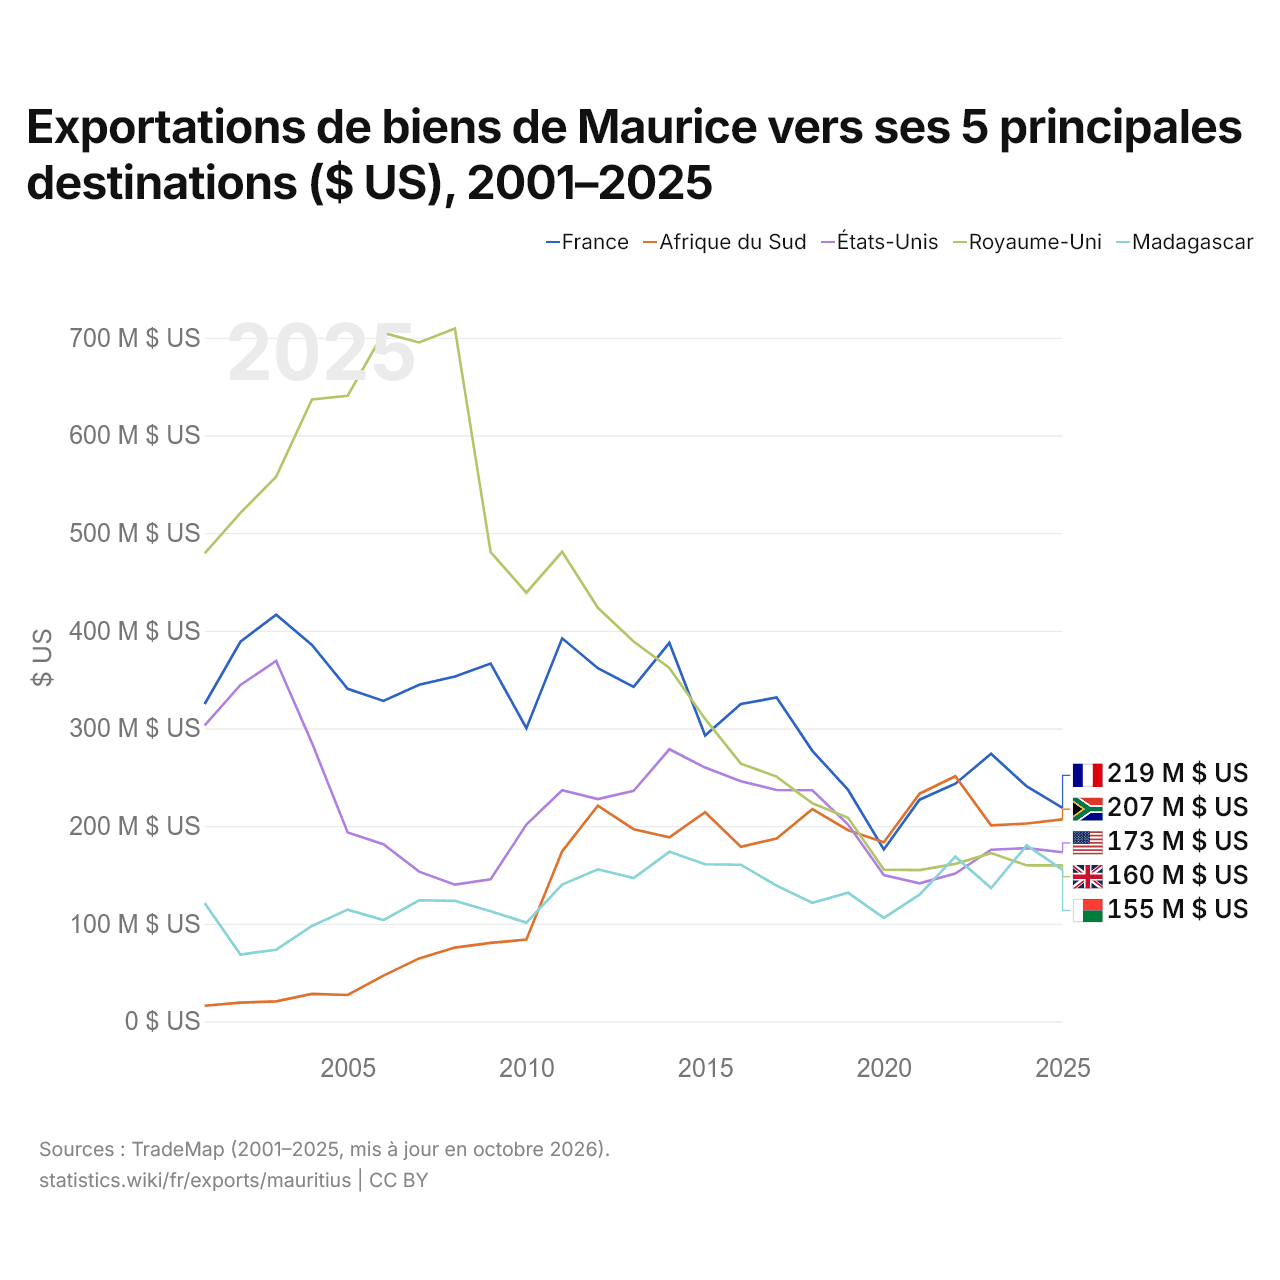
Exportations de biens de Maurice vers ses 5 principales destinations ($ US), 2001–2025
| Année | $ US | ||||
|---|---|---|---|---|---|
| France | Afrique du Sud | États-Unis | Royaume-Uni | Madagascar | |
| 2025 | 218 553 000 $ US | 206 818 000 $ US | 173 159 000 $ US | 159 763 000 $ US | 155 185 000 $ US |
| 2024 | 240 437 000 $ US | 202 539 000 $ US | 177 364 000 $ US | 159 659 000 $ US | 180 278 000 $ US |
| 2023 | 273 925 000 $ US | 200 711 000 $ US | 175 742 000 $ US | 172 255 000 $ US | 136 447 000 $ US |
| 2022 | 243 292 000 $ US | 250 967 000 $ US | 151 317 000 $ US | 161 203 000 $ US | 168 615 000 $ US |
| 2021 | 226 961 000 $ US | 233 104 000 $ US | 141 322 000 $ US | 154 879 000 $ US | 129 676 000 $ US |
| 2020 | 175 956 000 $ US | 183 420 000 $ US | 149 708 000 $ US | 155 315 000 $ US | 105 842 000 $ US |
| 2019 | 236 936 000 $ US | 195 687 000 $ US | 201 486 000 $ US | 208 443 000 $ US | 131 633 000 $ US |
| 2018 | 276 999 000 $ US | 217 193 000 $ US | 236 594 000 $ US | 223 249 000 $ US | 121 379 000 $ US |
| 2017 | 331 543 000 $ US | 187 140 000 $ US | 236 875 000 $ US | 250 601 000 $ US | 138 893 000 $ US |
| 2016 | 324 997 000 $ US | 178 748 000 $ US | 245 877 000 $ US | 263 812 000 $ US | 160 368 000 $ US |
| 2015 | 292 630 000 $ US | 214 064 000 $ US | 259 787 000 $ US | 309 630 000 $ US | 160 835 000 $ US |
| 2014 | 387 472 000 $ US | 188 417 000 $ US | 278 587 000 $ US | 361 791 000 $ US | 173 561 000 $ US |
| 2013 | 342 447 000 $ US | 196 736 000 $ US | 235 929 000 $ US | 388 831 000 $ US | 146 696 000 $ US |
| 2012 | 361 553 000 $ US | 220 798 000 $ US | 227 487 000 $ US | 423 427 000 $ US | 155 653 000 $ US |
| 2011 | 392 191 000 $ US | 174 111 000 $ US | 236 549 000 $ US | 480 786 000 $ US | 140 037 000 $ US |
| 2010 | 300 133 000 $ US | 83 743 000 $ US | 201 502 000 $ US | 438 913 000 $ US | 101 051 000 $ US |
| 2009 | 366 367 000 $ US | 80 257 000 $ US | 145 373 000 $ US | 480 418 000 $ US | 112 774 000 $ US |
| 2008 | 353 147 000 $ US | 75 536 000 $ US | 139 924 000 $ US | 709 360 000 $ US | 123 388 000 $ US |
| 2007 | 344 664 000 $ US | 64 445 000 $ US | 153 265 000 $ US | 695 092 000 $ US | 123 996 000 $ US |
| 2006 | 328 070 000 $ US | 46 801 000 $ US | 181 297 000 $ US | 704 884 000 $ US | 103 612 000 $ US |
| 2005 | 340 496 000 $ US | 26 942 000 $ US | 193 380 000 $ US | 640 490 000 $ US | 114 370 000 $ US |
| 2004 | 385 442 000 $ US | 28 119 000 $ US | 285 145 000 $ US | 636 725 000 $ US | 97 654 000 $ US |
| 2003 | 416 428 000 $ US | 20 504 000 $ US | 368 998 000 $ US | 557 691 000 $ US | 73 332 000 $ US |
| 2002 | 388 706 000 $ US | 19 139 000 $ US | 344 434 000 $ US | 520 566 000 $ US | 68 450 000 $ US |
| 2001 | 324 860 000 $ US | 15 930 000 $ US | 302 954 000 $ US | 479 155 000 $ US | 121 046 000 $ US |
En 2025, les exportations de biens s'élevaient à 219 millions de dollars vers la France, 207 millions de dollars vers l'Afrique du Sud, 173 millions de dollars vers les États-Unis, 160 millions de dollars vers le Royaume-Uni et 155 millions de dollars vers Madagascar. Le premier rang des cinq destinations de Maurice est occupé par la France depuis 2023. Le changement le plus récent dans leur ordre remonte à 2025, quand les exportations de Maurice vers le Royaume-Uni ont dépassé celles vers Madagascar.
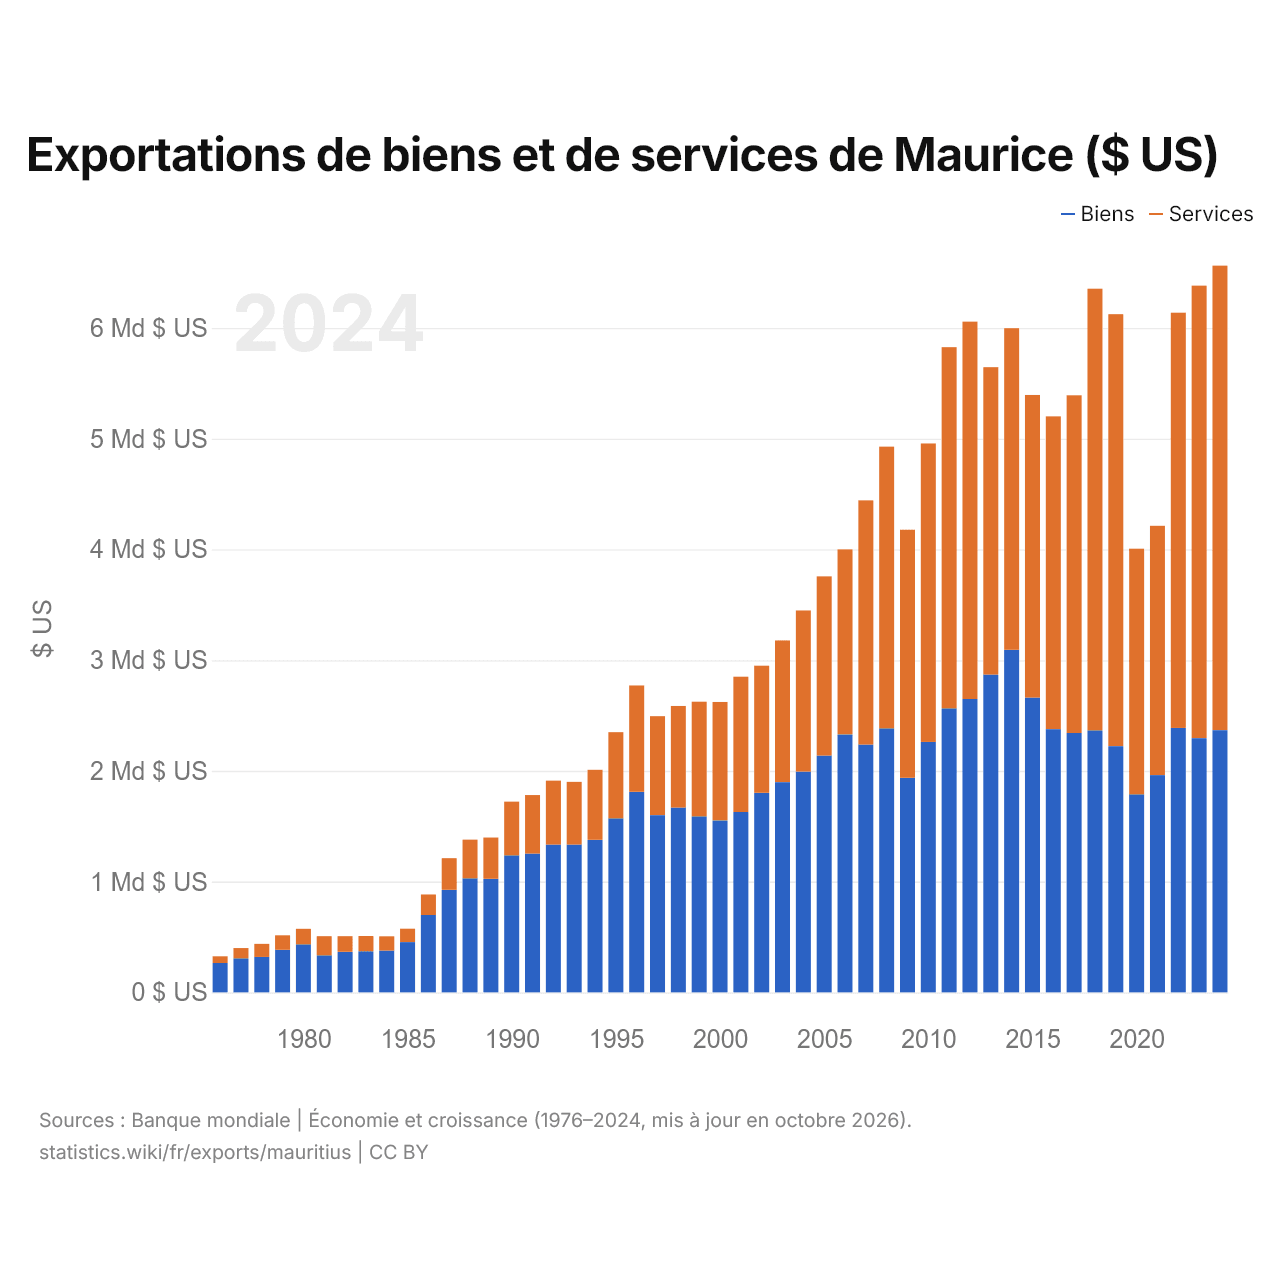
Exportations de biens et de services de Maurice ($ US)
| Année | $ US | |
|---|---|---|
| Biens | Services | |
| 2024 | 2 367 731 741 $ US | 4 194 631 451 $ US |
| 2023 | 2 295 415 070 $ US | 4 086 807 222 $ US |
| 2022 | 2 387 566 071 $ US | 3 750 233 052 $ US |
| 2021 | 1 961 589 921 $ US | 2 251 841 166 $ US |
| 2020 | 1 788 849 171 $ US | 2 217 501 406 $ US |
| 2019 | 2 222 916 853 $ US | 3 900 784 026 $ US |
| 2018 | 2 365 715 959 $ US | 3 988 668 964 $ US |
| 2017 | 2 341 654 010 $ US | 3 049 938 162 $ US |
| 2016 | 2 376 428 002 $ US | 2 824 931 540 $ US |
| 2015 | 2 661 824 493 $ US | 2 732 807 415 $ US |
| 2014 | 3 093 875 525 $ US | 2 904 059 758 $ US |
| 2013 | 2 868 795 076 $ US | 2 776 700 400 $ US |
| 2012 | 2 649 119 895 $ US | 3 407 938 313 $ US |
| 2011 | 2 564 999 784 $ US | 3 260 963 627 $ US |
| 2010 | 2 261 494 861 $ US | 2 695 085 865 $ US |
| 2009 | 1 938 533 433 $ US | 2 238 964 341 $ US |
| 2008 | 2 383 940 827 $ US | 2 543 865 596 $ US |
| 2007 | 2 237 898 295 $ US | 2 205 172 158 $ US |
| 2006 | 2 328 840 081 $ US | 1 671 303 452 $ US |
| 2005 | 2 138 353 971 $ US | 1 618 103 521 $ US |
| 2004 | 1 993 109 477 $ US | 1 455 640 317 $ US |
| 2003 | 1 898 095 892 $ US | 1 280 060 556 $ US |
| 2002 | 1 801 304 543 $ US | 1 148 711 442 $ US |
| 2001 | 1 628 242 397 $ US | 1 221 971 725 $ US |
| 2000 | 1 552 221 327 $ US | 1 070 154 461 $ US |
| 1999 | 1 589 188 620 $ US | 1 035 622 905 $ US |
| 1998 | 1 669 302 891 $ US | 916 947 482 $ US |
| 1997 | 1 600 113 342 $ US | 893 658 600 $ US |
| 1996 | 1 810 557 126 $ US | 960 772 005 $ US |
| 1995 | 1 571 695 749 $ US | 777 680 532 $ US |
| 1994 | 1 376 920 664 $ US | 632 726 503 $ US |
| 1993 | 1 334 426 940 $ US | 566 238 998 $ US |
| 1992 | 1 334 686 239 $ US | 577 451 629 $ US |
| 1991 | 1 253 425 347 $ US | 528 292 685 $ US |
| 1990 | 1 238 069 181 $ US | 483 870 968 $ US |
| 1989 | 1 025 261 589 $ US | 372 727 014 $ US |
| 1988 | 1 030 233 912 $ US | 348 794 160 $ US |
| 1987 | 925 826 946 $ US | 285 287 947 $ US |
| 1986 | 698 481 339 $ US | 185 499 297 $ US |
| 1985 | 453 489 238 $ US | 121 224 026 $ US |
| 1984 | 376 874 955 $ US | 129 562 088 $ US |
| 1983 | 371 256 257 $ US | 137 277 682 $ US |
| 1982 | 366 519 354 $ US | 140 721 358 $ US |
| 1981 | 334 245 630 $ US | 172 549 970 $ US |
| 1980 | 433 611 860 $ US | 139 895 783 $ US |
| 1979 | 384 742 917 $ US | 130 149 953 $ US |
| 1978 | 319 635 259 $ US | 117 794 517 $ US |
| 1977 | 307 235 549 $ US | 92 776 055 $ US |
| 1976 | 264 610 250 $ US | 61 213 570 $ US |
Les exportations de biens de Maurice s'élèvent à 2,37 milliards de dollars (2024) et celles de services à 4,19 milliards de dollars ; les services représentent 63,9 % du total, contre 18,8 % en 1976.
Maurice dans le classement mondial des exportations, 2025
| Rang | Pays | Exportations | Part mondiale | |
|---|---|---|---|---|
| 109 |
 Macédoine du Nord |
11,4 Md $US | 0,03 % | |
| 110 |
 Albanie |
11,3 Md $US | 0,03 % | |
| 111 |
 Brunei |
10,8 Md $US | 0,03 % | |
| 112 |
 Maurice |
10,5 Md $US | 0,03 % | |
| 113 |
 Burkina Faso |
9,67 Md $US | 0,03 % | |
| 114 |
 Nicaragua |
9,25 Md $US | 0,03 % | |
| 115 |
 Mozambique |
9,24 Md $US | 0,03 % |
Exportations de biens et services de Maurice, % du PIB, 1976–2025
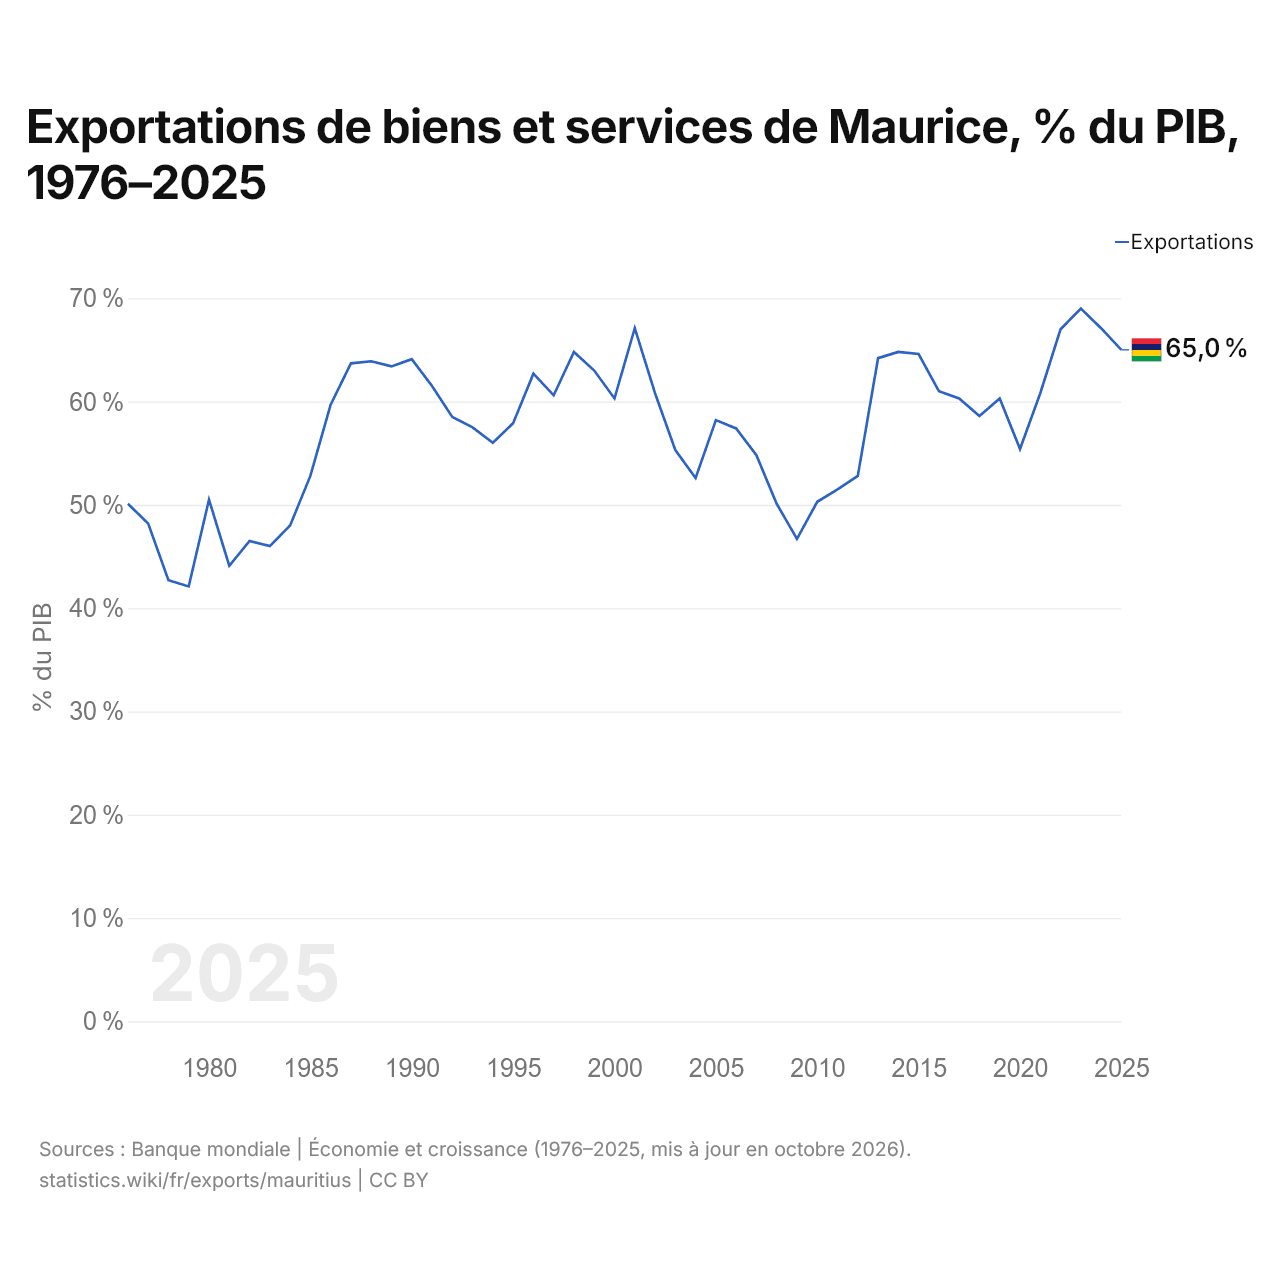
En 2025, les exportations de biens et services de Maurice équivalaient à 65,0 % de son PIB, contre 50,1 % en 1976. La part la plus élevée a été de 69,0 %, en 2023.
Comparer les exportations de Maurice avec celles d'autres pays
Sources :
- TradeMap (2001–2025, mis à jour en octobre 2026)
- Banque mondiale | Économie et croissance (1976–2025, mis à jour en octobre 2026)
Creative Commons Attribution (CC BY) : vous pouvez copier, partager, adapter et réutiliser ce contenu, y compris à des fins commerciales, à condition de citer statistics.wiki et d’indiquer les modifications apportées. Les sources citées ci-dessus peuvent avoir leurs propres conditions de licence.