
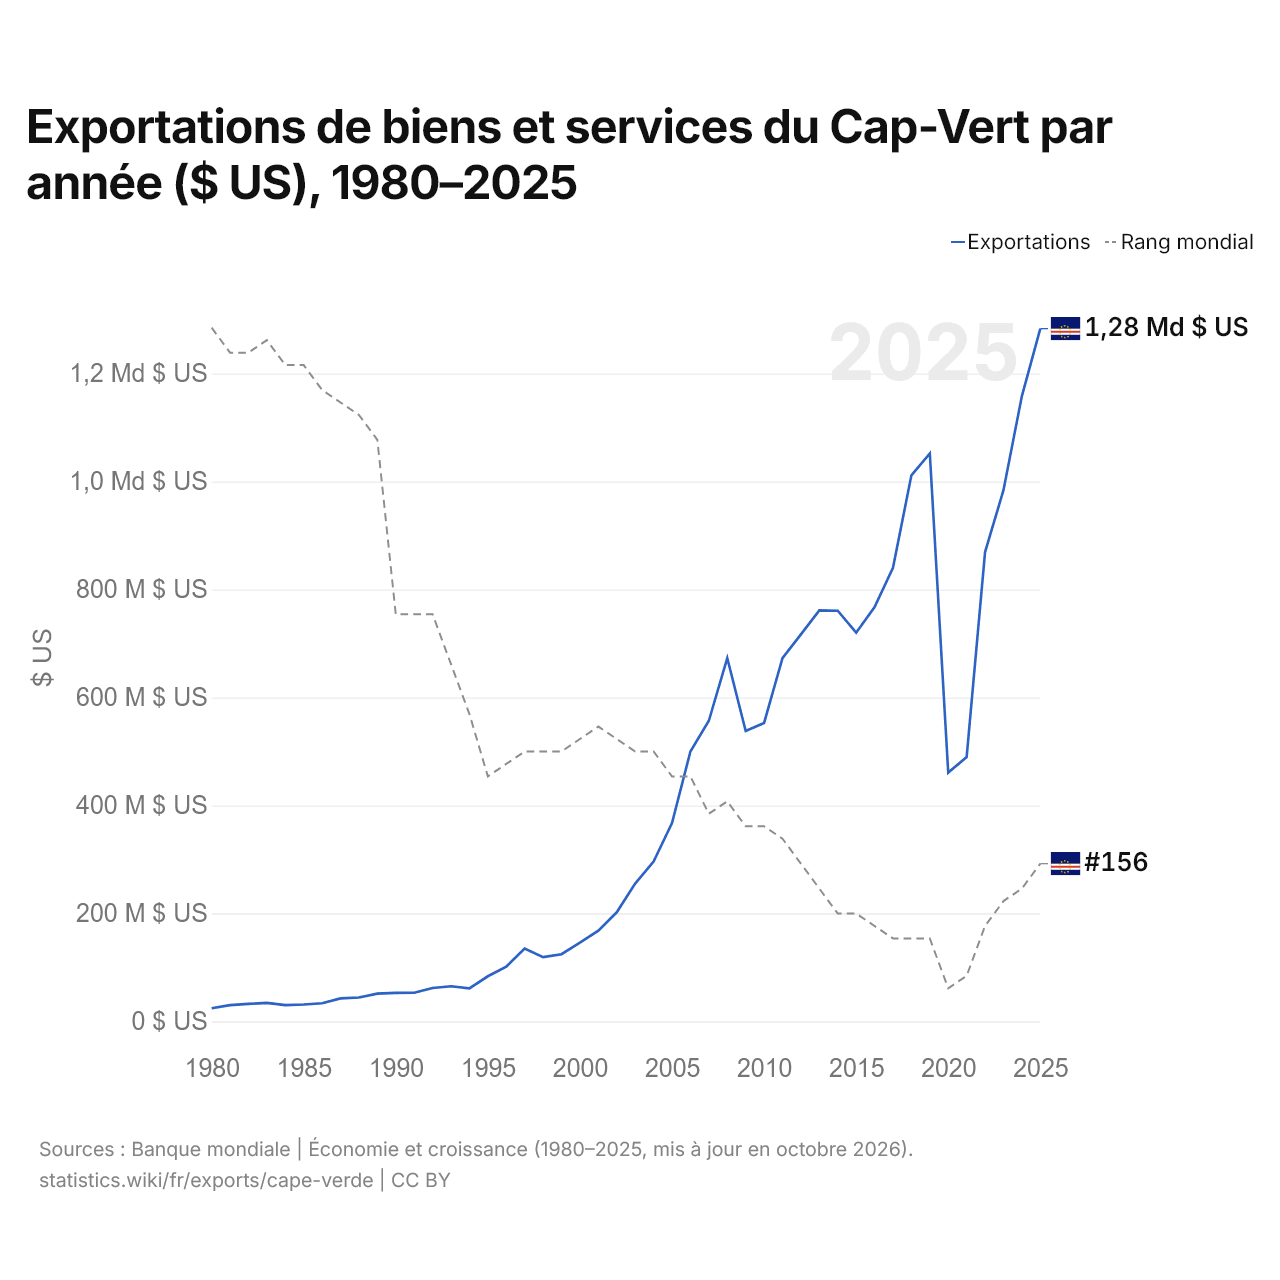
Exportations de biens et services du Cap-Vert par année ($ US), 1980–2025
| Année | $ US | Rang mondial |
|---|---|---|
| Exportations | Rang mondial | |
| 2025 | 1 283 053 105 $ US | #156 |
| 2024 | 1 158 196 704 $ US | #158 |
| 2023 | 983 790 275 $ US | #159 |
| 2022 | 869 236 486 $ US | #161 |
| 2021 | 489 360 327 $ US | #165 |
| 2020 | 460 735 345 $ US | #166 |
| 2019 | 1 051 880 072 $ US | #162 |
| 2018 | 1 011 390 796 $ US | #162 |
| 2017 | 840 005 277 $ US | #162 |
| 2016 | 767 162 452 $ US | #161 |
| 2015 | 719 807 460 $ US | #160 |
| 2014 | 760 584 105 $ US | #160 |
| 2013 | 761 183 233 $ US | #158 |
| 2012 | 716 706 284 $ US | #156 |
| 2011 | 672 876 288 $ US | #154 |
| 2010 | 552 604 499 $ US | #153 |
| 2009 | 537 877 758 $ US | #153 |
| 2008 | 672 942 622 $ US | #151 |
| 2007 | 556 679 671 $ US | #152 |
| 2006 | 499 871 424 $ US | #149 |
| 2005 | 367 287 243 $ US | #149 |
| 2004 | 296 019 402 $ US | #147 |
| 2003 | 255 073 869 $ US | #147 |
| 2002 | 201 943 861 $ US | #146 |
| 2001 | 167 853 969 $ US | #145 |
| 2000 | 145 630 289 $ US | #146 |
| 1999 | 124 265 006 $ US | #147 |
| 1998 | 118 975 529 $ US | #147 |
| 1997 | 134 631 485 $ US | #147 |
| 1996 | 101 395 584 $ US | #148 |
| 1995 | 83 482 493 $ US | #149 |
| 1994 | 61 175 343 $ US | #144 |
| 1993 | 65 033 422 $ US | #140 |
| 1992 | 61 728 160 $ US | #136 |
| 1991 | 52 976 389 $ US | #136 |
| 1990 | 52 576 466 $ US | #136 |
| 1989 | 51 418 179 $ US | #122 |
| 1988 | 44 159 711 $ US | #120 |
| 1987 | 42 578 549 $ US | #119 |
| 1986 | 33 573 408 $ US | #118 |
| 1985 | 31 179 570 $ US | #116 |
| 1984 | 30 064 769 $ US | #116 |
| 1983 | 34 103 838 $ US | #114 |
| 1982 | 32 243 001 $ US | #115 |
| 1981 | 29 942 622 $ US | #115 |
| 1980 | 24 288 314 $ US | #113 |
En 2025, les exportations de biens et services du Cap-Vert s'élevaient à 1,28 milliard de dollars, contre 24,3 millions de dollars en 1980. Elles se classaient au 156e rang mondial, en hausse par rapport au 158e rang en 2024. Leur meilleur rang a été le 113e, occupé pour la dernière fois en 1980.
En 2025, les exportations de biens et services du Cap-Vert étaient les 42es plus élevées de 50 pays situés en Afrique. Les importations de biens et services du Cap-Vert s'élevaient à 1,63 milliard de dollars en 2025, au 156e rang mondial. En 2025, les importations du Cap-Vert dépassaient ses exportations de 348 millions de dollars, soit un déficit commercial.
Exportations de biens du Cap-Vert par catégorie, 2025
Exportations de biens, 2025: 80,9 M $US
En 2025, la première catégorie des exportations de biens du Cap-Vert était « aliments transformés, huiles, aliments pour animaux, boissons et tabac », avec 88,6 %, suivie de « textiles, vêtements, chaussures, meubles et jouets », avec 11,4 %.
Destinations des exportations de biens du Cap-Vert : les 8 premières, 2025
| Rang | Pays | Exportations de biens | Part | |
|---|---|---|---|---|
| 1 |
 Espagne |
60,8 M $US | 75,2 % | |
| 2 |
 Italie |
10,8 M $US | 13,4 % | |
| 3 |
 Portugal |
8,36 M $US | 10,3 % | |
| 4 |
 États-Unis |
645 k $US | 0,8 % | |
| 5 |
 Libye |
143 k $US | 0,18 % | |
| 6 |
 Israël |
89,0 k $US | 0,11 % | |
| 7 |
 EAU |
31,0 k $US | 0,04 % | |
| 8 |
 Bénin |
1,00 k $US | 0,001 % | |
| Autres partenaires et non précisés | 1,00 k $US | 0,001 % |
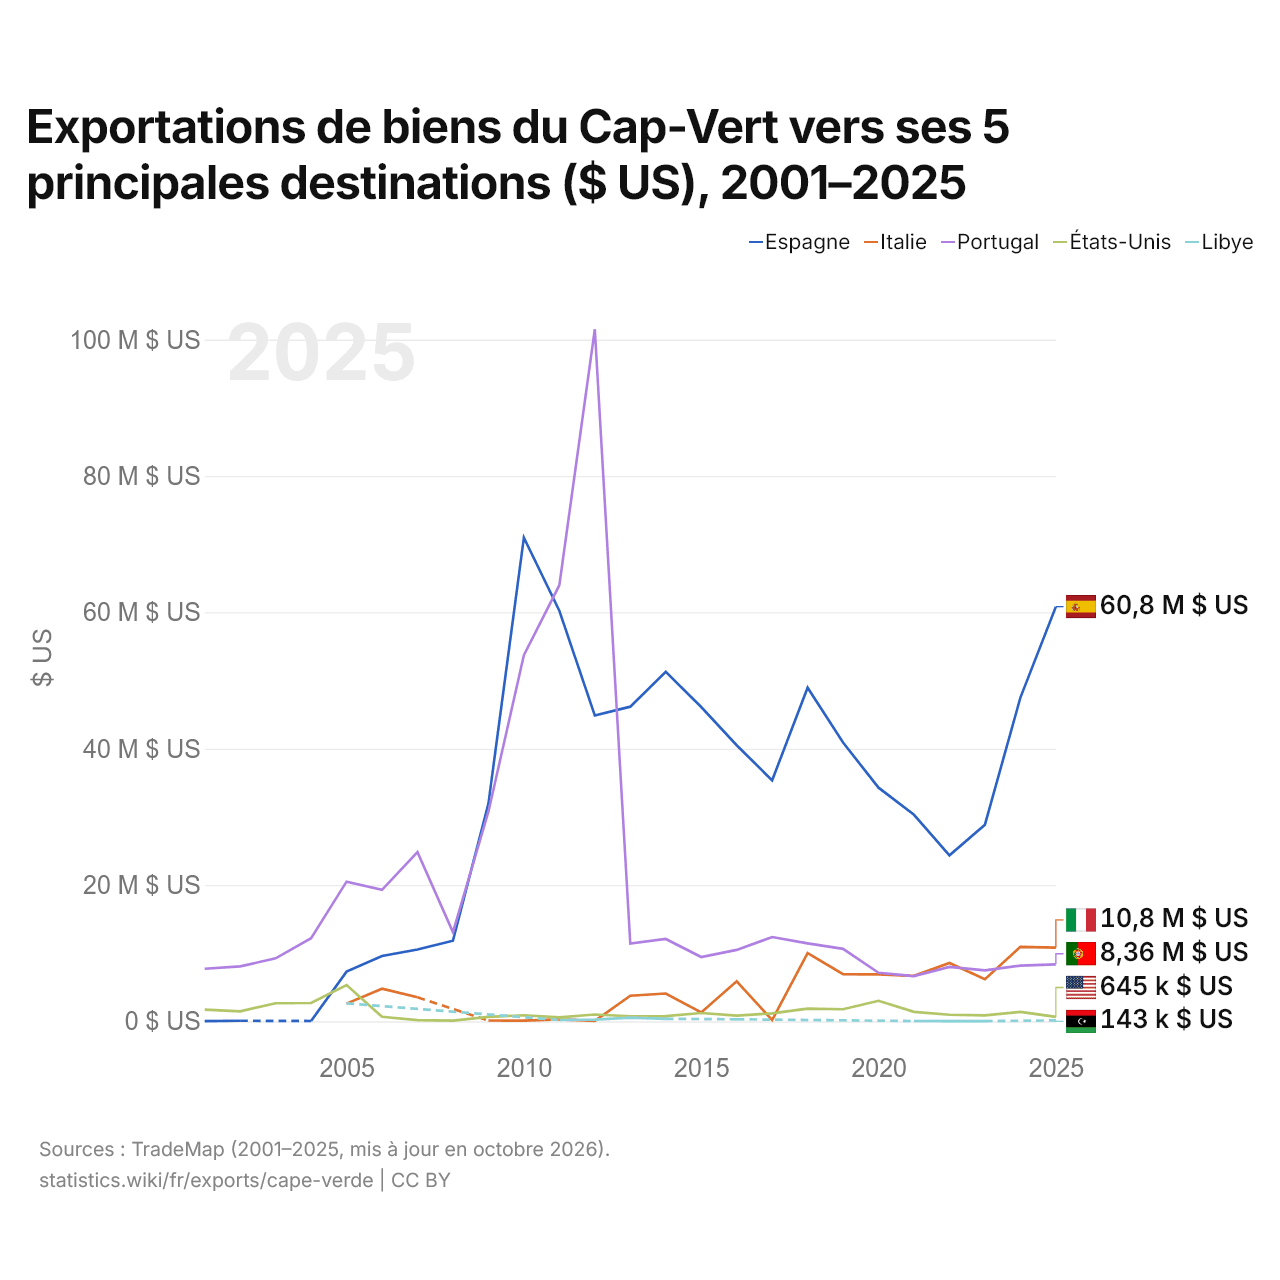
Exportations de biens du Cap-Vert vers ses 5 principales destinations ($ US), 2001–2025
| Année | $ US | ||||
|---|---|---|---|---|---|
| Espagne | Italie | Portugal | États-Unis | Libye | |
| 2025 | 60 822 000 $ US | 10 816 000 $ US | 8 361 000 $ US | 645 000 $ US | 143 000 $ US |
| 2024 | 47 490 000 $ US | 10 927 000 $ US | 8 168 000 $ US | 1 392 000 $ US | - |
| 2023 | 28 848 000 $ US | 6 187 000 $ US | 7 487 000 $ US | 884 000 $ US | 41 000 $ US |
| 2022 | 24 343 000 $ US | 8 560 000 $ US | 7 974 000 $ US | 970 000 $ US | 20 000 $ US |
| 2021 | 30 299 000 $ US | 6 669 000 $ US | 6 628 000 $ US | 1 389 000 $ US | 48 000 $ US |
| 2020 | 34 270 000 $ US | 6 892 000 $ US | 7 115 000 $ US | 3 009 000 $ US | - |
| 2019 | 40 889 000 $ US | 6 931 000 $ US | 10 630 000 $ US | 1 775 000 $ US | - |
| 2018 | 48 940 000 $ US | 10 007 000 $ US | 11 432 000 $ US | 1 865 000 $ US | - |
| 2017 | 35 347 000 $ US | 186 000 $ US | 12 363 000 $ US | 1 166 000 $ US | - |
| 2016 | 40 502 000 $ US | 5 882 000 $ US | 10 473 000 $ US | 833 000 $ US | 299 000 $ US |
| 2015 | 46 105 000 $ US | 1 305 000 $ US | 9 437 000 $ US | 1 219 000 $ US | - |
| 2014 | 51 256 000 $ US | 4 082 000 $ US | 12 086 000 $ US | 773 000 $ US | 371 000 $ US |
| 2013 | 46 155 000 $ US | 3 756 000 $ US | 11 405 000 $ US | 744 000 $ US | 539 000 $ US |
| 2012 | 44 853 000 $ US | 58 000 $ US | 101 512 000 $ US | 1 003 000 $ US | 247 000 $ US |
| 2011 | 60 229 000 $ US | 294 000 $ US | 63 965 000 $ US | 592 000 $ US | 191 000 $ US |
| 2010 | 70 950 000 $ US | 111 000 $ US | 53 699 000 $ US | 895 000 $ US | - |
| 2009 | 31 942 000 $ US | 122 000 $ US | 30 744 000 $ US | 651 000 $ US | - |
| 2008 | 11 824 000 $ US | - | 13 078 000 $ US | 102 000 $ US | - |
| 2007 | 10 527 000 $ US | 3 528 000 $ US | 24 820 000 $ US | 169 000 $ US | - |
| 2006 | 9 587 000 $ US | 4 786 000 $ US | 19 288 000 $ US | 661 000 $ US | - |
| 2005 | 7 289 000 $ US | 2 597 000 $ US | 20 490 000 $ US | 5 328 000 $ US | 2 643 000 $ US |
| 2004 | 53 000 $ US | - | 12 188 000 $ US | 2 683 000 $ US | - |
| 2003 | - | - | 9 245 000 $ US | 2 657 000 $ US | - |
| 2002 | 87 000 $ US | - | 8 055 000 $ US | 1 469 000 $ US | - |
| 2001 | 24 000 $ US | - | 7 713 000 $ US | 1 727 000 $ US | - |
En 2025, les exportations de biens s'élevaient à 60,8 millions de dollars vers l'Espagne, 10,8 millions de dollars vers l'Italie, 8,36 millions de dollars vers le Portugal, 645 mille dollars vers les États-Unis et 143 mille dollars vers la Libye. Le premier rang des cinq destinations du Cap-Vert est occupé par l'Espagne depuis 2013. Le changement le plus récent dans leur ordre remonte à 2024, quand les exportations du Cap-Vert vers l'Italie ont dépassé celles vers le Portugal.
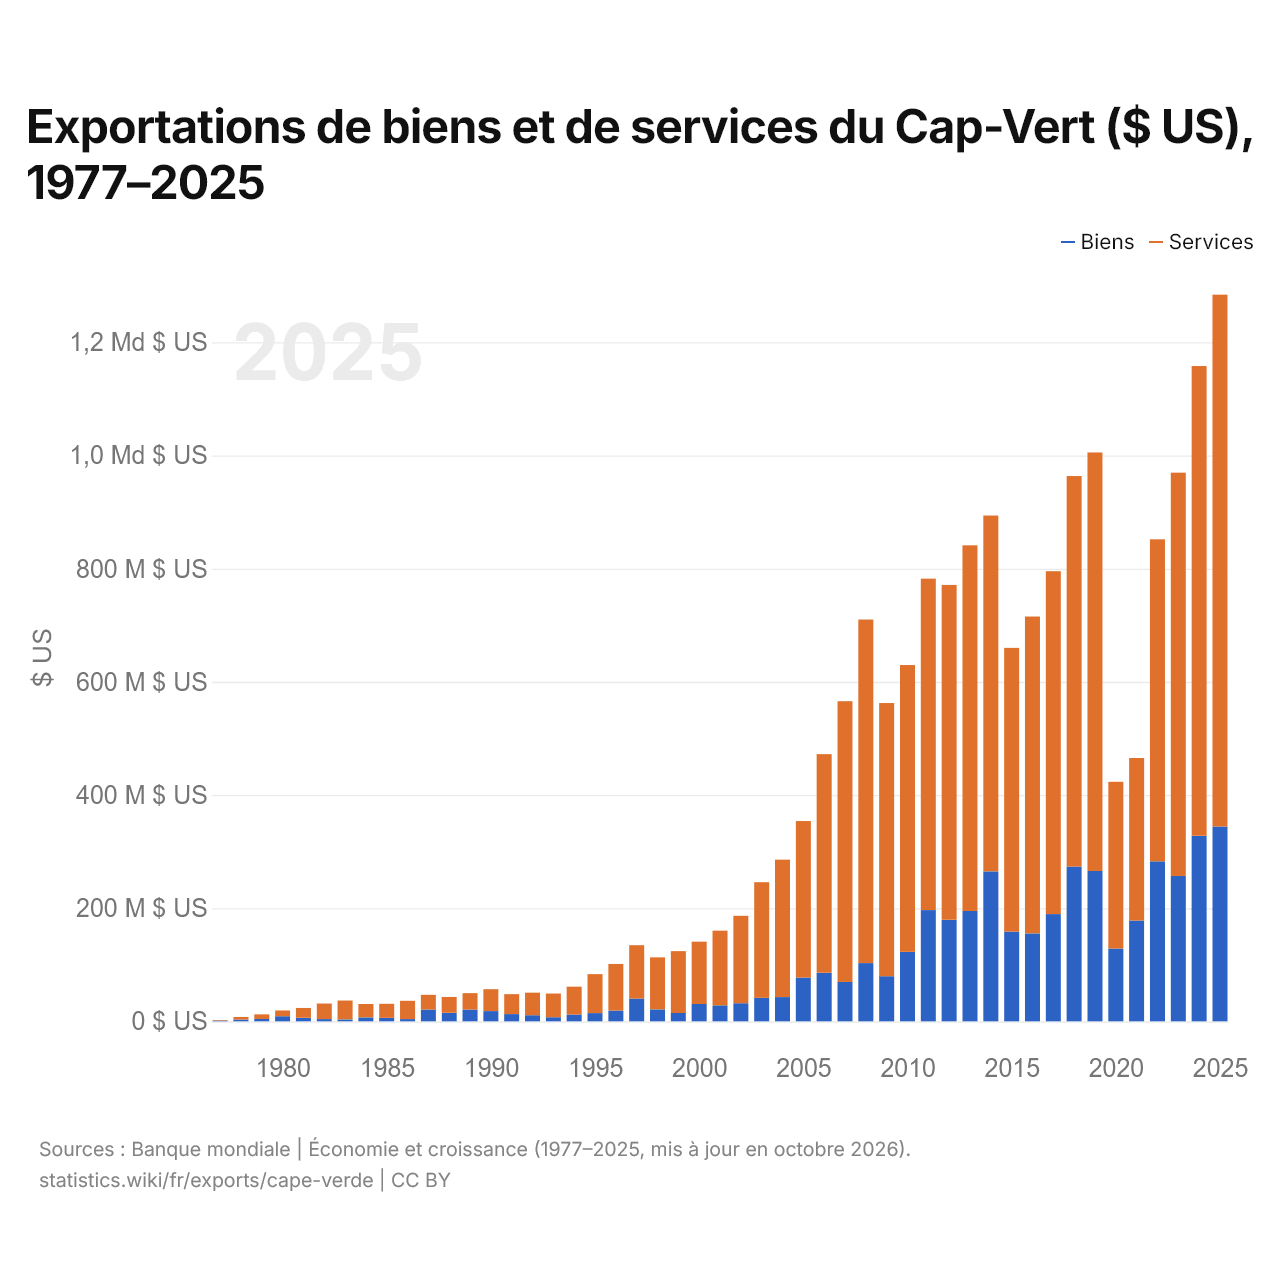
Exportations de biens et de services du Cap-Vert ($ US), 1977–2025
| Année | $ US | |
|---|---|---|
| Biens | Services | |
| 2025 | 344 224 409 $ US | 939 938 216 $ US |
| 2024 | 327 839 007 $ US | 830 149 794 $ US |
| 2023 | 256 975 723 $ US | 712 626 462 $ US |
| 2022 | 282 748 909 $ US | 569 158 367 $ US |
| 2021 | 178 088 566 $ US | 287 259 150 $ US |
| 2020 | 128 677 755 $ US | 294 574 333 $ US |
| 2019 | 265 689 765 $ US | 739 658 215 $ US |
| 2018 | 273 630 686 $ US | 690 018 970 $ US |
| 2017 | 189 532 020 $ US | 605 956 570 $ US |
| 2016 | 155 431 964 $ US | 559 988 333 $ US |
| 2015 | 158 562 229 $ US | 501 423 239 $ US |
| 2014 | 264 970 054 $ US | 628 935 056 $ US |
| 2013 | 194 991 262 $ US | 646 282 385 $ US |
| 2012 | 179 474 285 $ US | 591 731 446 $ US |
| 2011 | 196 644 688 $ US | 585 704 653 $ US |
| 2010 | 122 722 539 $ US | 506 888 083 $ US |
| 2009 | 79 732 824 $ US | 482 739 426 $ US |
| 2008 | 102 832 037 $ US | 607 266 060 $ US |
| 2007 | 69 639 338 $ US | 496 065 365 $ US |
| 2006 | 85 794 542 $ US | 386 354 184 $ US |
| 2005 | 77 161 967 $ US | 276 727 035 $ US |
| 2004 | 42 887 873 $ US | 242 711 488 $ US |
| 2003 | 41 396 788 $ US | 204 401 226 $ US |
| 2002 | 31 905 444 $ US | 154 681 880 $ US |
| 2001 | 28 272 786 $ US | 131 893 076 $ US |
| 2000 | 30 611 339 $ US | 110 083 008 $ US |
| 1999 | 14 738 691 $ US | 109 382 810 $ US |
| 1998 | 21 089 709 $ US | 91 963 308 $ US |
| 1997 | 40 176 475 $ US | 94 368 798 $ US |
| 1996 | 18 936 339 $ US | 82 459 366 $ US |
| 1995 | 14 484 342 $ US | 68 997 788 $ US |
| 1994 | 12 173 646 $ US | 49 001 822 $ US |
| 1993 | 7 242 629 $ US | 41 902 307 $ US |
| 1992 | 10 760 306 $ US | 39 938 496 $ US |
| 1991 | 12 707 620 $ US | 35 431 579 $ US |
| 1990 | 18 095 757 $ US | 38 742 087 $ US |
| 1989 | 20 659 138 $ US | 29 223 852 $ US |
| 1988 | 15 092 517 $ US | 28 008 881 $ US |
| 1987 | 20 875 217 $ US | 25 959 820 $ US |
| 1986 | 4 003 997 $ US | 32 252 825 $ US |
| 1985 | 6 121 246 $ US | 24 814 566 $ US |
| 1984 | 6 926 419 $ US | 23 734 089 $ US |
| 1983 | 3 300 513 $ US | 33 483 603 $ US |
| 1982 | 3 973 010 $ US | 27 454 254 $ US |
| 1981 | 6 259 412 $ US | 17 389 995 $ US |
| 1980 | 9 115 140 $ US | 10 078 428 $ US |
| 1979 | 4 124 703 $ US | 8 193 305 $ US |
| 1978 | 3 073 175 $ US | 4 681 591 $ US |
| 1977 | 1 242 419 $ US | 957 514 $ US |
En 2025, les exportations de biens du Cap-Vert s'élevaient à 344 millions de dollars et celles de services à 940 millions de dollars ; les services représentaient 73,2 % du total, contre 43,5 % en 1977.
Le Cap-Vert dans le classement mondial des exportations, 2025
| Rang | Pays | Exportations | Part mondiale | |
|---|---|---|---|---|
| 153 |
 Syrie |
1,61 Md $US (2022) | 0,005 % | |
| 154 |
 Malawi |
1,59 Md $US | 0,005 % | |
| 155 |
 Sierra Leone |
1,56 Md $US | 0,004 % | |
| 156 |
 Cap-Vert |
1,28 Md $US | 0,004 % | |
| 157 |
 Lesotho |
1,27 Md $US | 0,004 % | |
| 158 |
 Bhoutan |
1,05 Md $US (2024) | 0,003 % | |
| 159 |
 Antigua-et-Barbuda |
1,02 Md $US (2022) | 0,003 % |
Exportations de biens et services du Cap-Vert, % du PIB, 1980–2025
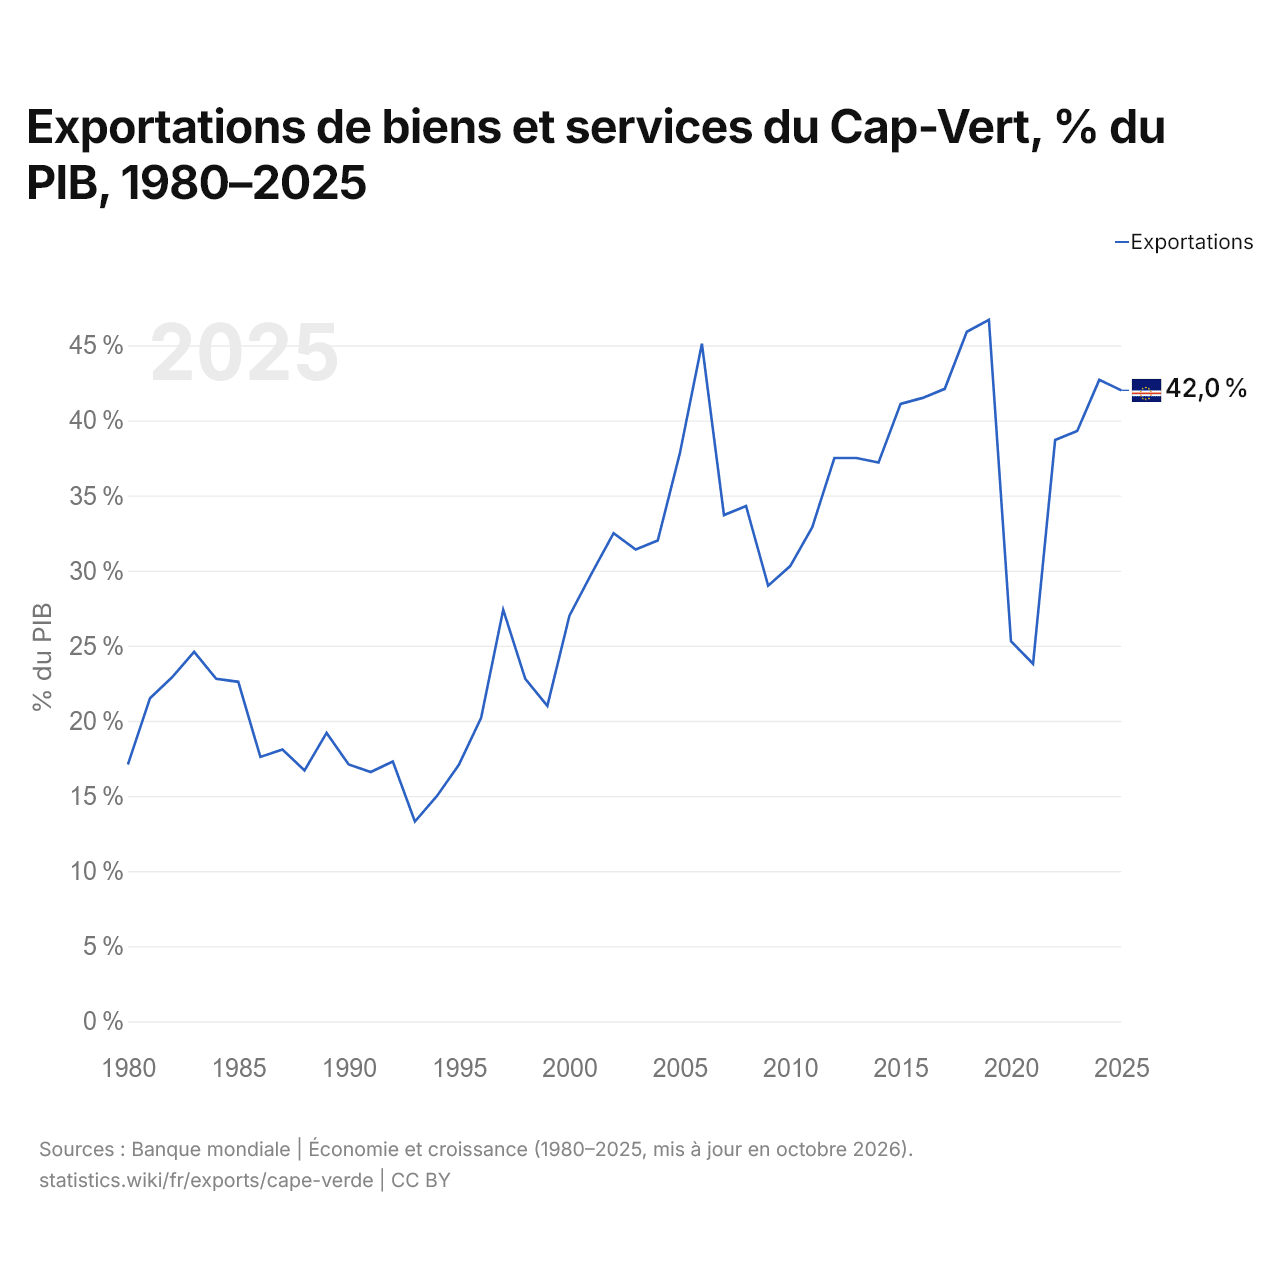
En 2025, les exportations de biens et services du Cap-Vert équivalaient à 42,0 % de son PIB, contre 17,1 % en 1980. La part la plus élevée a été de 46,7 %, en 2019.
Comparer les exportations du Cap-Vert avec celles d'autres pays
Sources :
- Banque mondiale | Économie et croissance (1977–2025, mis à jour en octobre 2026)
- TradeMap (2001–2025, mis à jour en octobre 2026)
Creative Commons Attribution (CC BY) : vous pouvez copier, partager, adapter et réutiliser ce contenu, y compris à des fins commerciales, à condition de citer statistics.wiki et d’indiquer les modifications apportées. Les sources citées ci-dessus peuvent avoir leurs propres conditions de licence.