
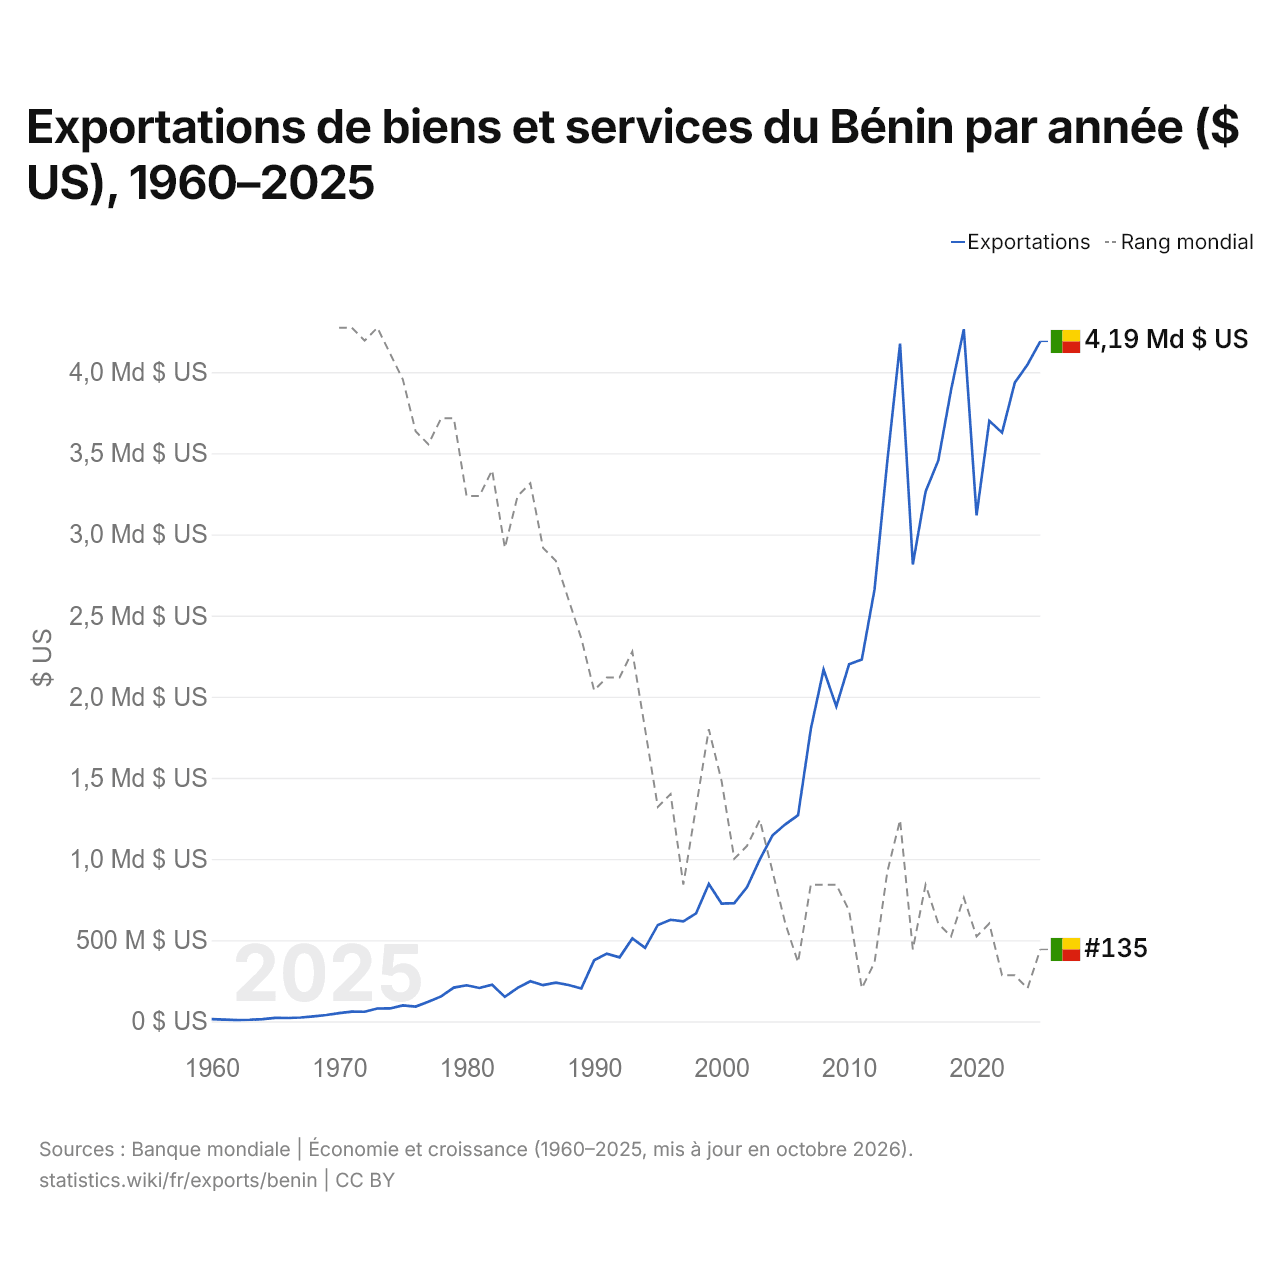
Exportations de biens et services du Bénin par année ($ US), 1960–2025
| Année | $ US | Rang mondial |
|---|---|---|
| Exportations | Rang mondial | |
| 2025 | 4 189 174 580 $ US | #135 |
| 2024 | 4 047 363 784 $ US | #138 |
| 2023 | 3 935 350 522 $ US | #137 |
| 2022 | 3 627 155 582 $ US | #137 |
| 2021 | 3 700 039 683 $ US | #133 |
| 2020 | 3 117 343 142 $ US | #134 |
| 2019 | 4 264 332 527 $ US | #131 |
| 2018 | 3 889 962 074 $ US | #134 |
| 2017 | 3 455 561 018 $ US | #133 |
| 2016 | 3 263 416 598 $ US | #130 |
| 2015 | 2 815 204 783 $ US | #135 |
| 2014 | 4 175 438 842 $ US | #125 |
| 2013 | 3 451 240 666 $ US | #129 |
| 2012 | 2 662 421 032 $ US | #136 |
| 2011 | 2 229 520 238 $ US | #138 |
| 2010 | 2 199 999 385 $ US | #132 |
| 2009 | 1 940 710 263 $ US | #130 |
| 2008 | 2 167 074 922 $ US | #130 |
| 2007 | 1 800 691 336 $ US | #130 |
| 2006 | 1 270 214 596 $ US | #136 |
| 2005 | 1 213 941 697 $ US | #133 |
| 2004 | 1 146 038 651 $ US | #129 |
| 2003 | 997 331 580 $ US | #125 |
| 2002 | 827 401 656 $ US | #127 |
| 2001 | 728 426 334 $ US | #128 |
| 2000 | 725 304 886 $ US | #122 |
| 1999 | 846 151 105 $ US | #118 |
| 1998 | 665 156 777 $ US | #124 |
| 1997 | 616 436 708 $ US | #130 |
| 1996 | 625 667 799 $ US | #123 |
| 1995 | 593 804 004 $ US | #124 |
| 1994 | 452 687 270 $ US | #118 |
| 1993 | 510 965 440 $ US | #112 |
| 1992 | 393 976 834 $ US | #114 |
| 1991 | 417 201 321 $ US | #114 |
| 1990 | 375 946 889 $ US | #115 |
| 1989 | 202 741 076 $ US | #111 |
| 1988 | 223 654 544 $ US | #108 |
| 1987 | 238 541 726 $ US | #105 |
| 1986 | 222 807 317 $ US | #104 |
| 1985 | 247 338 455 $ US | #99 |
| 1984 | 205 805 473 $ US | #100 |
| 1983 | 150 766 894 $ US | #104 |
| 1982 | 225 297 402 $ US | #98 |
| 1981 | 205 681 908 $ US | #100 |
| 1980 | 222 261 839 $ US | #100 |
| 1979 | 207 784 727 $ US | #94 |
| 1978 | 153 492 203 $ US | #94 |
| 1977 | 121 349 823 $ US | #96 |
| 1976 | 90 731 938 $ US | #95 |
| 1975 | 98 337 359 $ US | #91 |
| 1974 | 79 408 584 $ US | #89 |
| 1973 | 78 995 258 $ US | #87 |
| 1972 | 59 023 785 $ US | #88 |
| 1971 | 59 595 414 $ US | #87 |
| 1970 | 50 633 276 $ US | #87 |
| 1969 | 38 939 716 $ US | - |
| 1968 | 30 461 096 $ US | - |
| 1967 | 23 474 430 $ US | - |
| 1966 | 20 739 912 $ US | - |
| 1965 | 21 069 296 $ US | - |
| 1964 | 13 861 515 $ US | - |
| 1963 | 9 703 492 $ US | - |
| 1962 | 8 317 364 $ US | - |
| 1961 | 10 801 828 $ US | - |
| 1960 | 13 852 022 $ US | - |
En 2025, les exportations de biens et services du Bénin s'élevaient à 4,19 milliards de dollars, contre 13,9 millions de dollars en 1960. Le maximum a été de 4,26 milliards de dollars, en 2019. Elles se classaient au 135e rang mondial, en hausse par rapport au 138e rang en 2024. Leur meilleur rang a été le 87e, occupé pour la dernière fois en 1973.
En 2025, les exportations de biens et services du Bénin étaient les 32es plus élevées de 50 pays situés en Afrique (à égalité avec Madagascar). Les importations de biens et services du Bénin s'élevaient à 4,93 milliards de dollars en 2025, au 140e rang mondial. En 2025, les importations du Bénin dépassaient ses exportations de 740 millions de dollars, soit un déficit commercial.
Exportations de biens du Bénin par catégorie, 2025
Exportations de biens, 2025: 827 M $US
En 2025, la première catégorie des exportations de biens du Bénin était « textiles, vêtements, chaussures, meubles et jouets », avec 53,4 %, suivie de « aliments transformés, huiles, aliments pour animaux, boissons et tabac », avec 16,5 %.
Destinations des exportations de biens du Bénin : les 10 premières, 2025
| Rang | Pays | Exportations de biens | Part | |
|---|---|---|---|---|
| 1 |
 Bangladesh |
342 M $US | 41,4 % | |
| 2 |
 Inde |
66,0 M $US | 7,98 % | |
| 3 |
 États-Unis |
53,3 M $US | 6,45 % | |
| 4 |
 France |
39,8 M $US | 4,81 % | vs France |
| 5 |
 Tchad |
31,9 M $US | 3,86 % | vs Tchad |
| 6 |
 Nigeria |
31,8 M $US | 3,84 % | |
| 7 |
 EAU |
27,4 M $US | 3,32 % | |
| 8 |
 Togo |
21,2 M $US | 2,57 % | vs Togo |
| 9 |
 Chine |
19,8 M $US | 2,39 % | |
| 10 |
 Burkina Faso |
19,1 M $US | 2,31 % | vs Burkina Faso |
| Autres partenaires et non précisés | 175 M $US | 21,1 % |
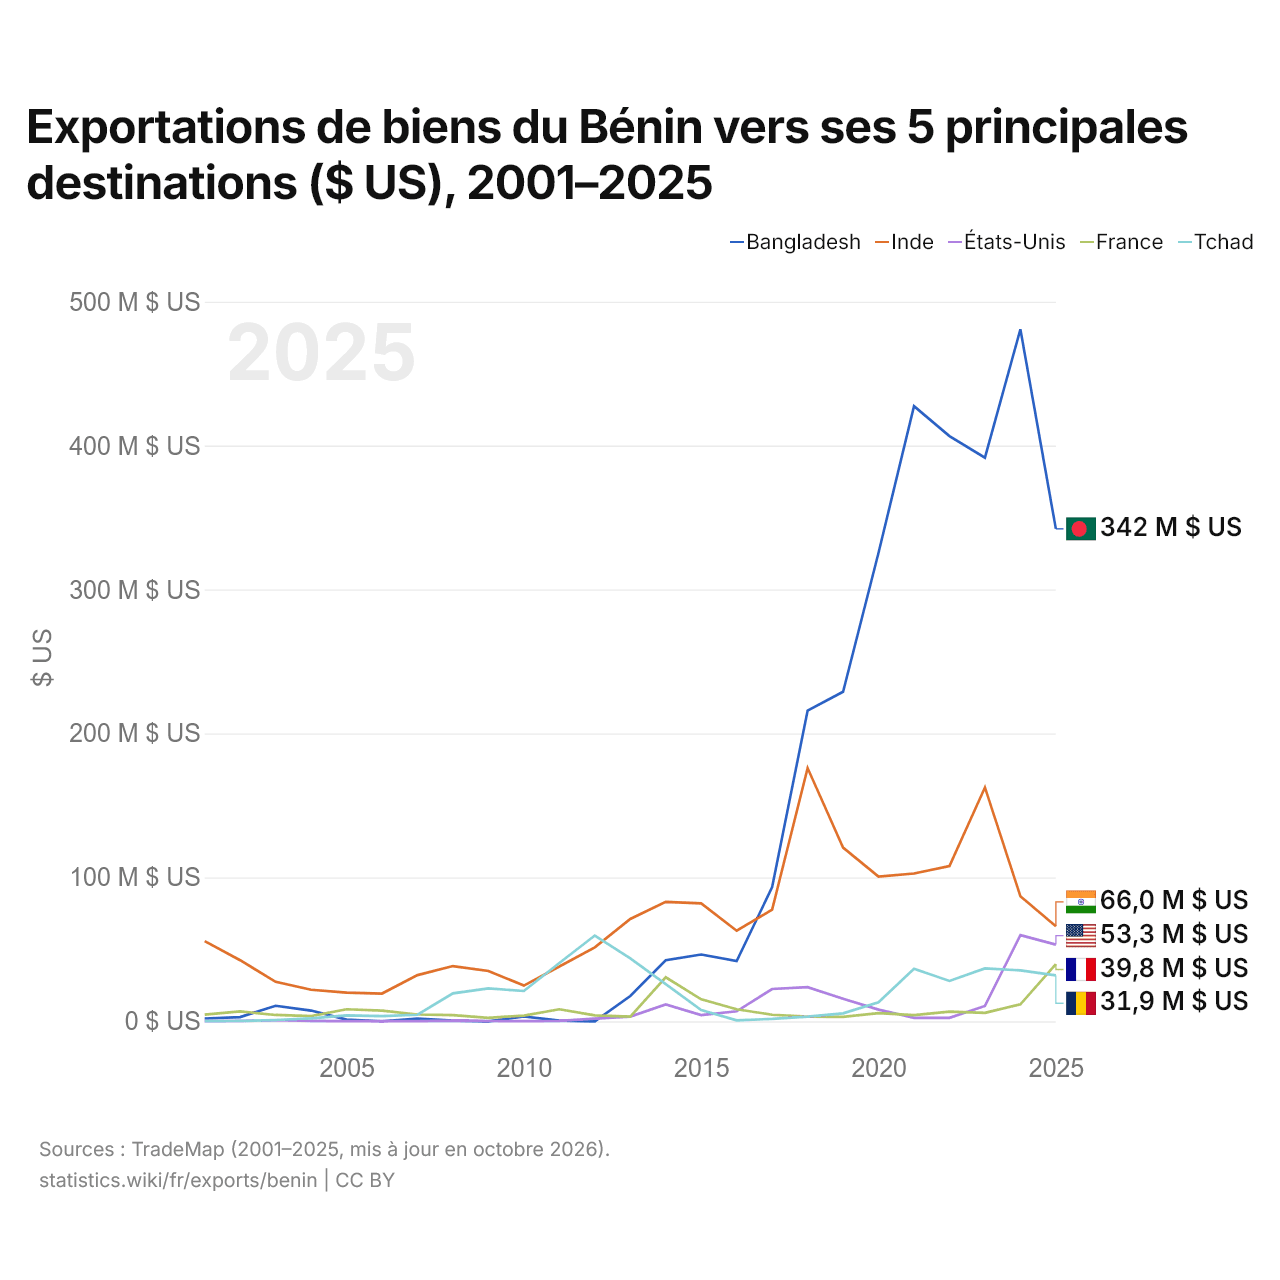
Exportations de biens du Bénin vers ses 5 principales destinations ($ US), 2001–2025
| Année | $ US | ||||
|---|---|---|---|---|---|
| Bangladesh | Inde | États-Unis | France | Tchad | |
| 2025 | 342 132 000 $ US | 66 045 000 $ US | 53 310 000 $ US | 39 780 000 $ US | 31 928 000 $ US |
| 2024 | 480 810 000 $ US | 86 889 000 $ US | 59 892 000 $ US | 11 833 000 $ US | 35 395 000 $ US |
| 2023 | 391 628 000 $ US | 162 495 000 $ US | 10 670 000 $ US | 5 897 000 $ US | 36 798 000 $ US |
| 2022 | 406 570 000 $ US | 107 937 000 $ US | 2 391 000 $ US | 6 739 000 $ US | 28 049 000 $ US |
| 2021 | 427 386 000 $ US | 102 698 000 $ US | 2 452 000 $ US | 4 289 000 $ US | 36 601 000 $ US |
| 2020 | 325 564 000 $ US | 100 513 000 $ US | 8 139 000 $ US | 5 704 000 $ US | 13 302 000 $ US |
| 2019 | 228 950 000 $ US | 120 724 000 $ US | 15 627 000 $ US | 3 107 000 $ US | 5 522 000 $ US |
| 2018 | 215 866 000 $ US | 175 968 000 $ US | 23 714 000 $ US | 3 311 000 $ US | 3 301 000 $ US |
| 2017 | 93 239 000 $ US | 77 550 000 $ US | 22 456 000 $ US | 4 575 000 $ US | 1 699 000 $ US |
| 2016 | 41 831 000 $ US | 62 948 000 $ US | 6 982 000 $ US | 8 380 000 $ US | 721 000 $ US |
| 2015 | 46 447 000 $ US | 82 000 000 $ US | 4 297 000 $ US | 15 252 000 $ US | 7 838 000 $ US |
| 2014 | 42 471 000 $ US | 82 993 000 $ US | 11 738 000 $ US | 30 608 000 $ US | 25 895 000 $ US |
| 2013 | 17 594 000 $ US | 71 101 000 $ US | 3 281 000 $ US | 3 237 000 $ US | 43 730 000 $ US |
| 2012 | 5 000 $ US | 51 401 000 $ US | 1 889 000 $ US | 4 179 000 $ US | 59 601 000 $ US |
| 2011 | 526 000 $ US | 38 114 000 $ US | 313 000 $ US | 8 369 000 $ US | 40 565 000 $ US |
| 2010 | 3 379 000 $ US | 24 825 000 $ US | 105 000 $ US | 4 013 000 $ US | 21 069 000 $ US |
| 2009 | 18 000 $ US | 34 992 000 $ US | 205 000 $ US | 2 459 000 $ US | 22 887 000 $ US |
| 2008 | 482 000 $ US | 38 400 000 $ US | 483 000 $ US | 4 300 000 $ US | 19 470 000 $ US |
| 2007 | 1 934 000 $ US | 32 113 000 $ US | 162 000 $ US | 4 775 000 $ US | 4 561 000 $ US |
| 2006 | 50 000 $ US | 19 292 000 $ US | 179 000 $ US | 7 418 000 $ US | 3 584 000 $ US |
| 2005 | 1 197 000 $ US | 19 906 000 $ US | 124 000 $ US | 8 417 000 $ US | 4 145 000 $ US |
| 2004 | 7 488 000 $ US | 21 934 000 $ US | 285 000 $ US | 3 595 000 $ US | 2 043 000 $ US |
| 2003 | 10 817 000 $ US | 27 442 000 $ US | 739 000 $ US | 4 432 000 $ US | 924 000 $ US |
| 2002 | 2 966 000 $ US | 42 462 000 $ US | 359 000 $ US | 6 884 000 $ US | 225 000 $ US |
| 2001 | 1 957 000 $ US | 55 684 000 $ US | 148 000 $ US | 4 689 000 $ US | 240 000 $ US |
En 2025, les exportations de biens s'élevaient à 342 millions de dollars vers le Bangladesh, 66 millions de dollars vers l'Inde, 53,3 millions de dollars vers les États-Unis, 39,8 millions de dollars vers la France et 31,9 millions de dollars vers le Tchad. Le premier rang des cinq destinations du Bénin est occupé par le Bangladesh depuis 2017. Le changement le plus récent dans leur ordre remonte à 2025, quand les exportations du Bénin vers la France ont dépassé celles vers le Tchad.
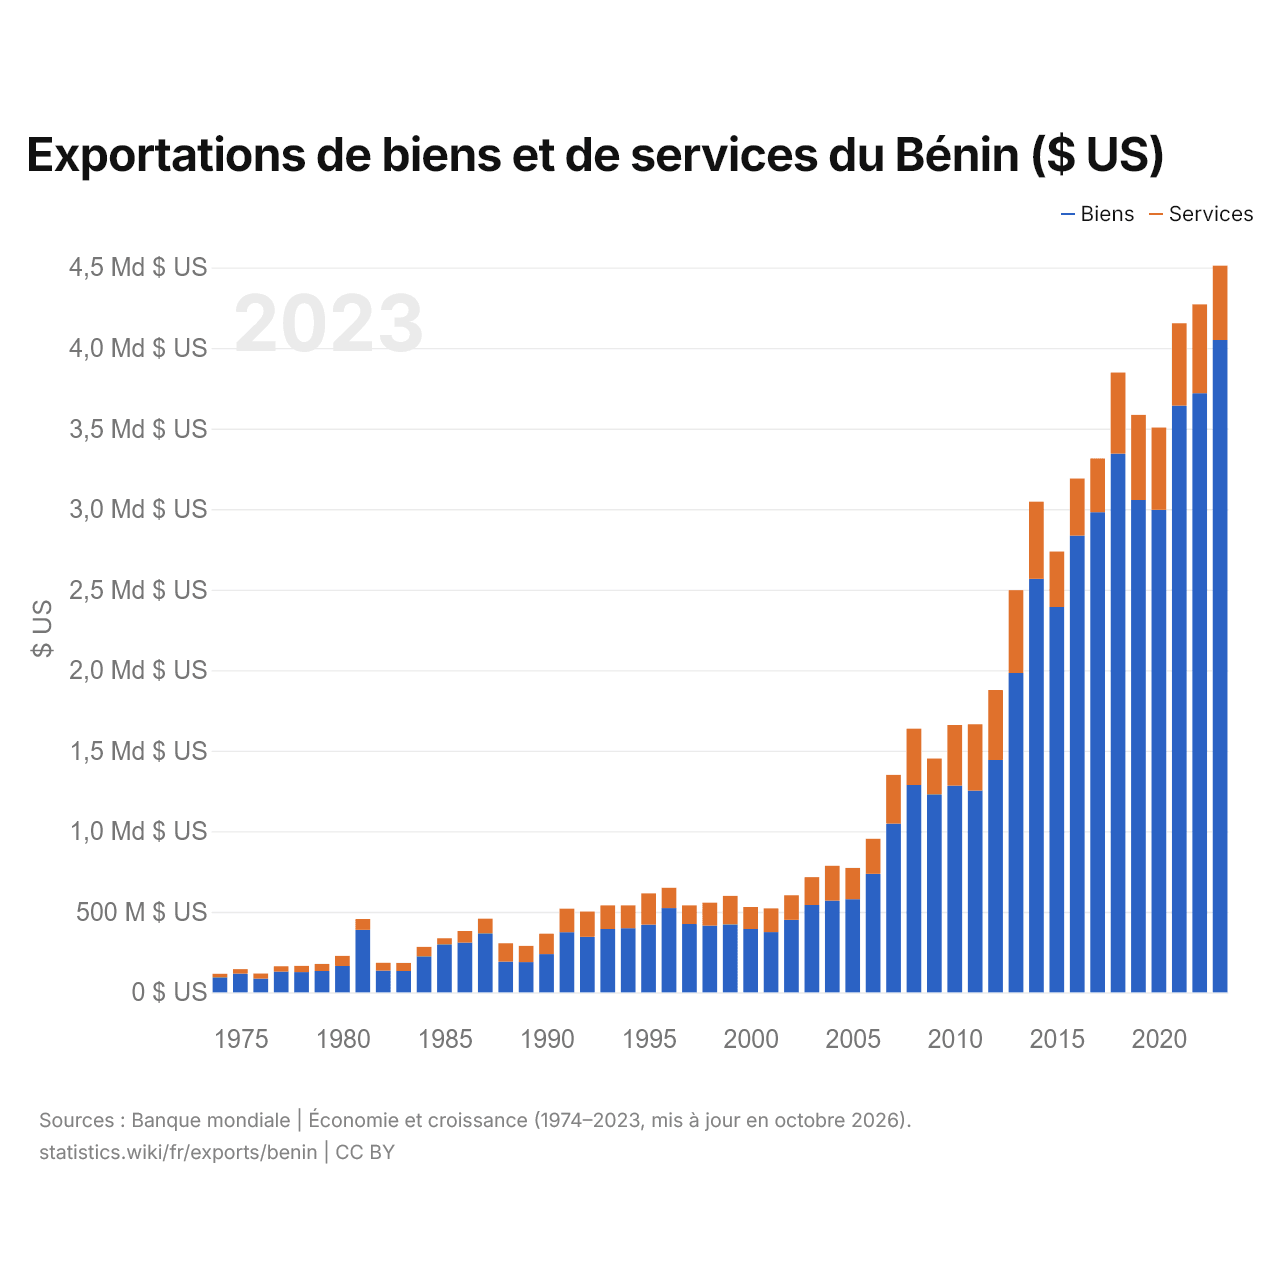
Exportations de biens et de services du Bénin ($ US)
| Année | $ US | |
|---|---|---|
| Biens | Services | |
| 2023 | 4 050 150 171 $ US | 461 100 623 $ US |
| 2022 | 3 719 074 098 $ US | 552 140 572 $ US |
| 2021 | 3 642 106 898 $ US | 511 584 205 $ US |
| 2020 | 2 995 822 076 $ US | 510 372 004 $ US |
| 2019 | 3 056 477 196 $ US | 528 456 762 $ US |
| 2018 | 3 344 316 328 $ US | 503 303 056 $ US |
| 2017 | 2 980 590 514 $ US | 333 738 030 $ US |
| 2016 | 2 835 518 188 $ US | 354 175 517 $ US |
| 2015 | 2 392 374 855 $ US | 344 117 345 $ US |
| 2014 | 2 566 617 493 $ US | 479 237 848 $ US |
| 2013 | 1 982 438 623 $ US | 514 533 010 $ US |
| 2012 | 1 442 539 725 $ US | 433 912 741 $ US |
| 2011 | 1 252 444 989 $ US | 411 695 970 $ US |
| 2010 | 1 282 783 671 $ US | 376 827 329 $ US |
| 2009 | 1 229 494 123 $ US | 221 825 343 $ US |
| 2008 | 1 287 372 078 $ US | 349 443 914 $ US |
| 2007 | 1 048 143 874 $ US | 301 934 432 $ US |
| 2006 | 736 112 437 $ US | 217 261 548 $ US |
| 2005 | 578 343 032 $ US | 193 842 350 $ US |
| 2004 | 569 568 439 $ US | 216 028 416 $ US |
| 2003 | 542 039 309 $ US | 172 723 650 $ US |
| 2002 | 449 946 157 $ US | 152 901 799 $ US |
| 2001 | 373 840 200 $ US | 147 228 754 $ US |
| 2000 | 393 306 762 $ US | 136 392 442 $ US |
| 1999 | 421 600 058 $ US | 176 925 614 $ US |
| 1998 | 414 271 319 $ US | 142 333 668 $ US |
| 1997 | 424 023 277 $ US | 115 992 038 $ US |
| 1996 | 522 869 181 $ US | 126 149 337 $ US |
| 1995 | 419 936 214 $ US | 194 329 572 $ US |
| 1994 | 397 904 596 $ US | 142 168 286 $ US |
| 1993 | 393 479 252 $ US | 146 567 742 $ US |
| 1992 | 345 078 691 $ US | 156 048 279 $ US |
| 1991 | 373 533 213 $ US | 145 987 563 $ US |
| 1990 | 237 493 803 $ US | 126 367 424 $ US |
| 1989 | 187 904 202 $ US | 100 473 248 $ US |
| 1988 | 190 194 188 $ US | 114 352 203 $ US |
| 1987 | 366 344 777 $ US | 90 837 533 $ US |
| 1986 | 308 686 623 $ US | 71 612 987 $ US |
| 1985 | 297 821 123 $ US | 37 617 167 $ US |
| 1984 | 223 820 822 $ US | 58 321 573 $ US |
| 1983 | 132 297 280 $ US | 50 167 158 $ US |
| 1982 | 135 356 524 $ US | 48 008 825 $ US |
| 1981 | 388 037 524 $ US | 66 808 608 $ US |
| 1980 | 163 953 393 $ US | 62 287 144 $ US |
| 1979 | 132 906 081 $ US | 43 361 831 $ US |
| 1978 | 125 562 881 $ US | 38 673 935 $ US |
| 1977 | 129 062 359 $ US | 32 546 443 $ US |
| 1976 | 85 858 789 $ US | 30 830 654 $ US |
| 1975 | 116 096 604 $ US | 28 131 764 $ US |
| 1974 | 92 985 318 $ US | 22 014 529 $ US |
Les exportations de biens du Bénin s'élèvent à 4,05 milliards de dollars (2023) et celles de services à 461 millions de dollars ; les services représentent 10,2 % du total, contre 19,1 % en 1974.
Le Bénin dans le classement mondial des exportations, 2025
| Rang | Pays | Exportations | Part mondiale | |
|---|---|---|---|---|
| 132 |
 Djibouti |
5,11 Md $US | 0,01 % | |
| 133 |
 Îles Caïmans |
5,04 Md $US (2024) | 0,02 % | |
| 134 |
 Mauritanie |
4,65 Md $US | 0,01 % | |
| 135 |
 Bénin |
4,19 Md $US | 0,01 % | |
| 136 |
 Madagascar |
4,19 Md $US | 0,01 % | |
| 137 |
 Népal |
4,02 Md $US | 0,01 % | |
| 138 |
 Somalie |
3,80 Md $US | 0,01 % |
Exportations de biens et services du Bénin, % du PIB, 1960–2025
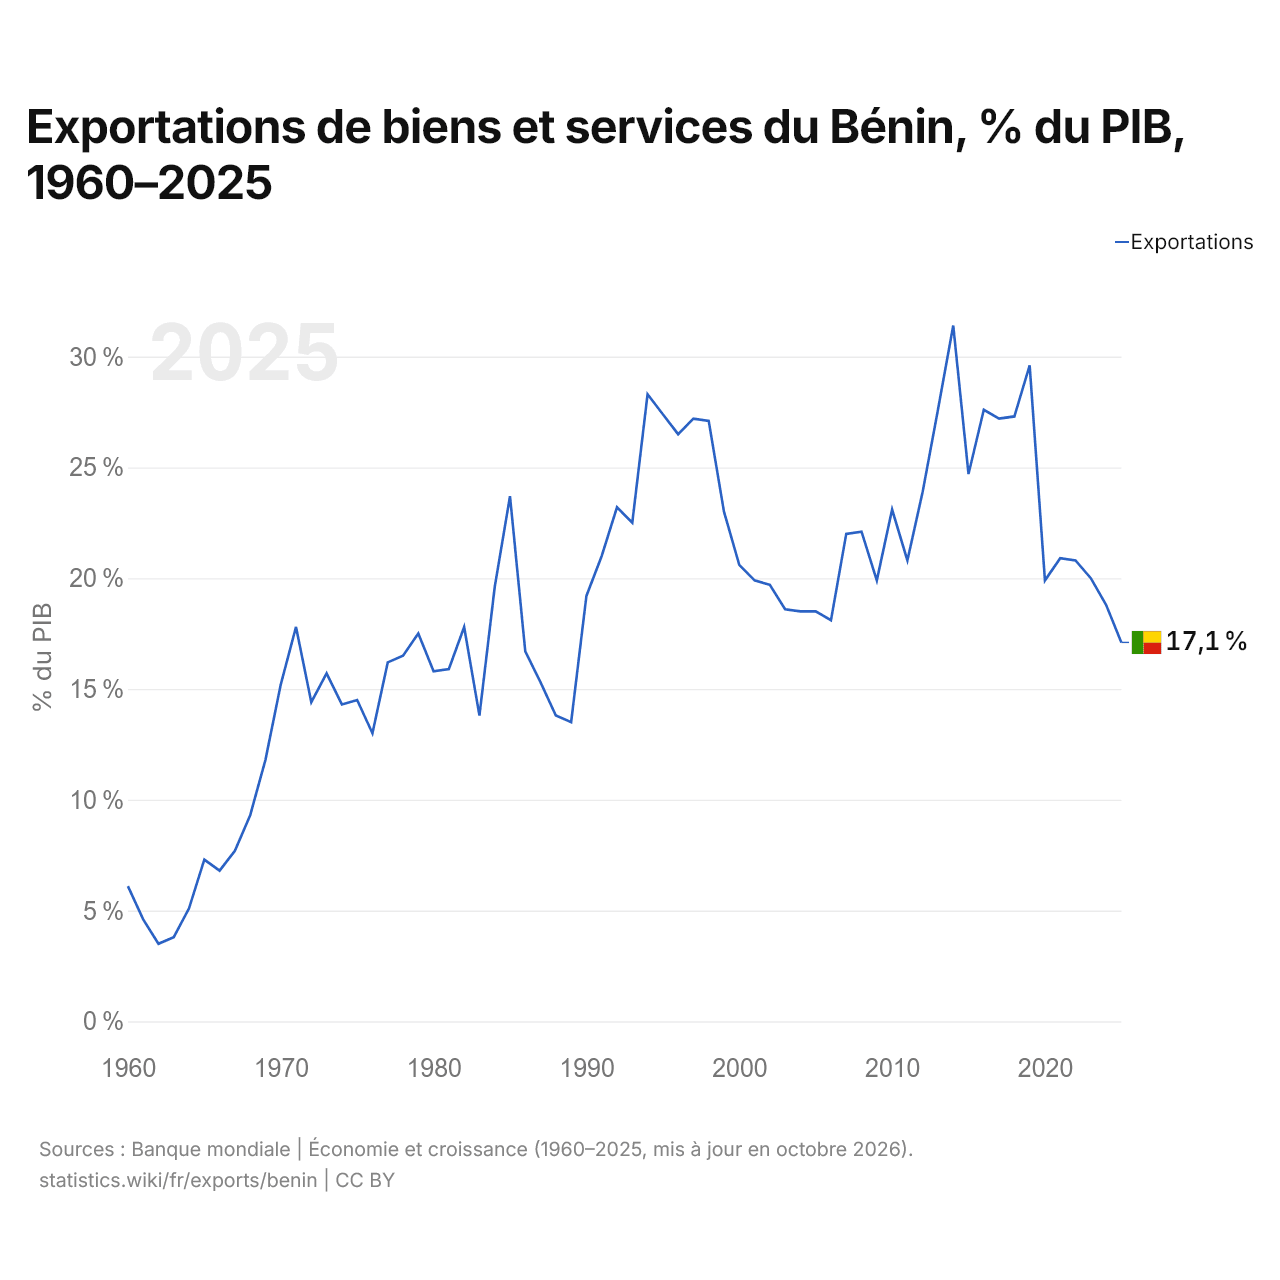
En 2025, les exportations de biens et services du Bénin équivalaient à 17,1 % de son PIB, contre 6,1 % en 1960. La part la plus élevée a été de 31,4 %, en 2014.
Comparer les exportations du Bénin avec celles d'autres pays
Sources :
- Banque mondiale | Économie et croissance (1960–2025, mis à jour en octobre 2026)
- TradeMap (2001–2025, mis à jour en octobre 2026)
Creative Commons Attribution (CC BY) : vous pouvez copier, partager, adapter et réutiliser ce contenu, y compris à des fins commerciales, à condition de citer statistics.wiki et d’indiquer les modifications apportées. Les sources citées ci-dessus peuvent avoir leurs propres conditions de licence.