
Exportations de biens et services de l'Inde par année ($ US), 1960–2025
| Année | $ US | Rang mondial |
|---|---|---|
| Exportations | Rang mondial | |
| 2025 | 880 740 846 622 $ US | #10 |
| 2024 | 829 785 193 474 $ US | #11 |
| 2023 | 782 620 610 192 $ US | #9 |
| 2022 | 781 290 791 564 $ US | #10 |
| 2021 | 677 769 255 429 $ US | #12 |
| 2020 | 499 728 529 073 $ US | #12 |
| 2019 | 529 245 063 167 $ US | #13 |
| 2018 | 538 635 186 135 $ US | #12 |
| 2017 | 498 258 808 232 $ US | #12 |
| 2016 | 439 642 578 076 $ US | #13 |
| 2015 | 416 787 940 848 $ US | #13 |
| 2014 | 468 345 815 421 $ US | #14 |
| 2013 | 472 180 271 340 $ US | #14 |
| 2012 | 448 400 477 361 $ US | #14 |
| 2011 | 447 384 417 625 $ US | #14 |
| 2010 | 375 353 514 026 $ US | #14 |
| 2009 | 273 752 124 889 $ US | #16 |
| 2008 | 288 902 044 821 $ US | #19 |
| 2007 | 253 077 526 013 $ US | #18 |
| 2006 | 199 973 922 364 $ US | #20 |
| 2005 | 160 838 260 681 $ US | #22 |
| 2004 | 126 648 472 021 $ US | #23 |
| 2003 | 90 838 575 244 $ US | #26 |
| 2002 | 73 452 895 952 $ US | #27 |
| 2001 | 60 963 415 577 $ US | #29 |
| 2000 | 60 878 472 821 $ US | #29 |
| 1999 | 52 544 483 403 $ US | #28 |
| 1998 | 46 426 465 025 $ US | #30 |
| 1997 | 44 459 225 643 $ US | #31 |
| 1996 | 40 803 004 618 $ US | #31 |
| 1995 | 39 068 855 118 $ US | #31 |
| 1994 | 32 361 214 431 $ US | #30 |
| 1993 | 27 466 541 463 $ US | #31 |
| 1992 | 25 486 029 047 $ US | #32 |
| 1991 | 22 943 398 073 $ US | #32 |
| 1990 | 22 639 774 912 $ US | #32 |
| 1989 | 20 770 696 112 $ US | #32 |
| 1988 | 17 899 838 409 $ US | #30 |
| 1987 | 15 638 662 914 $ US | #29 |
| 1986 | 12 937 864 154 $ US | #29 |
| 1985 | 12 217 447 522 $ US | #31 |
| 1984 | 13 330 716 432 $ US | #31 |
| 1983 | 12 741 335 281 $ US | #31 |
| 1982 | 12 009 417 677 $ US | #31 |
| 1981 | 11 485 699 151 $ US | #33 |
| 1980 | 11 439 738 400 $ US | #33 |
| 1979 | 10 326 638 766 $ US | #33 |
| 1978 | 8 670 401 540 $ US | #31 |
| 1977 | 7 754 701 054 $ US | #31 |
| 1976 | 6 868 148 773 $ US | #31 |
| 1975 | 5 560 878 503 $ US | #30 |
| 1974 | 4 808 449 430 $ US | #32 |
| 1973 | 3 599 236 351 $ US | #29 |
| 1972 | 2 878 233 145 $ US | #28 |
| 1971 | 2 469 914 214 $ US | #27 |
| 1970 | 2 361 333 333 $ US | #24 |
| 1969 | 2 170 666 667 $ US | - |
| 1968 | 2 144 000 000 $ US | - |
| 1967 | 2 022 666 667 $ US | - |
| 1966 | 1 888 225 565 $ US | - |
| 1965 | 1 969 801 970 $ US | - |
| 1964 | 2 104 202 104 $ US | - |
| 1963 | 2 072 702 073 $ US | - |
| 1962 | 1 757 701 758 $ US | - |
| 1961 | 1 688 401 688 $ US | - |
| 1960 | 1 652 701 653 $ US | - |
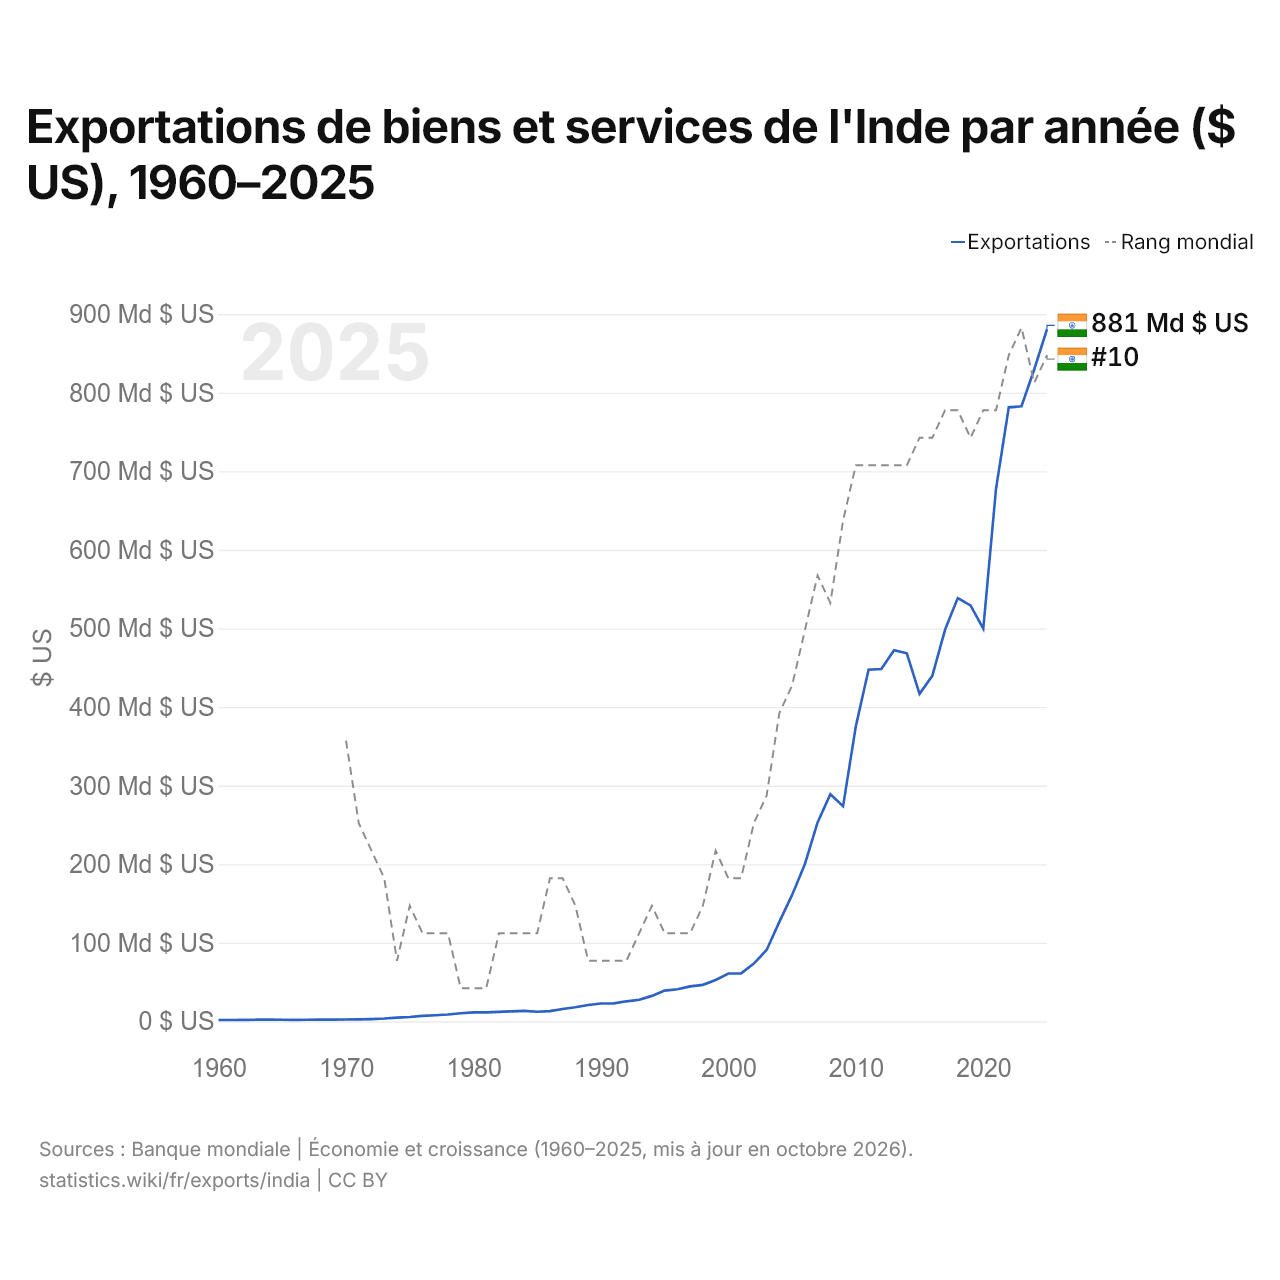
En 2025, les exportations de biens et services de l'Inde s'élevaient à 881 milliards de dollars, contre 1,65 milliard de dollars en 1960. Elles se classaient au 10e rang mondial, en hausse par rapport au 11e rang en 2024. Leur meilleur rang a été le 9e, occupé pour la dernière fois en 2023.
En 2025, les exportations de biens et services de l'Inde étaient les 4es plus élevées de 44 pays situés en Asie. Les importations de biens et services de l'Inde s'élevaient à 950 milliards de dollars en 2025, au 7e rang mondial. En 2025, les importations de l'Inde dépassaient ses exportations de 68,9 milliards de dollars, soit un déficit commercial.
Exportations de biens de l'Inde par catégorie, 2025
Exportations de biens, 2025: 447 Md $US
En 2025, la première catégorie des exportations de biens de l'Inde était « machines, électronique et véhicules », avec 28,5 %, suivie de « pétrole, gaz, minerais et autres matières premières », avec 16,9 %.
Destinations des exportations de biens de l'Inde : les 10 premières, 2025
| Rang | Pays | Exportations de biens | Part | |
|---|---|---|---|---|
| 1 |
 États-Unis |
92,5 Md $US | 20,7 % | vs USA |
| 2 |
 EAU |
38,7 Md $US | 8,68 % | vs EAU |
| 3 |
 Pays-Bas |
19,2 Md $US | 4,3 % | |
| 4 |
 Chine |
18,1 Md $US | 4,06 % | vs Chine |
| 5 |
 Royaume-Uni |
13,8 Md $US | 3,09 % | vs R.-U. |
| 6 |
 Allemagne |
11,4 Md $US | 2,54 % | vs Allemagne |
| 7 |
 Bangladesh |
11,2 Md $US | 2,51 % | vs Bangladesh |
| 8 |
 Arabie saoudite |
10,8 Md $US | 2,42 % | vs Arabie saoudite |
| 9 |
 Singapour |
10,7 Md $US | 2,4 % | |
| 10 |
 Australie |
7,78 Md $US | 1,74 % | vs Australie |
| Autres partenaires et non précisés | 212 Md $US | 47,5 % |
Exportations de biens de l'Inde vers ses 5 principales destinations ($ US), 2001–2025
| Année | $ US | ||||
|---|---|---|---|---|---|
| États-Unis | Émirats arabes unis | Pays-Bas | Chine | Royaume-Uni | |
| 2025 | 92 535 130 000 $ US | 38 746 609 000 $ US | 19 190 790 000 $ US | 18 147 723 000 $ US | 13 776 245 000 $ US |
| 2024 | 80 163 046 000 $ US | 37 248 674 000 $ US | 24 021 101 000 $ US | 15 113 549 000 $ US | 14 295 176 000 $ US |
| 2023 | 75 800 851 000 $ US | 33 025 382 000 $ US | 23 108 248 000 $ US | 16 236 414 000 $ US | 12 421 490 000 $ US |
| 2022 | 80 230 193 000 $ US | 31 322 728 000 $ US | 18 500 438 000 $ US | 15 084 401 000 $ US | 11 235 450 000 $ US |
| 2021 | 71 510 497 000 $ US | 25 446 639 000 $ US | 10 284 461 000 $ US | 23 036 597 000 $ US | 10 374 395 000 $ US |
| 2020 | 49 320 596 000 $ US | 17 953 335 000 $ US | 6 261 190 000 $ US | 19 008 267 000 $ US | 7 767 620 000 $ US |
| 2019 | 54 288 194 000 $ US | 29 539 358 000 $ US | 8 906 975 000 $ US | 17 278 833 000 $ US | 8 797 200 000 $ US |
| 2018 | 51 764 145 000 $ US | 29 100 195 000 $ US | 8 677 864 000 $ US | 16 503 442 000 $ US | 9 767 380 000 $ US |
| 2017 | 46 028 324 000 $ US | 30 020 630 000 $ US | 5 432 400 000 $ US | 12 500 767 000 $ US | 8 957 197 000 $ US |
| 2016 | 41 982 373 000 $ US | 30 675 031 000 $ US | 4 867 884 000 $ US | 8 914 967 000 $ US | 8 564 111 000 $ US |
| 2015 | 40 339 244 000 $ US | 30 240 227 000 $ US | 4 873 383 000 $ US | 9 539 517 000 $ US | 8 889 807 000 $ US |
| 2014 | 42 684 740 000 $ US | 32 919 602 000 $ US | 6 762 223 000 $ US | 13 434 251 000 $ US | 9 665 339 000 $ US |
| 2013 | 41 956 732 000 $ US | 33 980 431 000 $ US | 9 170 038 000 $ US | 16 416 825 000 $ US | 10 559 406 000 $ US |
| 2012 | 37 170 686 000 $ US | 35 781 394 000 $ US | 9 466 429 000 $ US | 14 729 317 000 $ US | 8 100 177 000 $ US |
| 2011 | 32 919 043 000 $ US | 37 369 375 000 $ US | 9 693 191 000 $ US | 16 717 786 000 $ US | 8 879 115 000 $ US |
| 2010 | 23 587 442 000 $ US | 27 412 253 000 $ US | 6 572 932 000 $ US | 17 439 991 000 $ US | 6 436 413 000 $ US |
| 2009 | 19 128 200 000 $ US | 25 415 975 000 $ US | 6 464 920 000 $ US | 10 370 052 000 $ US | 6 528 851 000 $ US |
| 2008 | 21 407 125 000 $ US | 19 096 532 000 $ US | 6 528 600 000 $ US | 10 093 927 000 $ US | 6 597 521 000 $ US |
| 2007 | 20 133 334 000 $ US | 14 447 008 000 $ US | 4 343 000 000 $ US | 9 491 978 000 $ US | 6 286 914 000 $ US |
| 2006 | 18 705 452 000 $ US | 11 451 552 000 $ US | 2 470 297 000 $ US | 7 829 168 000 $ US | 5 383 829 000 $ US |
| 2005 | 16 542 685 000 $ US | 8 421 648 000 $ US | 2 396 432 000 $ US | 7 183 792 000 $ US | 4 958 861 000 $ US |
| 2004 | 13 105 037 000 $ US | 6 644 331 000 $ US | 1 458 323 000 $ US | 4 098 514 000 $ US | 3 409 431 000 $ US |
| 2003 | 11 186 815 000 $ US | 4 231 878 000 $ US | 1 242 940 000 $ US | 2 567 162 000 $ US | 2 769 374 000 $ US |
| 2002 | 10 388 760 000 $ US | 3 107 769 000 $ US | 969 347 000 $ US | 1 531 604 000 $ US | 2 409 057 000 $ US |
| 2001 | 8 404 056 000 $ US | 2 569 490 000 $ US | 857 303 000 $ US | 922 542 000 $ US | 2 196 629 000 $ US |
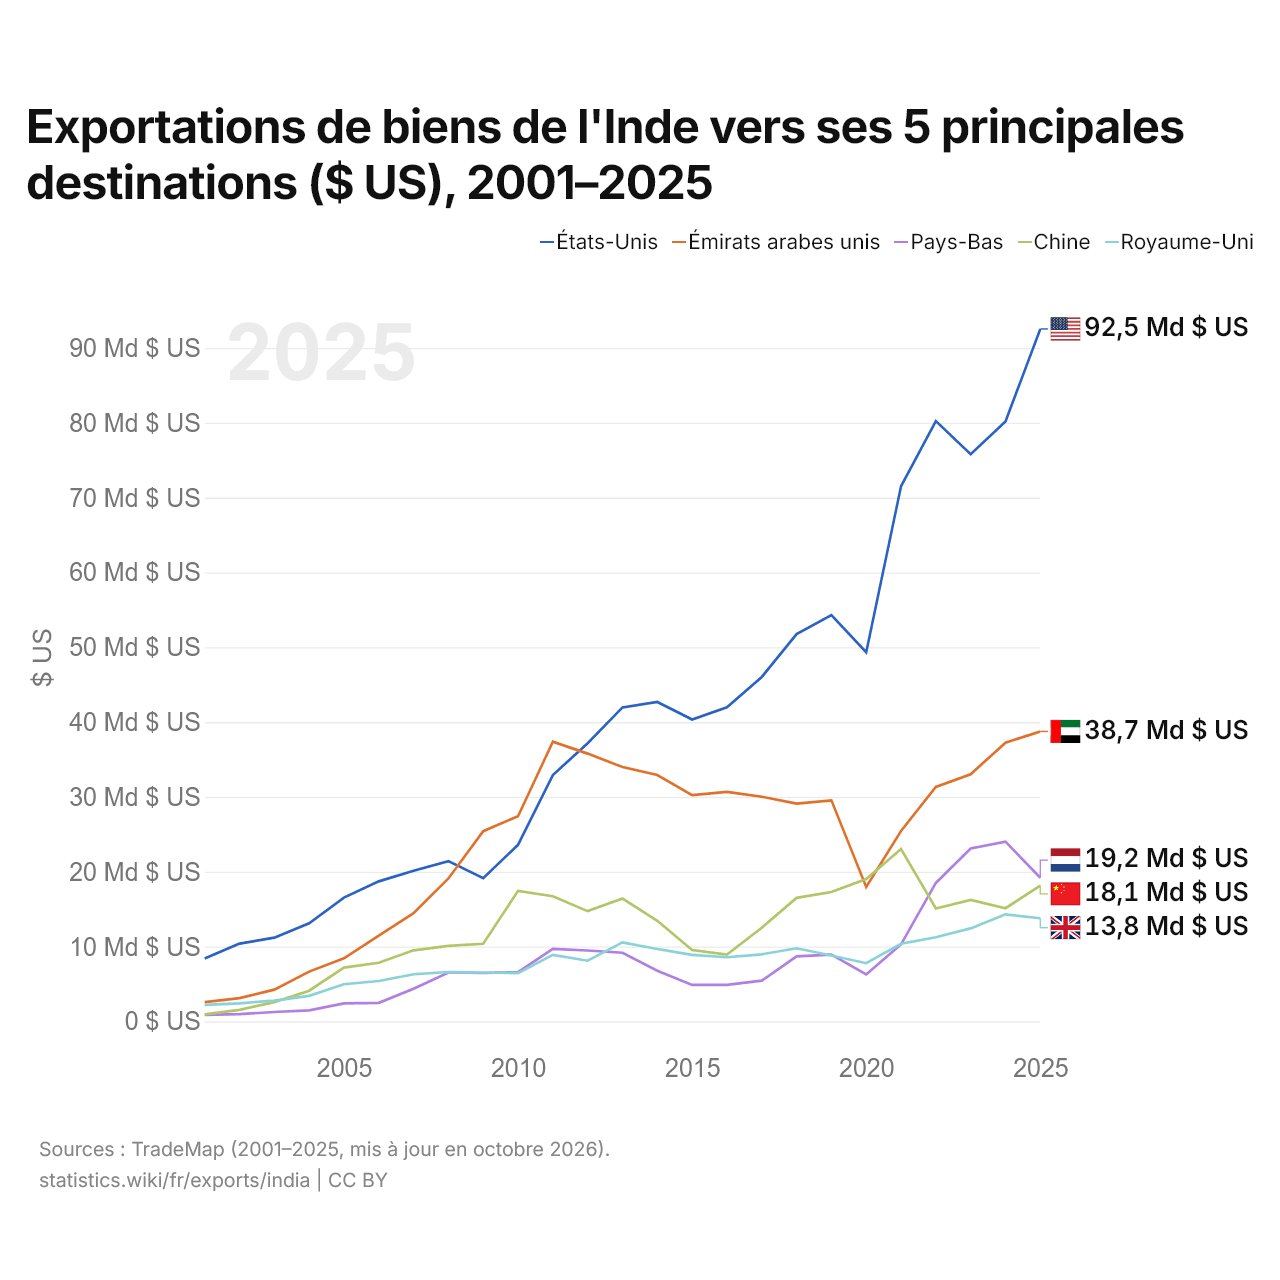
En 2025, les exportations de biens s'élevaient à 92,5 milliards de dollars vers les États-Unis, 38,7 milliards de dollars vers les Émirats arabes unis, 19,2 milliards de dollars vers les Pays-Bas, 18,1 milliards de dollars vers la Chine et 13,8 milliards de dollars vers le Royaume-Uni. Le premier rang des cinq destinations de l'Inde est occupé par les États-Unis depuis 2012. Le changement le plus récent dans leur ordre remonte à 2022, quand les exportations de l'Inde vers les Pays-Bas ont dépassé celles vers la Chine.
Exportations de biens et de services de l'Inde ($ US), 1975–2025
| Année | $ US | |
|---|---|---|
| Biens | Services | |
| 2025 | 449 464 856 939 $ US | 412 252 828 325 $ US |
| 2024 | 447 258 013 904 $ US | 374 883 177 956 $ US |
| 2023 | 435 637 534 735 $ US | 337 539 689 383 $ US |
| 2022 | 458 271 959 749 $ US | 309 371 095 953 $ US |
| 2021 | 402 424 358 111 $ US | 240 655 457 528 $ US |
| 2020 | 281 545 477 868 $ US | 203 145 151 682 $ US |
| 2019 | 331 271 580 797 $ US | 214 761 539 671 $ US |
| 2018 | 332 086 853 293 $ US | 204 955 578 854 $ US |
| 2017 | 304 106 898 883 $ US | 185 294 014 277 $ US |
| 2016 | 268 614 705 000 $ US | 161 818 782 928 $ US |
| 2015 | 272 352 729 600 $ US | 156 278 173 576 $ US |
| 2014 | 328 386 908 294 $ US | 157 196 138 164 $ US |
| 2013 | 319 109 794 565 $ US | 149 163 631 866 $ US |
| 2012 | 298 320 584 200 $ US | 145 524 596 558 $ US |
| 2011 | 307 847 488 406 $ US | 138 527 915 665 $ US |
| 2010 | 230 967 060 095 $ US | 117 068 311 674 $ US |
| 2009 | 167 957 671 240 $ US | 92 889 486 182 $ US |
| 2008 | 199 065 097 558 $ US | 106 054 239 105 $ US |
| 2007 | 153 529 580 290 $ US | 86 552 459 544 $ US |
| 2006 | 123 876 214 466 $ US | 69 439 848 438 $ US |
| 2005 | 102 403 079 760 $ US | 52 178 951 919 $ US |
| 2004 | 77 921 854 646 $ US | 38 097 905 007 $ US |
| 2003 | 60 893 318 399 $ US | 23 901 712 153 $ US |
| 2002 | 51 141 118 294 $ US | 19 478 164 642 $ US |
| 2001 | 44 793 193 849 $ US | 17 337 028 679 $ US |
| 2000 | 43 246 625 500 $ US | 16 685 072 488 $ US |
| 1999 | 36 877 276 369 $ US | 14 508 990 007 $ US |
| 1998 | 34 075 707 693 $ US | 11 691 135 747 $ US |
| 1997 | 35 702 052 076 $ US | 9 110 607 257 $ US |
| 1996 | 33 737 287 503 $ US | 7 238 385 384 $ US |
| 1995 | 31 238 525 606 $ US | 6 774 717 629 $ US |
| 1994 | 25 522 526 248 $ US | 6 038 145 747 $ US |
| 1993 | 22 015 873 054 $ US | 5 107 023 139 $ US |
| 1992 | 20 019 380 807 $ US | 4 934 088 263 $ US |
| 1991 | 18 094 877 656 $ US | 4 925 463 517 $ US |
| 1990 | 18 286 186 694 $ US | 4 624 863 458 $ US |
| 1989 | 16 143 880 746 $ US | 4 139 799 057 $ US |
| 1988 | 13 509 794 583 $ US | 3 791 282 738 $ US |
| 1987 | 11 884 034 801 $ US | 3 363 400 779 $ US |
| 1986 | 10 248 046 788 $ US | 3 228 227 514 $ US |
| 1985 | 9 465 033 878 $ US | 3 384 170 908 $ US |
| 1984 | 10 191 575 183 $ US | 3 232 033 318 $ US |
| 1983 | 9 769 874 985 $ US | 3 290 114 666 $ US |
| 1982 | 9 226 332 696 $ US | 2 932 696 123 $ US |
| 1981 | 8 437 352 247 $ US | 2 797 358 479 $ US |
| 1980 | 8 303 140 035 $ US | 2 971 257 228 $ US |
| 1979 | 7 597 036 165 $ US | 2 082 933 822 $ US |
| 1978 | 6 517 736 183 $ US | 1 606 852 918 $ US |
| 1977 | 6 249 084 081 $ US | 1 316 486 937 $ US |
| 1976 | 5 410 356 407 $ US | 1 055 835 076 $ US |
| 1975 | 4 666 099 650 $ US | 840 616 812 $ US |
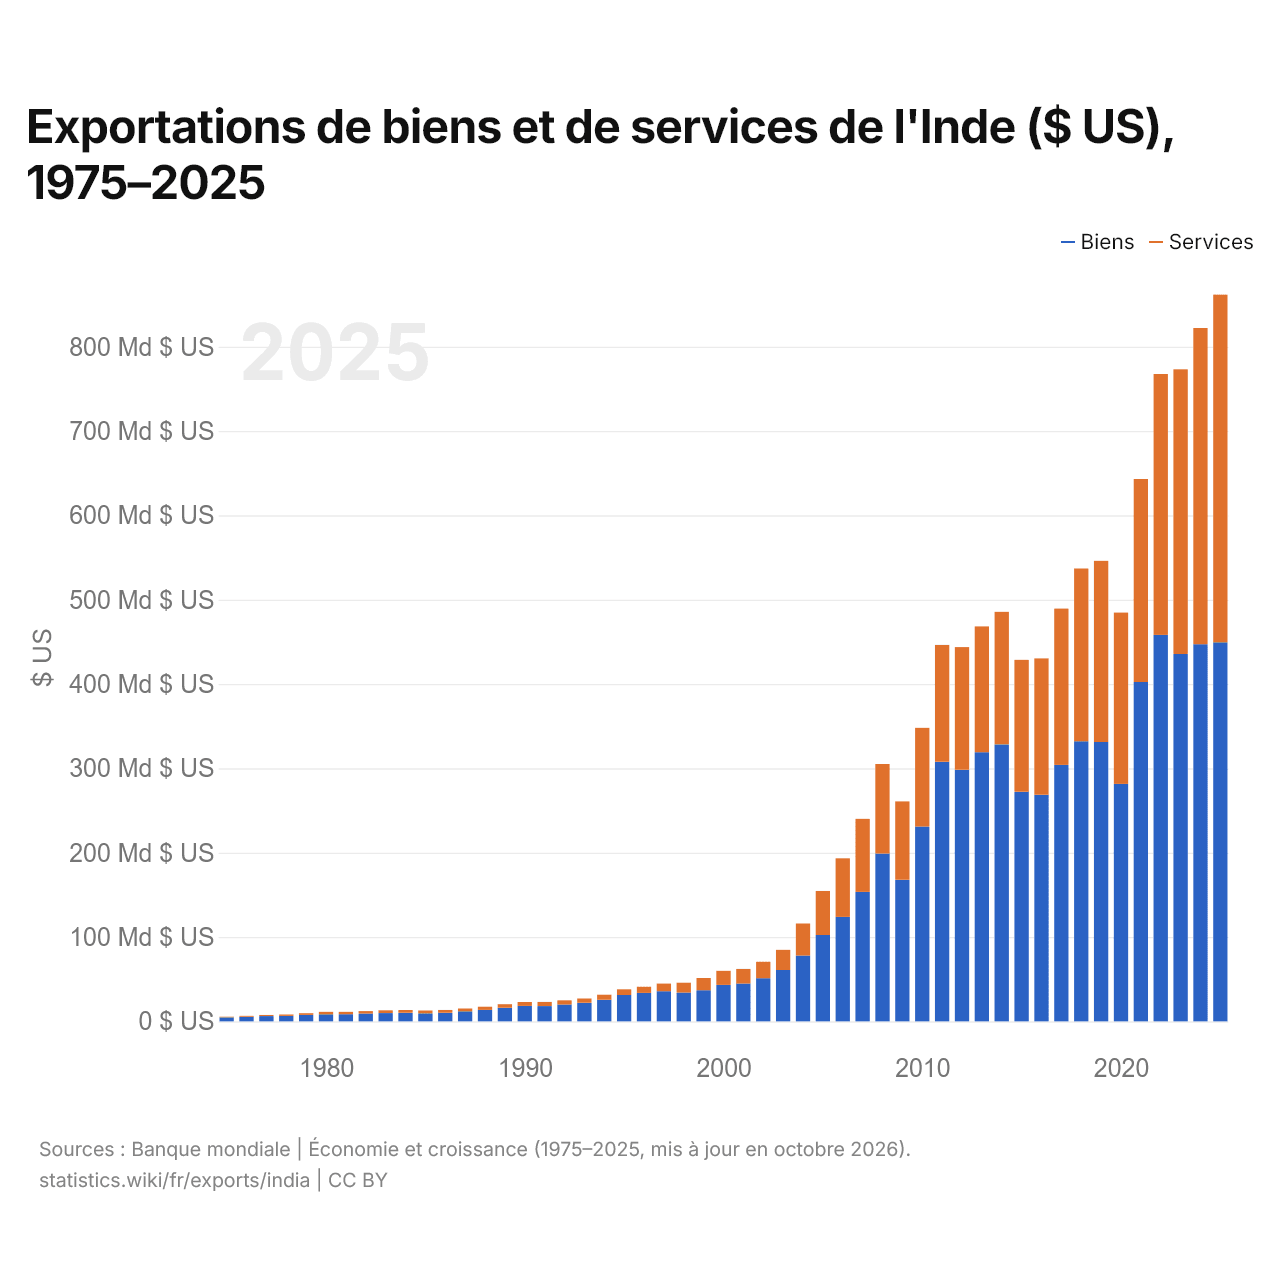
En 2025, les exportations de biens de l'Inde s'élevaient à 449 milliards de dollars et celles de services à 412 milliards de dollars ; les services représentaient 47,8 % du total, contre 15,3 % en 1975.
L'Inde dans le classement mondial des exportations, 2025
| Rang | Pays | Exportations | Part mondiale | |
|---|---|---|---|---|
| 7 |
Singapour
|
1,07 Bn $US | 3,08 % | |
| 8 |
 Irlande |
1,01 Bn $US | 2,9 % | |
| 9 |
 Japon |
971 Md $US | 2,78 % | vs Japon |
| 10 |
 Inde |
881 Md $US | 2,52 % | |
| 11 |
 Corée du Sud |
857 Md $US | 2,46 % | vs Corée du Sud |
| 12 |
 Italie |
822 Md $US | 2,36 % | |
| 13 |
 Suisse |
815 Md $US | 2,33 % | vs Suisse |
Exportations de biens et services de l'Inde, % du PIB, 1960–2025
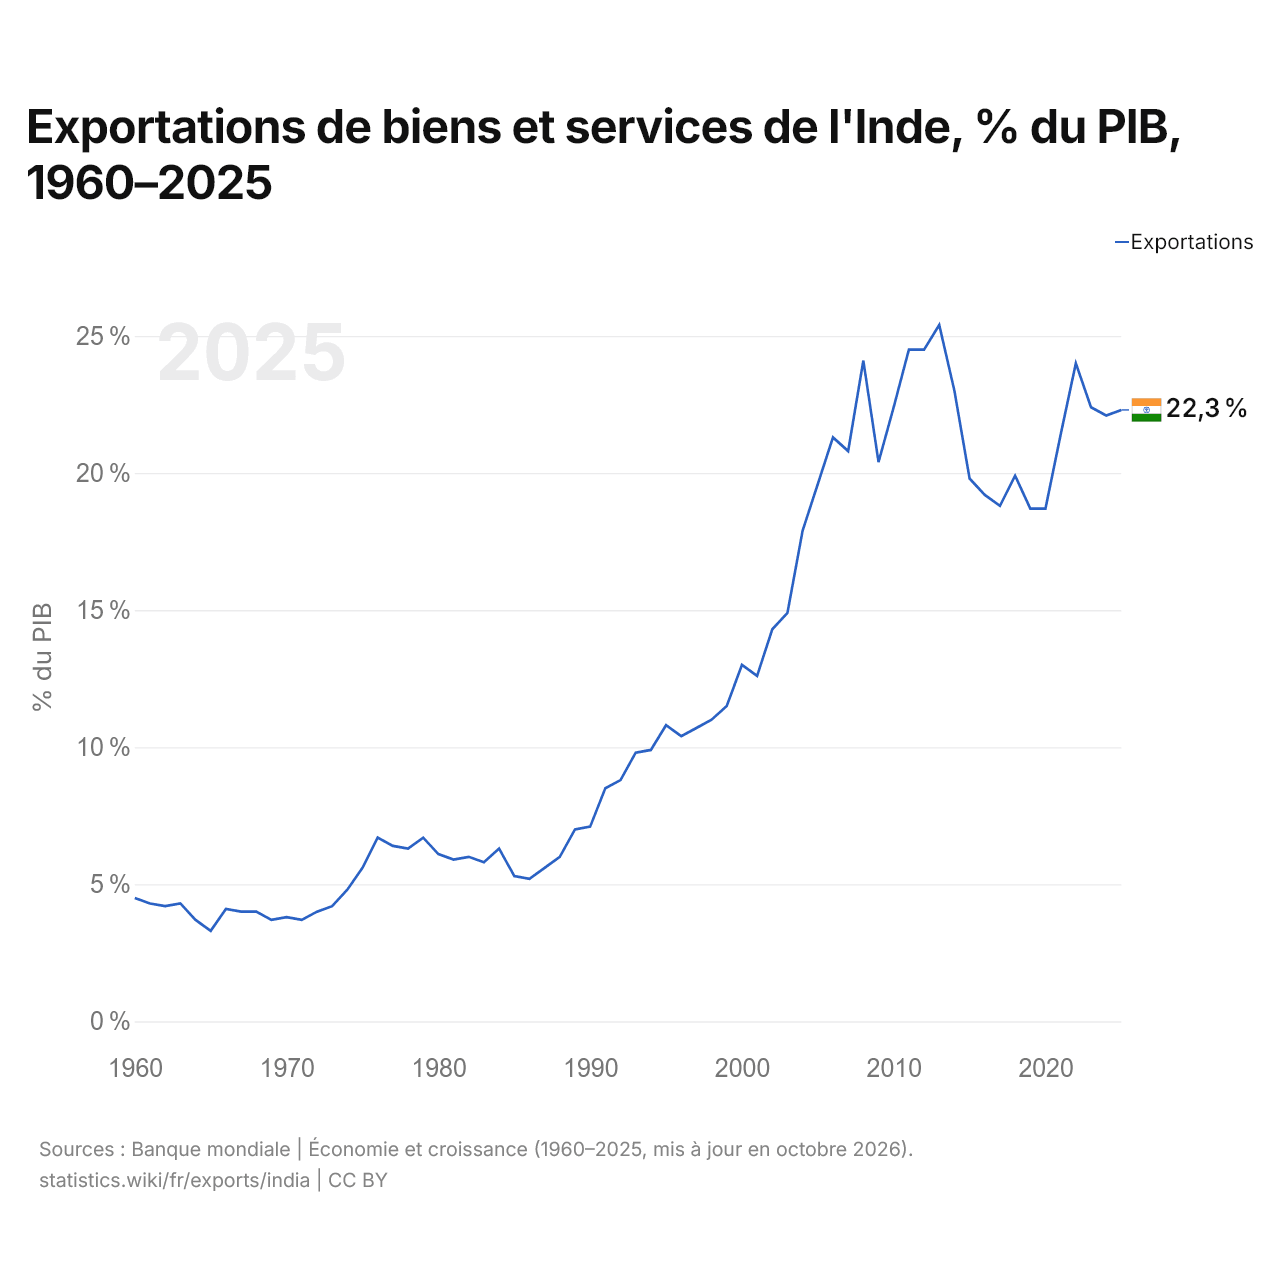
En 2025, les exportations de biens et services de l'Inde équivalaient à 22,3 % de son PIB, contre 4,5 % en 1960. La part la plus élevée a été de 25,4 %, en 2013.
Comparer les exportations de l'Inde avec celles d'autres pays
Sources :
- TradeMap (2001–2025, mis à jour en octobre 2026)
- Banque mondiale | Économie et croissance (1960–2025, mis à jour en octobre 2026)
Creative Commons Attribution (CC BY) : vous pouvez copier, partager, adapter et réutiliser ce contenu, y compris à des fins commerciales, à condition de citer statistics.wiki et d’indiquer les modifications apportées. Les sources citées ci-dessus peuvent avoir leurs propres conditions de licence.